U.S. Department of Transportation
Federal Highway Administration
1200 New Jersey Avenue, SE
Washington, DC 20590
202-366-4000
Conditions and Performance
Status
of the Nation's Highways, Bridges, and Transit:
2002 Conditions and Performance Report
|
Exhibit 9-5:
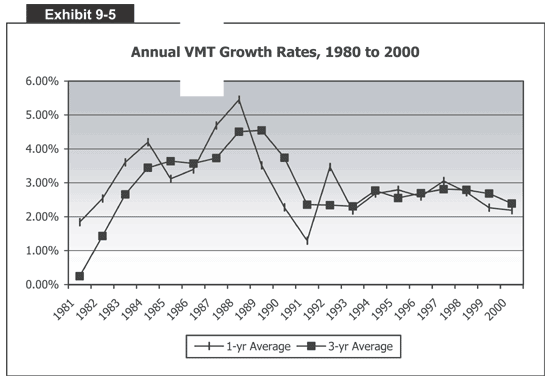
Annual VMT Growth Rates, 1980 to 2000
 Exhibit 9-5 is a chart showing annual vehicle miles traveled (VMT) from 1981 to 2000. The vertical axis measures percentages from 0 to 6 in increments of 1 percent. The horizontal axis measures every year between 1981 and 2000. There are two lines-one for the 1-year average and another for the 3-year average. The 1-year average started at about 1.9 percent in 1981 and steadily rose to about 4.1 percent by 1984. It then dipped the next year to 3 percent only to rise over the next three years to a peak of 5.5 percent in 1988. The 1-year average then plummeted over the next four years to about 1.25 percent in 1991. In 1992 it rose again to about 3.4 percent. Then for the period between 1993 and 2000, it hovered between 2 and 3 percent. The 3-year average started at about 0.2 percent in 1981 and steadily rose to about 3.4 percent in 1984. Over the next three years it stayed at about 3.6 percent, then peaked at around 4.5 percent in 1988 and 1989. The 3-year average then dropped to about 2.3 percent in 1991, where it stayed for two years. Then between 1994 and 2000 it hovered between 2.8 and 2.5 percent.
Back
to Chapter 9
Return to top
Page last modified on November 7, 2014
