U.S. Department of Transportation
Federal Highway Administration
1200 New Jersey Avenue, SE
Washington, DC 20590
202-366-4000
|
Status
of the Nation's Highways, Bridges, and Transit:
2002 Conditions and Performance Report |
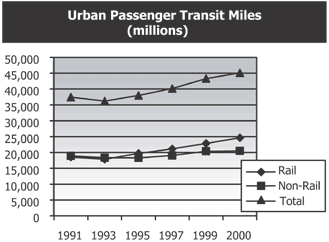
Exhibit ES03B is a chart that shows urban passenger transit miles from 1991 to 2000. The vertical axis measures urban passenger transit miles in millions in increments of 5,000 from 5,000 to 50,000. The horizontal axis measures years: 1991, 1993, 1995, 1997, 1999, and 2000. Rail urban passenger transit miles was about 18,000 million in 1991, dipping to about 17,000 million in 1993, and rising to 19,000 million in 1995. It increased to about 22,000 million in 1997, 23,000 million in 1999, and 25,000 million in 2000. Non-rail urban passenger transit miles was also about 18,000 million in 1991, dipping to about 17,000 million in 1993, and staying at about 17,000 million in 1995. It increased to about 19,000 million in 1997, 20,000 million in 1999, and stayed at about 20,000 million in 2000. Total urban passenger transit miles was about 36,000 million in 1991, dipping to about 35,000 million in 1993, and rising to 38,000 million in 1995. It increased to about 40,000 million in 1997, 43,000 million in 1999, and 45,000 million in 2000.
Back
to Executive Summary

