- Summary
- Highway System Characteristics
- Highways by Ownership
- Highways by Purpose
- Review of Functional Classification Concepts
- Functional Classification Data
- Highway Travel
- Intelligent Transportation Systems
- Bridge System Characteristics
- Bridges by Owner
- Bridges by Functional Classification
- Transit System Characteristics
- Transit Services, and Jurisdiction, and Use
- Transit Fleet and Infrastructure
- System Network (Urban Route Miles)
- System Capacity
- Passenger Travel
- Vehicle Occupancy
- Rural Transit Systems (Section 5311 Providers)
- Transit System Characteristics for Americans with Disabilities and the Elderly (Section 5310 Providers)
- Transit Services, and Jurisdiction, and Use
Bridge System Characteristics
Bridges by Owner
Exhibit 2-13 shows the number of highway bridges by owner from 1996 to 2002. State and local ownership includes highway agencies; park, forest, and reservation agencies; toll authorities; and other State or local agencies, respectively. The vast majority of State and local bridges are owned by highway agencies. Federal ownership includes a number of agencies, mostly from the Department of Interior and the Department of Defense. A small number (less than 1 percent) of bridges carrying public roadways are owned by other agencies, such as private entities and railroads. Ownership percentages have remained relatively constant over time, as shown in Exhibit 2-13.
| Q. | Is information on railroad bridge inspections included in the NBI? |
| A. | Some bridges carrying highway traffic are owned by railroads. For instance, a public road that crosses railroad tracks may be owned by the railroad if built within the railroad right-of-way. Ownership in these cases depends on the agreements made between the political jurisdiction and the railroad. There are a small number of railroad-owned highway bridges in excess of 6 meters in total length in the inventory: 1,016 nationally. Bridges carrying railroads are not included in the database unless they also carry a public road or cross a public road where information of certain features, such as vertical or horizontal clearances, is required for management of the highway system. |
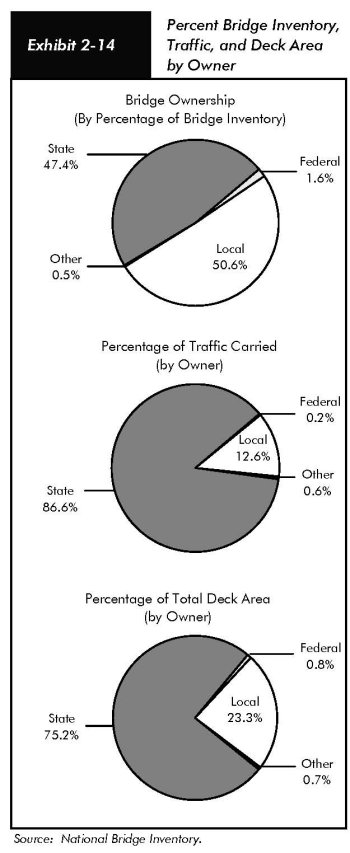
A simple tabulation of the number of bridges by ownership does not take into account the traffic carried by the structure or the size of the structure. Exhibit 2-14 compares the ownership percentages based on the actual number of bridges with percentages based on average daily traffic on bridges and bridge deck area, respectively. Bridges owned by State agencies carry significantly higher cumulative traffic volumes than bridges owned by local agencies. State-owned bridges also tend to have greater deck area than locally owned bridges.
| Number of Bridges by Year | ||||
|---|---|---|---|---|
| Owner | 1996 | 1998 | 2000 | 2002 |
| Federal | 6,171 | 7,748 | 8,221 | 9,371 |
| State | 273,198 | 273,897 | 277,106 | 280,266 |
| Local | 299,078 | 298,222 | 298,889 | 299,354 |
| Private/Railroad | 2,378 | 2,278 | 2,299 | 1,502 |
| Unknown/Unclassified | 1,037 | 1,131 | 415 | 1,214 |
| Total | 581,862 | 583,276 | 586,930 | 591,707 |
| Q. | How do the bridge ownership percentages compare with the road ownership percentages? |
| A. | The majority of bridges and roadways are owned by State and local agencies. The vast majority of roadways, however, are owned by local agencies. Bridge ownership is nearly equally divided between State ownership and local ownership. States tend to own larger, higher volume structures, such as those on Interstates and expressways. Localities own smaller structures on lower volume roadways, such as local roads and collectors. |
| Q. | If an agency owns a bridge, is it responsible for the maintenance and operation of the structure? |
| A. | Bridge maintenance and operation is the responsibility of the owner of the structure. Interagency agreements may be formed, such as those between State highway agencies and localities. In these cases, a secondary agency (such as the State) performs maintenance and operation work under agreement. This, however, does not transfer ownership and therefore does not negate the responsibilities of the bridge owners for maintenance and operation in compliance with Federal and State requirements. |
Bridges by Functional Classification
Highway functional classifications are maintained with the NBI according to the hierarchy used for highway systems previously shown. The number of bridges by functional classification is summarized and compared with previous years in Exhibit 2-15. Overall percentages of each functional classification tend to remain relatively constant over time, although bridges are functionally reclassified as urban boundaries change.
| Functional Classification | 1996 | 1998 | 2000 | 2002 |
|---|---|---|---|---|
| Rural | ||||
| Interstate | 28,638 | 27,530 | 27,797 | 27,316 |
| Other Arterial | 72,970 | 73,324 | 74,796 | 74,814 |
| Collector | 144,246 | 143,140 | 143,357 | 144,101 |
| Local | 211,059 | 210,670 | 209,415 | 209,722 |
| Subtotal | 456,913 | 454,664 | 455,365 | 455,953 |
| Urban | ||||
| Interstate | 26,596 | 27,480 | 27,882 | 27,929 |
| Other Arterial | 59,064 | 60,901 | 63,177 | 65,667 |
| Collector | 14,848 | 14,962 | 15,038 | 15,171 |
| Local | 24,441 | 24,962 | 25,684 | 26,609 |
| Subtotal | 124,949 | 128,305 | 131,781 | 135,376 |
| Total | 581,862 | 582,969 | 587,146 | 591,329 |
Exhibit 2-16 gives additional detail on bridges from the 2002 NBI dataset by cross tabulating the number of bridges by owner and functional classification. There are 378 structures (less than 0.1 percent) that do not have accurately coded functional classifications. These bridges are not included in the 2002 tabulation. Nearly all of the Interstate bridges are owned by State agencies (99.3 percent) with small numbers of Interstate bridges owned by other agencies, primarily in urban areas. Likewise, most of the bridges functionally classified as local (82.4 percent) are owned by cities, counties, townships, and other local agencies.
| Functional Classification | State | Local | Federal | Private/ Railroad |
Other/ Unclassified |
All Owners |
|---|---|---|---|---|---|---|
| Rural | ||||||
| Interstate | 27,283 | 10 | 18 | 4 | 1 | 27,316 |
| Other Principal Arterials | 34,686 | 300 | 55 | 29 | 157 | 35,227 |
| Minor Arterial | 36,682 | 2,414 | 402 | 49 | 40 | 39,587 |
| Major Collector | 52,737 | 41,742 | 179 | 85 | 38 | 94,781 |
| Minor Collector | 16,602 | 31,423 | 1,178 | 89 | 28 | 49,320 |
| Local | 28,177 | 173,578 | 7,255 | 564 | 148 | 209,722 |
| Rural Total | 196,167 | 249,467 | 9,087 | 820 | 412 | 455,953 |
| Urban | ||||||
| Interstate | 27,601 | 307 | 2 | 9 | 10 | 27,929 |
| Other Freeway and Expressway | 15,429 | 970 | 2 | 47 | 396 | 16,844 |
| Other Principal Arterial | 18,785 | 5,317 | 17 | 80 | 108 | 24,307 |
| Minor Arterial | 11,939 | 12,288 | 42 | 146 | 101 | 24,516 |
| Collector | 5,086 | 9,850 | 20 | 114 | 101 | 15,171 |
| Local | 4,956 | 21,096 | 195 | 282 | 80 | 26,609 |
| Urban Total | 83,796 | 49,828 | 278 | 678 | 796 | 135,376 |
| Unclassified | 303 | 59 | 6 | 4 | 6 | 378 |
| TOTAL | 280,266 | 299,354 | 9,371 | 1,502 | 1,214 | 591,707 |
State agencies own the majority of bridges at the higher functional classifications and also own sizeable numbers of bridges across all functional classifications. Approximately 125,000 of the 280,000 State-owned bridges carry principal arterials including Interstates and other freeways and expressways. The remaining structures carry minor arterials, collectors, and local roadways. Of the nearly 300,000 locally owned bridges, the majority carry local roadways and collectors (93 percent). The majority of federal bridges (97 percent) are located in rural areas and carry either local or collector roadways (94 percent).
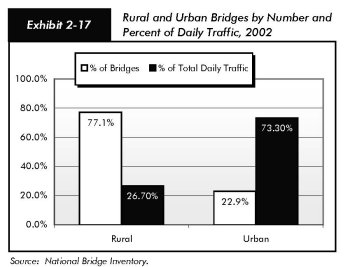
Exhibit 2-17 presents a summary of bridges and traffic carried by rural/urban status. Of all structures, 77.1 percent are located in rural areas. Though only 22.9 percent of the bridges are located in urban areas, these structures carry three-quarters of all daily traffic.