

- Summary
- Highway Operational Performance
- Operational Performance Measures
- Percent of Additional Travel Time
- Annual Hours of Traveler Delay
- Percent of Travel Under Congested Conditions
- Cost of Congestion
- DVMT per Lane Mile
- V/SF Ratio
- Future Research
- System Reliability
- Bottlenecks
- Measuring Performance of ITS Technologies
- Operational Performance Measures
- Transit Operational Performance
- Frequency and Reliability of Services
- Seating Conditions
- Vehicle Utilization—Service Effectiveness
- Average Operating (Passenger-Carrying) Speeds
Summary
Exhibit 4-1 highlights the key highway and transit statistics discussed in this chapter and compares them with the values from the 2002 C&P Report. The first data column contains the values reported in the 2002 report, which were based on 2000 data. Revised 2000 data are shown in the second column. The third column reports 2002 values.
| Statistic | 2000 Data | 2002 Data | |
|---|---|---|---|
| 2002 C&P Report | Revised as of 12/23/04 | ||
| Percent of Additional Travel Time | 51% | 35% | 37% |
| Annual Hours of Traveler Delay per Year | 31.2 | 21.8 | 23.8 |
| Percent of Travel Under Congested Conditions | 33.1% | 29.4% | 30.5% |
| Daily Vehicle-Miles of Travel (DVMT) per Lane-Mile | |||
| Interstates in Urbanized Areas | 15,310 | 15,333 | 15,689 |
| Other Freeways and Expressways in Urbanized Areas | 12,210 | 12,285 | 12,730 |
| Other Principal Arterials in Urbanized Areas | 6,103 | 6,284 | 6,408 |
| Passenger-Mile Weighted Average Operating Speed (miles per hour) | |||
| Total | 19.6 | 20.1 | |
| Rail | 24.9 | 25.8 | |
| Nonrail | 13.7 | 13.8 | |
| Annual Passenger Miles per Capacity-Equivalent Vehicle (thousands) | |||
| Bus | 393 | 393 | 390 |
| Heavy Rail | 784 | 697 | 675 |
| Commuter Rail | 914 | 863 | 831 |
| Light Rail | 688 | 546 | 528 |
| Demand Response | 169 | 188 | 178 |
To examine highway operational performance, this chapter looks at the Percent of Travel Under Congested Conditions, the Percent of Additional Travel Time, and Annual Hours of Traveler Delay. An increase in all three of these measures from 2 years ago indicates a decline in mobility in the urbanized portions of the Nation.
Percent of Travel Under Congested Conditions is defined as the percentage of traffic on the freeways and principal arterial streets in urbanized areas moving at less than free-flow speeds. This measure has increased from 29.4 percent in 2000 to 30.5 percent in 2002. Based on this measure, the average congested period or length of "Rush Hour" has increased 6 minutes from 2000 to 2002. For the purposes of this chapter, "rush hour" is defined as the combined periods of time for the A.M. and P.M. travel times when traffic is moving at less than free-flow speeds. The average "rush hour" in 2002 was approximately 6.6 hours; however, some communities have experienced average lengths of congested periods of up to 8 hours.
| Q. | Why are the revised 2000 values for Percent of Additional Travel Time, Annual Hours of Traveler Delay per Year, and Percent of Travel Under Congested Conditions lower than the 2000 values originally presented in the 2002 Conditions & Performance report? |
| A. | These statistics are calculated by the Texas Transportation Institute (TTI) for the FHWA. Since the release of the 2002 Conditions & Performance Report, the TTI has revised its methodology and recalculated historic figures. The new methodology includes the effects of operational improvements in the calculation of mobility estimates. One major change was improved consideration of the impacts of operational improvements on congestion, which resulted in reduced estimates of congestion levels. |
Percent of Additional Travel Time is an indicator of the additional time required to make a trip during the congested peak travel period rather than at other times of the day. In 2002, a trip that would take 20 minutes during nonpeak, noncongested conditions would typically require 27.4 minutes if taken during the peak period of travel or 37 percent longer. In 2000, that same trip would have required 27.0 minutes if taken during the peak travel period, 35 percent longer than under nonpeak, noncongested conditions.
Annual Hours of Traveler Delay is an indicator of the total time an individual loses in a single year as a result of traveling under congested conditions. In 2002, the average driver experienced a loss of 23.8 hours due to congestion. This is an increase of 2.0 hours over the amount of annual delay in 2000 or an increase of more than 9 percent in only 2 years.
Travel density continues to increase on all functional classes as daily vehicle miles traveled (DVMT) is growing faster than new lane miles are added. DVMT per lane mile on Interstates in urbanized areas grew from 15,333 to 15,689 (2.3 percent) between 2000 and 2002. DVMT per lane mile on urbanized other freeways and expressways grew from 12,285 to 12,730 (3.6 percent) over the same period.
The highway information presented in this chapter is based on data from the Highway Performance Monitoring System (HPMS), work supplied by the Texas Transportation Institute (TTI), and statistics from the Federal Highway Administration Fiscal Year 2005 Performance Plan.
The operational performance of transit affects its attractiveness as a means of transportation. People will be more inclined to use transit that is frequent and reliable, travels more rapidly, has adequate seating capacity, and is not too crowded.
Most transit passengers do not experience unacceptably long waiting times. The 2001 National Household Travel Survey (NHTS) conducted by the Federal Highway Administration (FHWA), the most recent nationwide survey of passenger travel, found that 49 percent of all passengers who ride transit wait 5 minutes or less and 75 percent wait 10 minutes or less. Wait times are correlated with incomes. Higher-income passengers are more likely to be choice riders and ride only if transit is frequent and reliable. In contrast, passengers with lower incomes are more likely to use transit for basic mobility, have more limited alternative means of travel, and therefore, to use transit even when the service is not as frequent or reliable as they may prefer.
Vehicle utilization is one indicator of service effectiveness that measures how well a service output attracts passenger use. It is also a measure of vehicle crowding. Vehicle utilization is calculated as the ratio of the total number of passenger miles traveled annually on each mode to total number of vehicles operated in maximum scheduled service in each mode, adjusted for the passenger-carrying capacity of the mode in relation to the average capacity of the Nation's motor bus fleet. As shown in Exhibit 4-1 vehicle utilization rates have been revised using new capacity-equivalent factors as discussed in Chapter 2. This revision does not affect year-to-year changes. Rail vehicle utilization rates have increased from 1993, peaking in 2000 or 2001 and declining slightly across all rail modes in 2002. With the exception of ferryboats, the utilization of non-rail modes, including buses, was lower in 2002 than in 2000 and 1993.
Average transit operating speeds remained relatively constant between 1993 and 2002, increasing slightly between 2000 and 2002. Average operating speed measures the average speed that a passenger will travel on transit rather than the pure operational speed of transit vehicles. These speeds exclude waiting time and the time spent transferring, but are affected by changes in vehicle dwell times to let off and pick up passengers. In 2002, the average speed was 19.9 miles per hour, up from 19.6 miles per hour in 2000, and just below the 10-year average of 20.1 miles per hour. The average operating speed as experienced by passengers on rail modes was 25.3 miles per hour in 2002, compared with 24.9 miles per hour in 2000, and a 10-year average of 25.8 miles per hour. The average operating speed of nonrail vehicles, which is affected by traffic, road, and safety conditions, was 13.7 miles per hour in 2002, the same as in 2000 and 2001, and just below the 10-year average of 13.8.
Highway Operational Performance
From the perspective of highway users, the ideal transportation system would move people and goods where they need to go when they need to get there, without damage to life and property, and with minimal costs to the user. Highway operational performance can be defined as how well the highway and street systems accommodate travel demand. Trends in congestion, speed, delay, and reliability are all potential metrics for measuring changes in operational performance over time. Safety performance measures are discussed separately in Chapter 5.
While congestion is conceptually easy to understand, it has no universally accepted definition or measurement. The public's perception seems to be that congestion is getting worse, and by some measures it is. However, the perception of what constitutes congestion varies from place to place. Traffic conditions that may be considered congestion in a city of 300,000 may be perceived differently in a city of 3 million people, based on varying history and expectations. These differences of opinion make it difficult to arrive at a consensus of what congestion means, the effect it has on the public, its costs, how to measure it, and how best to correct or reduce it. Because of this uncertainty, transportation professionals examine congestion from several perspectives.
Three key aspects of congestion are severity, extent, and duration. The severity of congestion refers to the magnitude of the problem at its worst. The extent of congestion is defined by the geographic area or number of people affected. The duration of congestion is the length of time that the traffic is congested, often referred to as the "peak period" of traffic flow.
This chapter focuses primarily on measuring operational performance trends from a broad perspective. Chapter 13 discusses issues relating specifically to freight transportation. Chapter 12 includes a discussion of operations strategies that can be effective in addressing some of the operational performance issues identified in this chapter. The "Introduction" to Part II of this report discusses congestion pricing, a potentially effective strategy for reducing peak period congestion. Issues relating to improving the measurement of operational performance are discussed in more depth in the Part V "Afterword" section.
Operational Performance Measures
Daily vehicle miles traveled (DVMT) per lane mile is the most basic measure of the relationship between highway travel and highway capacity, since it is directly based on actual counts of traffic rather than estimated from other data. An increase in this measure over time indicates that the density of traffic is increasing, but does not indicate how this affects speed, delay, or user cost. The traditional congestion measure in this report has been the ratio of volume to service flow (V/SF), the ratio of the volume (V) of traffic using a road in the peak travel hour to the theoretical capacity or service flow (SF). V/SF is limited because it addresses only the severity and not the duration or extent of congestion. In many communities, the major operational performance issue is not that peak congestion is getting worse; it is that the peak period is spreading to occupy an increasing part of the travel day. Focusing on the V/SF measure alone can lead to erroneous conclusions about highway operational performance.
In recent years, the FHWA has adopted three indicators for measuring congestion for use in the annual FHWA Performance Plans: Percent of Additional Travel Time, Annual Hours of Delay, and Percent of Travel Under Congested Conditions. All three measures were included in the FHWA Fiscal Year 2003 Performance Plan, while the FHWA's Fiscal Year 2004 Performance Plan narrowed the focus to the Percent of Travel Under Congested Conditions measure. All three indicators are presented in this chapter.
| Q. | How do the Percent of Additional Travel Time, Annual Hours of Delay, and Percent of Travel Under Congested Conditions values shown in this report compare to those reported by the Texas Transportation Institute (TTI) in its annual Urban Mobility Study? |
| A. | The values shown in this report and in the annual FHWA Performance Plans are calculated by TTI on behalf of the FHWA, using data from the Highway Performance Monitoring System for more than 380 cities/urbanized areas ranging in population from less than 500,000 in population to over 3 million in population are included in this work. The Urban Mobility Study prepared by the TTI concentrates on 85 urban areas in the Nation and could be considered a subset of the cities used in the work for the Performance Plan Congestion/Mobility Measures. TTI's analysis of these cities incorporates additional data sources beyond those in HPMS, which allows for a more detailed analysis. The 85 urbanized areas in the survey do not represent a random sample of all urbanized areas, and instead include most of the largest areas. Consequently, one would not expect the values for these metrics in the Urban Mobility Study to equal the values computed based on the larger set of urbanized areas for the FHWA. |
Percent of Additional Travel Time
Percent of Additional Travel Time is an indicator of the additional time required to make a trip during the congested peak travel period rather than at other times of the day. The additional time required is a result of increased traffic volumes on the roadway and the additional delay caused by crashes, poor weather, special events, or other nonrecurring incidents. It is expressed as the percent of additional time required to make a trip during the congested period of travel.
Exhibit 4-2 shows the growth of the Percent of Additional Travel Time since 1987. In 2002, an average peak period trip required 37 percent longer than the same trip under nonpeak, noncongested conditions. In 1987, an average 20 minute trip during noncongested periods required 24.4 minutes under congested conditions. The same trip in 2002 required 27.4 minutes or an additional 3 minutes.
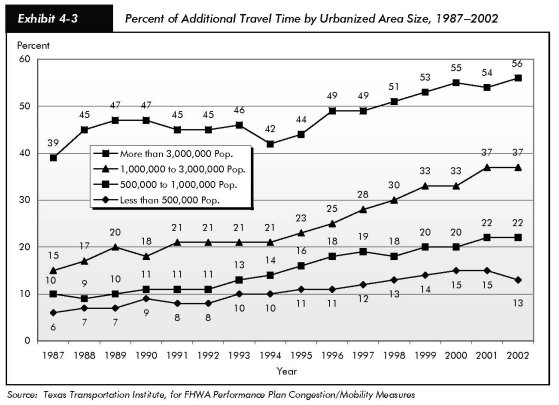
Exhibit 4-3 demonstrates that the additional travel time required because of congestion tends to be higher in larger urbanized areas than smaller ones. However, the largest increase from 1987 to 2002 occurred in urbanized areas with populations between 1 million and 3 million, as the Percent of Additional Travel Time increased from 15 to 37 percent. This equates to a 4.4 minute increase (from 23.0 to 27.4 minutes) for an average trip that would require 20 minutes during noncongested periods.
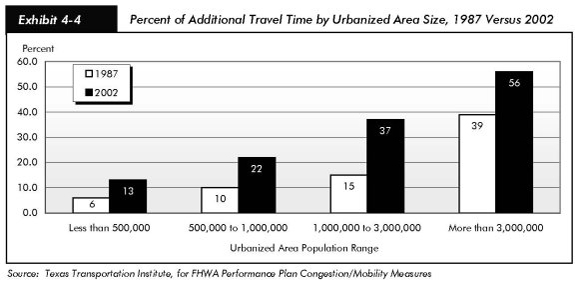
Exhibit 4-4 directly compares the years 1987 and 2002 to emphasize the impact of increased congestion. The exhibit shows that, in 2002, smaller urbanized areas with populations of less than 500,000 are experiencing nearly the same level of additional travel time because of congestion as urbanized areas with populations of 1 million to 3 million experienced in 1987. This indicates a growing and expanding problem for the Nation's urban highway system.

| Year | Percent Additional Travel Time |
|---|---|
| 1987 | 22% |
| 1988 | 26% |
| 1989 | 28% |
| 1990 | 28% |
| 1991 | 27% |
| 1992 | 26% |
| 1993 | 27% |
| 1994 | 26% |
| 1995 | 27% |
| 1996 | 30% |
| 1997 | 30% |
| 1998 | 32% |
| 1999 | 34% |
| 2000 | 35% |
| 2001 | 36% |
| 2002 | 37% |
Performance Plan Congestion/Mobility Measures
Annual Hours of Traveler Delay
Annual Hours of Traveler Delay represents the average number of hours per year that drivers are delayed in traffic because of recurring congestion and incidents, such as breakdowns and crashes. Exhibit 4-5 shows that, in 2002, the average driver lost 23.8 hours because of congestion. This is an increase of 2 hours over the amount of annual delay in 2000, or an increase of more than 9 percent in only 2 years. It is an increase of 10.6 hours, or more than 80 percent, since 1987.
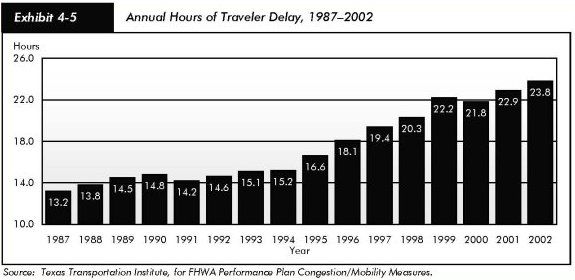
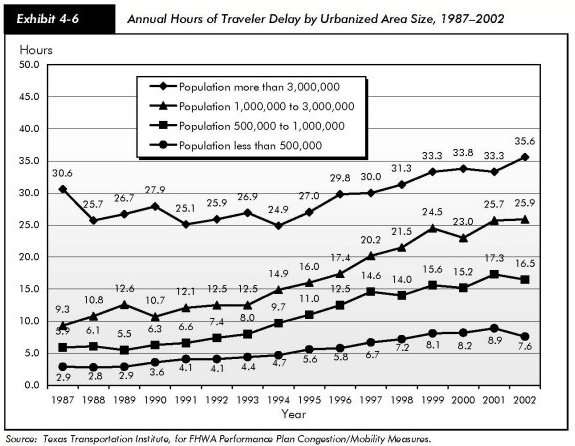
Exhibit 4-6 shows that cities over 3 million in population have experienced an increase of nearly 2 hours in the Annual Hours of Traveler Delay per traveler since 2000. The average delay per traveler for these cities was 35.6 hours per driver per year in 2002. Cities with populations between 1 million and 3 million experienced the greatest increase in number of hours of annual delay per person, from 23.0 hours in 2000 to 25.9 hours in 2002, for an increase of 2.9 hours of delay per person over the 2-year period. Cities with populations of less than 500,000 actually experienced a decline in traveler delay since 2000—from 8.9 hours to 7.6 hours, a decrease of more than 14 percent.
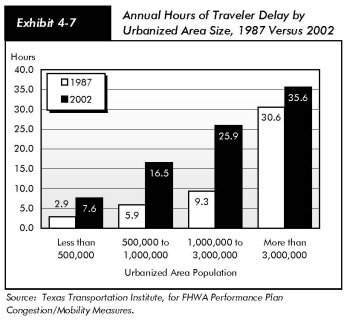
Overall, the level of traveler delay in all urbanized areas is greater than that of 1987. Even though urban areas with populations of less than 500,000 had a decline in traveler delay from 2000 to 2002, drivers in these areas in 2002 were contending with greater delay than drivers in cities double their size in 1987, but without the accompanying population growth. The level of delay faced by drivers in cities of less than 500,000 population in 2002 was approaching that experienced by drivers in cities of 1,000,000 to 3,000,000 in 1987. The significance of the impact of increased Annual Hours of Traveler Delay is shown in Exhibit 4 7.
Percent of Travel Under Congested Conditions
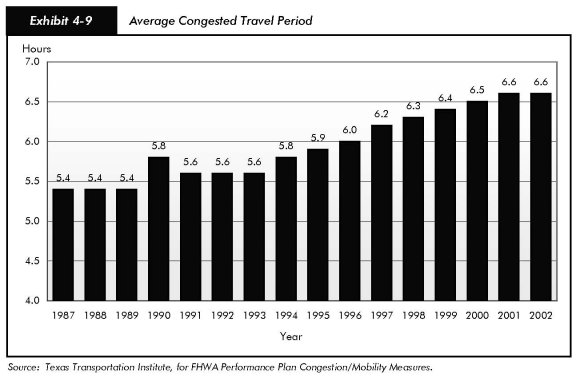
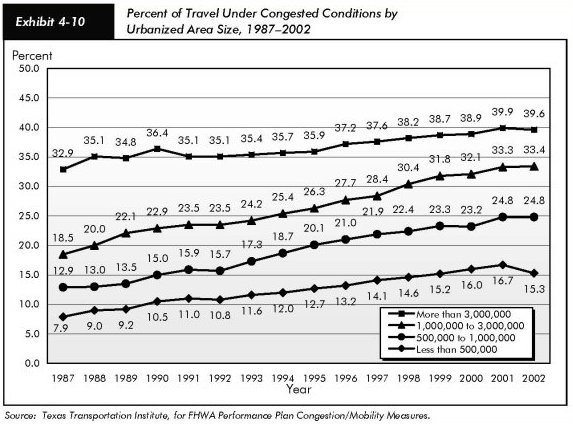
The Percent of Travel Under Congested Conditions is defined as the percentage of daily traffic on freeways and principal arterial streets in urbanized areas moving at less than free-flow speeds. Exhibit 4-8 shows that this percentage has increased from 29.3 percent in 2000 to 30.4 percent in 2002. The average congested travel period has increased from 5.4 hours in 1987 to 6.6 hours in 2002-an increase in length of 72 minutes, or more than 22 percent, over a period of 15 years (Exhibit 4-9).
| Q. | What goal was set for the Percent of Travel Under Congested Conditions in the FHWA FY 2005 Performance Plan? |
| A. | The plan observes that this percentage has increased by annual rates ranging from 0.3 to 1.1 in recent years. The goal adopted in the FHWA Performance Plan is to slow the annual rate of increase to 0.5 percent. The target is to hold the increase to 33.0 percent in FY 2005, or 0.2 percent below a projected increase of 33.2 percent. |
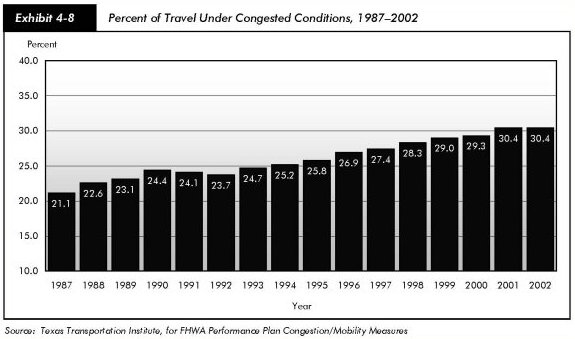
Exhibit 4-9 illustrates a major problem encountered on a daily basis by all users of highway systems in urbanized areas. According to research done by the TTI, periods of recurring congestion are getting longer. What has been called "rush hour" has seen a steady increase in length since 1993. In some urbanized areas, recurring congestion is now no longer restricted to the traditional peak commuting periods but extends throughout the workday resulting in continuous travel delays for highway users. Recurring congestion also occurs on heavily traveled routes on Saturdays and Sundays so that even recreational travel is adversely impacted in urbanized areas.
Exhibit 4-10 shows that in 2002, 39.6 percent of daily travel in urban areas with populations greater than 3 million occurred under congested conditions. For urban areas with populations of less than 500,000, the Percent of Congested Travel was 15.3 percent in 2002.
Not only are congestion periods lengthening, but more roads and lanes are affected at any one time. In the past, recurring congestion tended to occur only in one direction—toward downtown in the morning and away from it in the evening. Today, two-directional congestion is common, particularly in the most congested metropolitan areas.
Cost of Congestion
Congestion has an adverse impact on the American economy, which values speed, reliability, and efficiency. Transportation is a critical link in the production process for many businesses as they are forced to spend money on wasted fuel and drivers' salaries that might otherwise be invested in research and development, firm expansion, or other activities.
The problem is of particular concern to firms involved in logistics and distribution. As just-in-time delivery increases, firms need an integrated transportation network that allows for the reliable, predictable shipment of goods. Congestion, then, is a major hurdle for businesses in the Nation's economy.
The TTI's 2004 Urban Mobility Report estimates that, in the 85 urban areas studied in 2002, drivers experienced in excess of 3.5 billion hours of delay and wasted 5.66 billion gallons of fuel. The total congestion cost for these areas, including wasted fuel and time, was estimated to be approximately $63.2 billion. Over 61 percent of that cost, or approximately $38.7 billion, was experienced in the 10 metropolitan areas with the most congestion. Exhibit 4-11 shows the 20 urban areas with the highest congestion costs, according to the TTI.
| Q. | Are there major changes to the methods used in the 2004 Urban Mobility Study compared to the methods used in the 2001 Urban Mobility Study cited in the 2002 Conditions & Performance report? |
| A. | Two major changes were made in the 2004 Urban Mobility Study.
|
| Q. | What was reported in the 2001 National Household Travel Survey on the public perception of congestion on the Nation's highway system? |
| A. | The NHTS asked respondents to classify their views of various transportation system issues, including congestion, in one of five categories. The overall response was more positive than expected, given the prominence of the congestion issue in public discourse. Almost half (49.3 percent) of the survey respondents reported that congestion was not a problem or a little problem. Those that gave this response are largely older (65+) or younger (16-19), not working, and living in rural or small towns. Only 28 percent overall said congestion was very much of a problem or a severe problem. However, for those people living in the largest metro areas (3 million or more in population) only 37.2 percent said congestion was not a problem or a little problem, with just as many (39.5 percent) saying it was very much of a problem or a severe problem. Additional information from the 2001 NHTS may be found at http://nhts.ornl.gov/2001/index.shtml. |
| Urban Area | Annual Cost of Congestion | Annual Excess Fuel Consumed | Annual Travel Delay | |||
|---|---|---|---|---|---|---|
| Millions of Dollars | 2002 Rank | Millions of Gallons | 2002 Rank | Thousands of Hours | 2002 Rank | |
| Los Angeles-Long Beach-Santa Ana, CA | 11,231 | 1 | 931 | 1 | 625,063 | 1 |
| New York-Newark, NY-NJ-CT | 7,079 | 2 | 646 | 2 | 394,709 | 2 |
| Chicago, IL-IN | 4,221 | 3 | 365 | 3 | 237,849 | 3 |
| San Francisco-Oakland, CA | 2,779 | 4 | 245 | 4 | 153,195 | 4 |
| Dallas-Fort Worth-Arlington, TX | 2,603 | 5 | 239 | 5 | 147,482 | 5 |
| Miami-Hialeah, FL | 2,558 | 6 | 221 | 6 | 144,824 | 6 |
| Washington, DC-MD-VA | 2,274 | 7 | 203 | 7 | 126,626 | 7 |
| Houston, TX | 2,178 | 8 | 198 | 8 | 123,547 | 8 |
| Detroit, MI | 1,939 | 9 | 176 | 9 | 109,056 | 9 |
| Philadelphia, PA-NJ-DE-MD | 1,871 | 10 | 172 | 10 | 105,528 | 10 |
| Atlanta, GA | 1,717 | 11 | 168 | 11 | 97,220 | 11 |
| Boston, MA-NH-RI | 1,440 | 12 | 130 | 12 | 81,105 | 12 |
| San Diego, CA | 1,314 | 13 | 119 | 13 | 72,126 | 14 |
| Phoenix, AZ | 1,289 | 14 | 116 | 14 | 72,148 | 13 |
| Seattle-Everett, WA | 1,175 | 15 | 110 | 15 | 65,276 | 15 |
| Baltimore, MD | 1,069 | 16 | 101 | 16 | 59,760 | 16 |
| Minneapolis-St. Paul, MN | 971 | 17 | 93 | 17 | 54,606 | 17 |
| Denver-Aurora, CO | 954 | 18 | 83 | 18 | 54,123 | 18 |
| Riverside-San Bernardino, CA | 904 | 19 | 80 | 19 | 49,800 | 19 |
| San Jose, CA | 871 | 20 | 77 | 20 | 48,015 | 20 |
| Totals: | 50,437 | 4,473 | 2,822,058 | |||
DVMT per Lane Mile
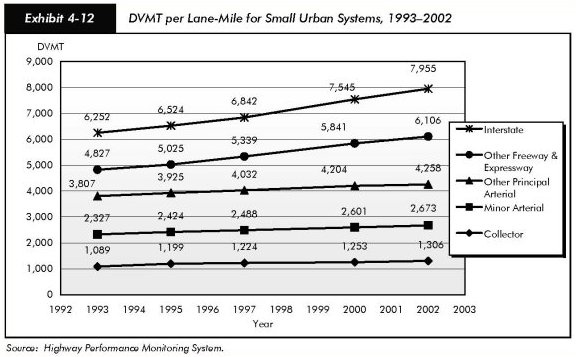
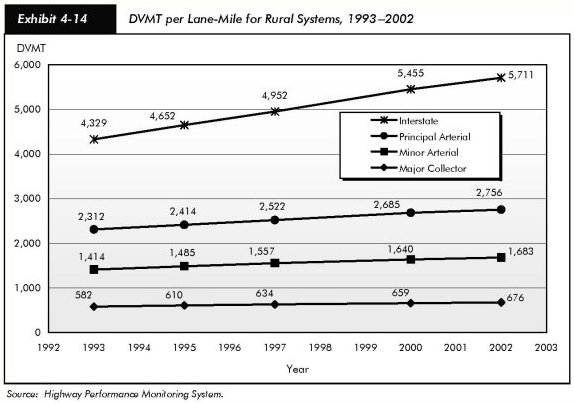
As discussed earlier in this chapter, DVMT per Lane Mile is a basic measure of travel density that does not fully capture the effects of congestion. However, this measure does indicate that the demand for travel is growing faster than the supply of highways. Exhibits 4-12, 4-13 and 4-14 show that the volume of travel per lane mile has increased from 1993 to 2002 on every functional highway system for which data are collected.
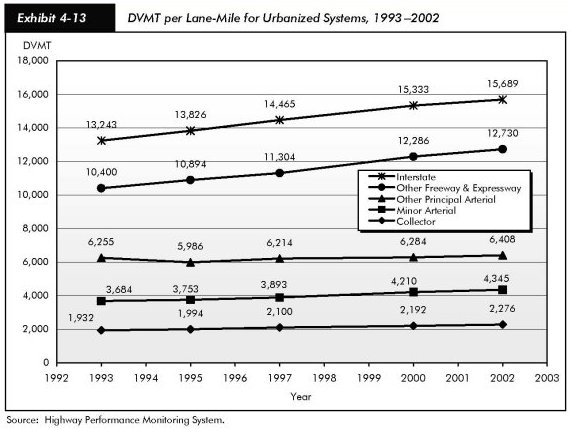
The largest magnitude increase occurred on the Interstate system in the larger urban areas, where the DVMT per lane-mile increased by 2,446 between 1993 and 2002 (Exhibit 4-13).
The largest percentage increase occurred on the Interstate system in rural areas, where the DVMT per lane-mile increased by 31.9%, from 4,329 to 5,711 between 1993 and 2002 (Exhibit 4-14).
V/SF Ratio
As discussed earlier in this chapter, the V/SF ratio compares the number of vehicles (V) traveling in a single lane in one hour with the theoretical service flow (SF), or the theoretical maximum number of vehicles that could utilize the lane in an hour. The major shortcoming of the V/SF ratio is that it is a single-time indicator of congestion; in other words, it provides a snapshot of what is occurring on a highway section at a particular time, but does not provide a measure of the length of time of a congested period. Also, it does not provide an indication of the effect on congestion caused by emergency situations, adverse weather conditions, construction activities, or any congestion-creating events other than those caused by additional traffic on a facility.
This measure of congestion severity shows mixed results. Based on the V/SF ratio, congestion has increased on 46 percent of the functional classes, decreased on 43 percent, and remained constant on 11 percent since 2000. This indicates that the increases in congestion indicated by broader measures, such as the Percent of Travel Under Congested Conditions cited earlier, could be a function of increases in the duration and extent of congestion, which are aspects of the problem that the V/SF ratio does not address.
Exhibit 4-15 shows the percentage of peak-hour travel meeting or exceeding a V/SF of 0.80 as well as that exceeding 0.95. A level of 0.80 is frequently used as a threshold for classifying highways as "congested," while a level of 0.95 is frequently described as "severely congested." For urbanized Interstates, 64.3 percent had peak-hour travel with a V/SF ratio of 0.80 or higher. Not surprisingly, the values for small urban and rural Interstates were lower.
| Functional System | 1995 | 1997 | 2000 | 2002 | ||||
|---|---|---|---|---|---|---|---|---|
| V/SF ≥ 0.80 | V/SF ≥ 0.95 | V/SF ≥ 0.80 | V/SF ≥ 0.95 | VvSF ≥ 0.80 | V/SF ≥ 0.95 | V/SF ≥ 0.80 | V/SF ≥ 0.95 | |
| Rural | ||||||||
| Interstate | 9.9% | 2.4% | 11.0% | 3.6% | 10.4% | 3.3% | 15.9% | 4.8% |
| Principal Arterial | 6.8% | 3.2% | 7.0% | 3.2% | 7.4% | 3.8% | 6.9% | 3.8% |
| Minor Arterial | 4.4% | 2.5% | 4.2% | 1.9% | 4.6% | 2.2% | 4.8% | 2.2% |
| Major Collector | 2.8% | 1.6% | 2.4% | 1.2% | 2.3% | 1.0% | 2.3% | 1.4% |
| Small Urban | ||||||||
| Interstate | 15.2% | 5.5% | 13.2% | 4.7% | 7.7% | 3.2% | 13.2% | 5.5% |
| Other Freeway & Expressway | 12.7% | 4.6% | 11.3% | 6.6% | 12.5% | 6.3% | 17.9% | 8.9% |
| Other Principal Arterial | 12.1% | 6.8% | 11.6% | 6.4% | 13.2% | 6.0% | 9.0% | 3.8% |
| Minor Arterial | 14.0% | 7.0% | 13.1% | 6.6% | 14.3% | 8.0% | 12.3% | 6.3% |
| Collector | 9.7% | 6.4% | 9.7% | 5.6% | 9.9% | 5.7% | 8.4% | 4.9% |
| Urbanized | ||||||||
| Interstate | 53.4% | 28.7% | 55.0% | 30.0% | 50.0% | 26.0% | 64.3% | 40.2% |
| Other Freeway & Expressway | 46.8% | 26.0% | 47.5% | 26.4% | 46.4% | 28.3% | 56.7% | 35.4% |
| Other Principal Arterial | 33.1% | 22.2% | 29.6% | 18.1% | 29.3% | 16.4% | 22.3% | 10.2% |
| Minor Arterial | 26.7% | 16.8% | 25.2% | 14.1% | 26.4% | 14.5% | 18.6% | 9.3% |
| Collector | 24.4% | 15.7% | 21.0% | 13.4% | 20.3% | 13.7% | 18.2% | 9.3% |
Future Research
Measurement of congestion is still a difficult problem. Substantial research has supported the use of delay as the definitive measure of congestion. Delay is certainly important; it exacts a substantial cost from the traveler and, consequently, from the consumer. However, it does not tell the complete story. Moreover, there currently is no direct measure of delay that is inexpensive and reliable to collect. Reliability is another important characteristic of any transportation system, one that industry in particular requires for efficient production. If a given trip requires 1 hour on one day and 1.5 hours on another day, an industry that is increasingly relying on just-in-time delivery suffers. It cannot plan effectively for variable trip times. Additional research is needed to determine what measures should be used to describe congestion and what data will be required to supply these measures.
System Reliability
The FHWA is working on a new measure of reliability—the Buffer Index. This index measures the percentage of extra time travelers allow for congestion in order to arrive at a location on-time 95 percent of the time. While 2002 data are currently available for 23 cities, the FHWA is working with the TTI to collect 2003 data for approximately 30 cities. This measure and other measures currently under development will be refined and applied to additional cities as detectors are deployed and data are accumulated.
The importance of reliability is underscored by a recently completed study of temporary losses of capacity for the FHWA by Oak Ridge National Laboratory. Temporary capacity losses due to work zones, crashes, breakdowns, adverse weather, sub-optimal signal timing, toll facilities, and railroad crossings caused over three and a half billion vehicle-hours of delay on U.S. freeways and principal arterials in 1999. For journeys during peak commuting periods on regularly congested highways, temporary capacity losses added 6 hours for every 1,000 miles of travel to the recurring delay described earlier in this chapter. Americans suffer two and a half hours of delay per 1,000 miles of travel from temporary capacity loss for journeys on roads that do not experience recurring congestion.
Bottlenecks
A February 2004 report prepared by Cambridge Systematics for the American Highway Users Alliance, Unclogging America's Arteries: Effective Relief for Highway Bottlenecks 1999 – 2004, listed 233 locations in urban areas that it classified as bottlenecks. Traffic congestion occurs in these areas because of sudden reduction in number of lanes or a major increase in traffic volume for a specific freeway section beyond its capacity. The report estimated the benefits resulting from eliminating the 24 worst bottleneck locations. Improvements to these locations may prevent an estimated 449,606 crashes, including 1,787 fatalities and 220,760 injuries. Major reductions in pollutants also were cited as a benefit, including 101,320 tons of carbon monoxide and 10,449 tons of volatile organic compounds. Peak period user delay for the 233 locations may be reduced by an estimated 74.5 percent, which translates to approximately 32 minutes each day per commuter.
Further research into bottlenecks and the benefits of addressing them could be of significant value in determining the best ways to address growing congestion in the Nation's urbanized areas.
Measuring Performance Using ITS Technologies
The deployment of intelligent transportation systems (ITS) technologies provides opportunities for improved measurement of performance. For example, speeds and travel time could be measured directly and unobtrusively by sensors in or beside roadways, rather than through rough approximations based on vehicle counts or surveys. Travel time can also be measured through communications systems used in vehicles, such as monitoring truck movements in significant freight corridors as described in Chapter 13. Methods for compiling ITS data, removing spurious observations, and producing useful statistics are still under development.