- Summary
- Highways and Bridges
- Transit
- Highway and Bridge Finance
- Revenue Sources
- Historical Revenue Trends
- Highway Expenditures
- Types of Highway Expenditures
- Historical Expenditure and Funding Trends
- Constant Dollar Expenditures
- Constant Dollar Expenditures per VMT
- Highway Capital Outlay Expenditures
- Capital Outlay by Improvement Type
- Transit Finance
- Transit Funding
- Level and Composition of Public Funding
- Federal Funding
- State and Local Funding
- Level and Composition of System-Generated Funds
- Trends in Public Funding
- Funding in Current and Constant Dollars
- Flexible Funding
- Capital Funding and Expenditures
- Operating Expenditures
- Operating Expenditures by Transit Mode
- Operating Expenses by Type of Cost
- Financial Efficiency
- Cost Effectiveness
- Rural Transit
- Innovative Finance
- Credit Assistance
- TIFIA
- State Infrastructure Banks
- Debt Financing
- GARVEE
- Public-Private Partnerships
- Credit Assistance
Transit Finance
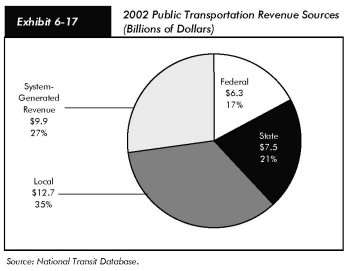
In 2002, $36.5 billion was available from all sources to finance transit investment and operations. Transit funding comes from two major sources: public funds allocated by Federal, State, and local governments; and system-generated revenues earned for the provision of transit services. Federal funding for transit includes fuel taxes dedicated to transit from the Mass Transit Account (MTA) of the Highway Trust Fund (HTF), as well as undedicated taxes allocated from Federal general fund appropriations. State and local governments also provide funding for transit from their general fund appropriations, as well as from fuel, income, sales, property, and other unspecified taxes, specific percentages of which may be dedicated to transit [Exhibit 6-16]. These percentages vary considerably among taxing jurisdictions and by type of tax. Other public funds from sources such as toll revenues and general transportation funds may also be used to fund transit. System-generated revenues are composed principally of passenger fares, although additional revenues are also earned by transit systems from advertising and concessions, park-and-ride lots, investment income, and rental of excess property and equipment. Exhibit 6-17 breaks down the sources of total transit funding. The most notable change in transit funding between 2000 and 2002 was a 73 percent increase in public funding from local sources from $2.7 billion to $4.7 billion.
| Federal | State | Local | Total | Percent | |
|---|---|---|---|---|---|
| Public Funds | $6,296 | $7,546 | $12,748 | $26,590 | 72.9% |
| General Fund | 1,259 | 2,118 | 2,641 | 6,017 | 16.5% |
| Fuel Tax | 5,037 | 620 | 105 | 5,762 | 15.8% |
| Income Tax | 247 | 105 | 352 | 1.0% | |
| Sales Tax | 2,005 | 4,183 | 6,188 | 17.0% | |
| Property Tax | 22 | 502 | 524 | 1.4% | |
| Other Dedicated Taxes | 881 | 493 | 1,374 | 3.8% | |
| Other Public Funds | 1,653 | 4,720 | 6,372 | 17.5% | |
| System-Generated Revenue | 9,890 | 27.1% | |||
| Passenger Fares | 8,130 | 22.3% | |||
| Other Revenue | 1,760 | 4.8% | |||
| Total All Sources | $36,480 | 100.0% |
| Q. | What type of dedicated funding does mass transit receive from Federal highway-user fees? |
| A. | Prior to FY 1983, all funding for transit was from general revenue sources. In 1983, the Mass Transit Account (MTA) was established within Highway Trust Fund (HTF), funded by 1.0 cent of the Federal motor-fuel tax. In 1990, the portion of the Federal fuel tax dedicated to MTA was increased to 1.5 cents, in 1995 to 2.0 cents, in 1997 to 2.85 cents, and in 1998 to 2.86 cents (retroactive to October 1, 1997) with the passage of TEA-21. Since 1997, 2.86 cents of Federal highway-user fees on gasohol, diesel and kerosene fuel, and other special fuels, including benzol, benzene, and naptha, have also been dedicated to the MTA. (Since 1997, the total Federal fuel tax for a gallon of gasoline has been 18.4 cents and the total tax for a gallon of diesel has been 24.4 cents.) Since 1997, the MTA has also received 2.13 cents of the user fee on liquefied petroleum gas and 1.86 cents of the user fee on liquefied natural gas. (The total Federal fuel tax for a gallon of LPG has been 11.9 cents and the total tax for a gallon of LNG has been 48.54 cents.) The MTA does not receive any of the nonfuel revenues (such as heavy vehicle use taxes) that accrue to the HTF. |
Level and Composition of Public Funding
In 2002, public funds of $26.6 billion were available for transit and accounted for 73 percent of total transit funding. Of this amount, Federal funding was $6.3 billion, accounting for 24 percent of total public funding and for 17 percent of all available funding from both public and nonpublic sources. [Note that the $6.3 billion Federal funding amount is for transit capital and operating expenses only, and is lower than total Federal funding allocated to FTA.] State funding was $7.5 billion, accounting for 28 percent of total public funds and 21 percent of funding from all sources. Local jurisdictions provided the bulk of transit funds, $12.7 billion in 2002, or 48 percent of total public funds and 35 percent of all funding. System-generated revenues were $9.9 billion, 27 percent of all funding.
Federal Funding
Federal funding for transit comes from two sources, the general revenues of the U.S. government and revenues credited to MTA of HTF generated from fuel taxes. The MTA, a transit trust fund for capital projects in transit, is the largest source of Federal funding for transit and accounts for approximately 80 percent of total Federal funds for transit. Allocations from the Federal general fund contribute the remaining 20 percent. Total funding from MTA in nominal dollars increased from $0.5 billion in 1983 to $5.0 billion in 2002.
State and Local Funding
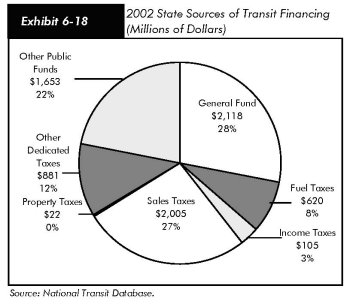
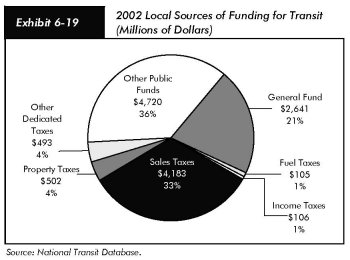
General funds and other dedicated public funds are important sources of funding for transit at both the State and local levels [Exhibits 6-18 and 6-19]. In 2002, 28 percent of State funds and 21 percent of local funds came from general revenues. Allocations from other public funds accounted for 22 percent of total State and 36 percent of total local funding for transit. Dedicated sales taxes are a major source of funding for transit at both the State and local level. In 2002, they accounted for 27 percent of total State and 33 percent of total local funding for transit. Dedicated income and property taxes provide more modest levels of funding at both the State and local levels. Dedicated income taxes are a more important source of transit funds at the State level, whereas dedicated property taxes are more important at the local level.
Level and Composition of System-Generated Funds
In 2002, system-generated funds were $9.9 billion and provided 27.1 percent of total transit funding. Passenger fares contributed $8.1 billion, accounting for 82 percent of system-generated funds and 22 percent of total transit funds. These passenger fare figures do not include payments by State entities to transit systems to offset reduced transit fares for certain segments of the population, such as students and the elderly. These payments are included in other revenues.
Trends in Public Funding
Prior to 1962, there was no Federal funding for transit. State and local funding was limited, equal to about 13 percent of total public funding for transit in 2002 in real terms. Public funding for transit grew rapidly in the 1970s. Federal funding increased at an average annual rate of 38.9 percent, and State and local funding increased at an average annual rate of 11.9 percent throughout the decade. Federal funding grew much more slowly during the 1980s, increasing at an average annual rate of 0.4 percent, while funding at the State and local levels continued to grow steadily at an average annual rate of 7.8 percent. During the 1990s, Federal funding for transit grew more rapidly than in the 1980s, increasing at an average annual rate of 4.3 percent. However, State and local government funding grew more slowly than in the preceding decade, increasing at an average annual rate of 4.8 percent. Since 2000, the increase in public funding for transit has picked up at the Federal, State, and local levels. Between 2000 and 2002, Federal funding increased at an average annual rate of 9.4 per cent, and State and local funding at an average annual rate of 13.6 percent [Exhibit 6-20].

| 1960–2002 Year |
Average Annual Growth Rate | ||
|---|---|---|---|
| Federal | State and Local |
Total | |
| 1960–70 | na | 8.2% | 9.0% |
| 1970–80 | 38.9% | 11.9% | 17.2% |
| 1980–90 | 0.4% | 7.8% | 5.3% |
| 1990–00 | 4.3% | 4.8% | 4.7% |
| 2000–02 | 9.4% | 13.6% | 12.5% |
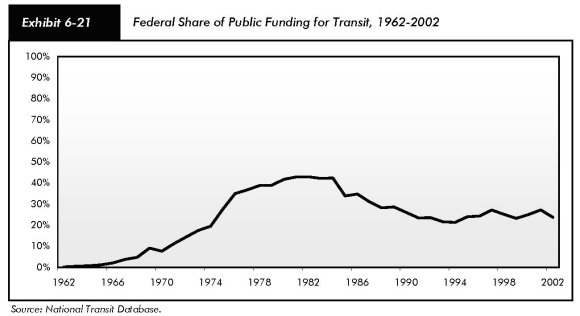
Federal funding for transit, as a percentage of total public funding for transit from Federal, State, and local sources combined, reached a peak of 43.0 percent in the early 1980s [Exhibit 6-21]. However, by 1990, the Federal government provided only 26 percent of the total public funding available for transit. This lower percentage was the result of the growth in State and local funding for transit vastly exceeding the growth of Federal funding during the 1980s. Since 1990, the Federal government has provided between 21 and 27 percent of total public funding for transit; in 2002, it provided 24 percent of these funds.
Funding in Current and Constant Dollars
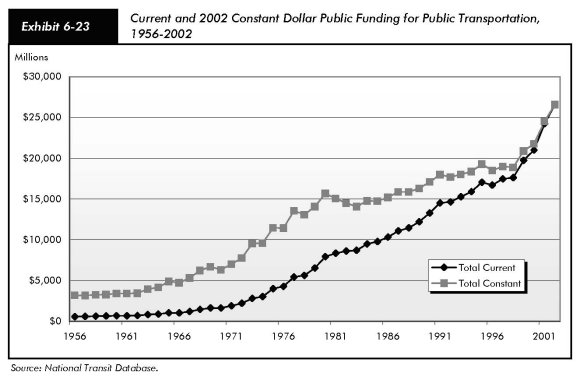
Total public funding for transit in current dollars reached its highest level of $26.6 million in 2002, a 27 percent increase over 2000. Federal funding in current dollars increased by 20 percent from $5.3 billion in 2000 to $6.3 billion in 2002; and State and local funding in current dollars increased by 28 percent from $15.7 billion in 2000 to $20.3 billion in 2002. Total funding for transit in constant dollars increased by 22 percent between 2000 and 2002; funding in constant dollars from Federal sources increased by 15 percent, and from State and local sources by 22 percent [Exhibits 6-22 and 6-23].
Flexible Funding
Since 1973, Federal surface transportation authorization statutes have contained flexible funding provisions that enable transfers from certain highway funds to transit programs and vice versa. In 1973, Congress began to allow local areas to exchange interstate transfer highway trust funds for transit funding from general revenues. Federal-aid highway dollars could be converted to transit grant purposes, with a higher local share. Flexible funding was implemented under the Intermodal Surface Transportation Efficiency Act of 1991 (ISTEA) and continued by TEA-21. Transfers are subject to State, regional/local discretion, and priorities are established through Statewide transportation planning processes. All States and territories within the United States participate in the flexible funding program, except Kansas, North Dakota, South Dakota, and Wyoming. The amount of flexible funding transferred from highways to transit fluctuates from year to year. In 2002, $1.1 billion was "flexed" from highways to transit, down from $1.6 billion in 2000. Since the program's beginning in FY 1991, through FY 2002, a total of $8.8 billion has been transferred from highways to transit.
| Year | Federal | State and Local |
Total | Federal | State and Local |
Total | Federal Share Current Dollars |
|---|---|---|---|---|---|---|---|
| Millions of Current Dollars | Millions of Constant 2000 Dollars1 | ||||||
| 1960 | $0 | $683 | $683 | $0 | $3,422 | $3,422 | 0.0% |
| 1970 | 124 | 1,499 | 1,623 | 482 | 5,830 | 6,312 | 7.6% |
| 1980 | 3,307 | 4,617 | 7,924 | 6,544 | 9,137 | 15,681 | 41.7% |
| 1990 | 3,458 | 9,823 | 13,281 | 4,453 | 12,648 | 17,101 | 26.0% |
| 1991 | 3,395 | 11,116 | 14,511 | 4,208 | 13,777 | 17,985 | 23.4% |
| 1992 | 3,448 | 11,195 | 14,643 | 4,164 | 13,521 | 17,685 | 23.5% |
| 1993 | 3,297 | 11,991 | 15,287 | 3,889 | 14,144 | 18,033 | 21.6% |
| 1994 | 3,380 | 12,522 | 15,902 | 3,902 | 14,459 | 18,361 | 21.3% |
| 1995 | 4,082 | 12,971 | 17,053 | 4,613 | 14,659 | 19,272 | 23.9% |
| 1996 | 4,060 | 12,643 | 16,703 | 4,498 | 14,008 | 18,506 | 24.3% |
| 1997 | 4,742 | 12,728 | 17,470 | 5,154 | 13,833 | 18,986 | 27.1% |
| 1998 | 4,421 | 13,200 | 17,620 | 4,738 | 14,146 | 18,883 | 25.1% |
| 1999 | 4,586 | 15,166 | 19,752 | 4,850 | 16,039 | 20,889 | 23.2% |
| 2000 | 5,259 | 15,739 | 20,999 | 5,456 | 16,330 | 21,788 | 25.0% |
| 2001 | 6,586 | 17,631 | 24,216 | 6,670 | 17,856 | 24,526 | 27.2% |
| 2002 | 6,296 | 20,294 | 26,590 | 6,296 | 20,294 | 26,590 | 23.7% |
Flexible funds may be transferred from FHWA to FTA under the following programs:
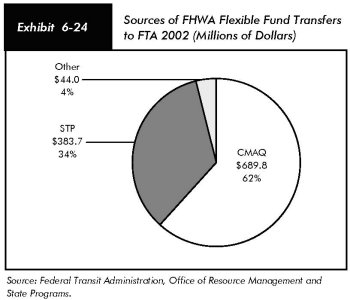
- Surface Transportation Program (STP). Flexible funds allocated from STP, the largest flexible fund program, may be used for all transit projects eligible for funding under current FTA programs with the exclusion of operating assistance for Section 5307 and 5311 programs (Title 49, United States Code [USC]). STP funds flexed from highways to transit were 46 percent lower in 2002 than in 2000, falling from $708.4.0 million to $383.7 million (Exhibit 6-24).
- Congestion Mitigation and Air Quality Improvement Program (CMAQ): Flexible funds from CMAQ funds may be used to support transit projects to reduce vehicle emissions in areas that are not meeting air quality standards. The amount of CMAQ funds flexed to transit declined from $864.0 million in 2000 to $689.8 million in 2002, a drop of 20 percent.
- FHWA Other: Flexible funds may be allocated to FTA projects earmarked under ISTEA and TEA-21 as innovative demonstration, congestion relief, and intermodal projects. Funds flexed for these purposes increased by 65 percent, from $26.7 million in 2000 to $44.0 million in 2002. These funds account for a very small proportion of the total flexed, 4 percent in 2002.
These funds are transferred to the following FTA programs:
- Urbanized Area Formula Program (Section 5307). Funds are allocated to urban areas for planning costs and for capital investment in transit. Urbanized areas with populations of less than 200,000 may also use these funds for operating assistance.
- Nonurbanized Area Formula Program (Section 5311). Funds are allocated to support services to residents outside urban areas based on the size of States' nonurban populations. Program funds may be used for capital, operating, and administrative assistance.
- Elderly and Persons with Disabilities Program (Section 5310). Funds are allocated for the provision of specialized transit services for the elderly and disabled.
| Q. | What programs are included in the FTA Formula Grants Program? |
| A. | The FTA Formula Grants Program is composed of the Urbanized Area Formula Program (Section 5307), the Nonurbanized Area Formula Program (Section (5311), and the Elderly and Persons with Disabilities Formula Program (Section 5310). It is the largest assistance program administered by FTA and totaled $3.6 billion in FY 2002. Allocations are made according to population. The Urbanized Area Formula Program receives 91.23 percent of the funding available under the FTA Formula Grants Program; the Nonurbanized Area Formula Program, 6.37 percent; and the Elderly and Persons with Disabilities Program, 2.40 percent. More than 90 percent of the funds allocated under the Urbanized Area Formula Program go to urbanized areas with populations of 200,000 or more. Nonurbanized areas are defined as rural areas and urban areas with populations under 50,000. Urbanized area (Section 5307) funding can be used for capital improvements, including preventive maintenance and planning activities as long as non-Federal funding covers 20 percent or more of these expenses. Up to 10 percent of each agency's Section 5307 funding can be used to pay for Americans with Disabilities Act of 1990 (ADA) paratransit costs, provided again with the stipulation that a non-Federal match of at least 20 percent is made. Section 5307 funding is allocated on the basis of population, population density, and performance factors, including passenger miles traveled. |
No flexible funds may be transferred directly to the Section 5309 Program; however, flexible funds that have been transferred to the 5307 Program may be used with Section 5309 funds to finance capital investment projects.
The flexible program also allows funds from the FTA Urbanized Area Formula Program to be transferred to FHWA. In 2002, a total of $1.7 million was transferred. During the 11 years of the flexible fund program from FY 1992 to FY 2002, $39.6 million has been transferred to FHWA. This amount is less than one-half of one percent of total flexible funding.
Capital Funding and Expenditures
Funding for capital investments by transit operators in the United States comes principally from public sources. Capital investments include the design and construction of new transit systems and extensions of existing systems ("New Starts"), and the modernization of existing fixed assets. Fixed assets include fixed guideway systems (e.g., rail tracks), terminals, and stations, as well as maintenance and administrative facilities. Capital investment expenditures also include the acquisition, renovation, and repair of rolling stock (i.e., buses, railcars, and locomotives and service vehicles).
Capital investment funds for transit are also generated through the issuance of bonds. Certificates of participation (COPs) are tax-exempt bonds issued by State entities that are generally secured by revenues that are expected to be earned from the equipment that the COP funds are used to purchase. The U.S. Department of Transportation (DOT) has also developed three innovative financing programs to facilitate funding for transportation projects, including transit projects. These programs, the Transportation Infrastructure and Finance Innovation Act of 1998 (TIFIA), State Infrastructure Bank (SIB) Pilot Program, and Grant Anticipation Revenue Vehicle (GARVEE) bonds, which are discussed at the end of this chapter, contribute to the financing of transit capital investment. Three TIFIA loans have been awarded to finance transit projects in San Juan, New York, and Washington, D.C. Letters of interest in TIFIA loans have also been received for transit projects in Illinois, California, Nevada, and the State of Washington. Under the SIB program, seven SIBs have awarded $45 million to assist 12 transit projects valued in excess of $135 million. The loans have supported a diverse spectrum of projects, including bus purchases, rail modernization, intermodal facilities, a historic landmark rehabilitation, and rural transportation improvements. Many of the loans have assisted communities with local project match requirements, which has enabled local governments to accelerate the implementation of transit infrastructure and services that might otherwise have been postponed because of a lack of available match funding. GARVEE-type bonds, called Transit Grant Anticipation Notes (GANs), have been issued by transit agencies in New Jersey, California, Pennsylvania, and Arizona to fund transit projects ranging from the purchase of new technology buses to the construction of new and rehabilitation of light rail and rapid rail lines. In each case, the bond issue was used to borrow against future Federal-aid funding to accelerate the project and thus reduce its cost.
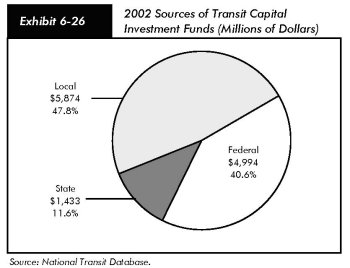
In 2002, total public transit agency expenditures for capital investment were $12.3 billion in current dollars and accounted for 34.9 percent of total transit expenditures. Federals funds accounted for $5.0 billion of total transit agency capital expenditures, State funds for $1.4 billion, and local funds $5.9 billion. The share of capital funding from State and local governments increased between 2000 and 2002 and the share from the Federal government fell. Federal funds accounted for 40.6 percent of all funding for capital investment in 2002, compared with 47.2 percent in 2000, and 41.6 percent in 1993. State sources accounted for 11.6 percent of all capital funding in 2002, compared with 10.7 percent in 2000, and 23.0 percent in 1993. Local funding for capital investment accounted for 47.8 percent of all funding for capital investment in 2002, compared with 42.0 percent in 2000, and 35.5 percent in 1993. The decrease in the share of Federal funds for capital investment and increase in shares of State and local funds reflect the fact that both State and local funding for transit increased by more than 20 percent between 2000 and 2002, compared with an 8.1 percent increase in Federal funding over the same period [Exhibits 6-25 and 6-26].
| 1993 | 1995 | 1997 | 1999 | 2000 | 2002 | Average Annual Growth | ||
|---|---|---|---|---|---|---|---|---|
| 2002/1993 | 2002/2000 | |||||||
| Federal | $2,383 | $3,314 | $4,138 | $3,726 | $4,275 | $4,994 | 8.6% | 8.1% |
| Share | 41.6% | 47.3% | 54.2% | 44.1% | 47.2% | 40.6% | ||
| State | $1,317 | $989 | $1,007 | $858 | $973 | $1,433 | 0.9% | 21.3% |
| Share | 23.0% | 14.1% | 13.2% | 10.2% | 10.7% | 11.6% | ||
| Local | $2,033 | $2,706 | $2,492 | $3,860 | $3,808 | $5,874 | 12.5% | 24.2% |
| Share | 35.5% | 38.6% | 32.6% | 45.7% | 42.0% | 47.8% | ||
| Total | $5,733 | $7,008 | $7,636 | $8,443 | $9,056 | $12,301 | 8.9% | 16.5% |
As shown in Exhibit 6-27, rail modes take a higher percentage of total capital investment than bus modes because of the higher cost of building fixed guideways and rail stations. In 2002, $8.7 billion, or 71 percent of total transit capital expenditures, was invested in rail modes of transportation, compared with $3.6 billion, or 29 percent of the total, in nonrail modes.
| Guideway | Systems | Stations | Facilities | Rolling Stock | Other Vehicles | Other | Total | Percent of Total | |
|---|---|---|---|---|---|---|---|---|---|
| Rail | 2,973 | 132 | 1,178 | 1,497 | 2,243 | 39 | 613 | 8,676 | 71% |
| Commuter Rail | 625 | 64 | 290 | 650 | 590 | 7 | 144 | 2,371 | 19% |
| Heavy Rail | 1203 | 30 | 796 | 679 | 1424 | 28 | 406 | 4,564 | 37% |
| Light Rail | 1136 | 37 | 90 | 167 | 227 | 4 | 63 | 1,723 | 14% |
| Other Rail1 | 9 | 0 | 2 | 1 | 3 | 0 | 1 | 17 | 0% |
| Nonrail | 283 | 184 | 264 | 697 | 1823 | 36 | 338 | 3,625 | 29% |
| Bus | 208 | 170 | 213 | 535 | 1543 | 33 | 325 | 3,028 | 25% |
| Demand Response | 0 | 11 | 3 | 19 | 128 | 2 | 10 | 173 | 1% |
| Ferryboat | 0 | 2 | 44 | 126 | 49 | 0 | 1 | 222 | 2% |
| Trolleybus | 75 | 1 | 2 | 16 | 93 | 0 | 1 | 188 | 2% |
| Other Nonrail2 | 0 | 1 | 2 | 0 | 10 | 0 | 1 | 14 | 0% |
| Total | 3,257 | 316 | 1,442 | 2,194 | 4,066 | 75 | 952 | 12,301 | 100% |
| Percent of Total | 26% | 3% | 12% | 18% | 33% | 1% | 8% | 100% |
Exhibit 6-28 shows the capital investment expenditures by asset type in 2002. Investment in rolling stock in 2002 was $4.1 billion. Rolling stock includes the bodies and chassis of transit vehicles and their attached fixtures and appliances, but does not include fare collection equipment and revenue vehicle movement control equipment such as radios. Guideway investment in 2002 was $3.3 billion. Guideway is composed of at-grade rail, elevated and subway structures, tunnels, bridges, track and power systems for all rail modes, and for paved highway lanes dedicated to buses. Investment in facilities in 2002 was $2.2 billion. Facilities include the purchase, construction, and rehabilitation of maintenance facilities, including design and engineering, demolition, and land acquisition. It also includes investment in transit malls, transfer facilities, intermodal terminals, shelters, passenger stations, depots, terminals, high occupancy vehicle facilities, transit ways, and park-and-ride facilities. Additional investments in a range of equipment—crime prevention and security equipment, service and support equipment, operational support equipment (e.g., computer hardware and software), line equipment and structures, signals and communication equipment, and power equipment and substations—are also included. Investment in stations in 2002 was $1.4 billion. Stations include platforms, shelters, and parking and crime prevention and security equipment at stations. Investment in systems in 2002 was $316 million. A system is a group of devices or objects forming a network, especially for distributing something or serving a common purpose (e.g. telephone systems).
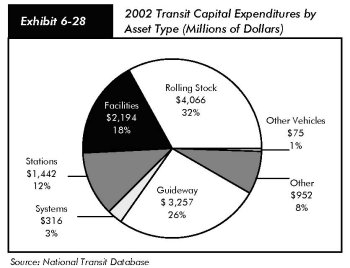
In 2002, $952 million billion was for other capital. Other capital includes service vehicles, the construction of general administration facilities, furniture, equipment that is not an integral part of buildings and structures, data processing equipment (including computers and peripheral devices whose sole use is in data processing operations), fare collection equipment, and revenue vehicle movement control equipment. Other capital also includes shelters located at on-street bus stops.
Operating Expenditures
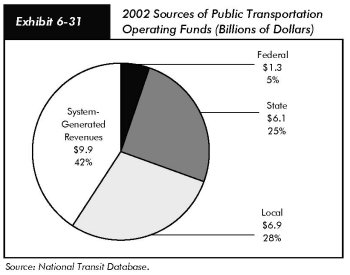
Transit operating expenditures include wages, salaries, fuel, spare parts, preventive maintenance, support services, and leases used in providing transit service. In 2002, $24.2 billion was available for operating expenses and accounted for 65.1 percent of total available funds. Of this amount, $1.3 billion was provided by the Federal government, $6.1 billion was provided by State governments, $6.9 billion by local governments, and $9.9 billion by system-generated revenues [Exhibits 6-31 and 6-32]. Since 1993, the percentage of funds attributable to each source has fluctuated within a small range. From 2000 to 2002, the percentage of funds available from State sources increased, while the percentage of funds available from local sources decreased.
| 1993 | 1995 | 1997 | 1999 | 2000 | 2001 | 2002 | Average Annual Growth | ||
|---|---|---|---|---|---|---|---|---|---|
| 2002/1993 | 2002/2000 | ||||||||
| Federal | $911 | $768 | $604 | $860 | $984 | $1,117 | $1,302 | 4.0% | 15.0% |
| Share | 5.7% | 4.6% | 3.3% | 3.9% | 4.5% | 4.8% | 5.4% | ||
| State | $2,936 | $3,599 | $3,661 | $3,819 | $4,351 | $5,127 | $6,113 | 8.5% | 18.5% |
| Share | 18.4% | 21.8% | 20.0% | 17.4% | 20.1% | 21.8% | 25.3% | ||
| Local | $4,927 | $5,146 | $5,568 | $6,097 | $6,513 | $7,147 | $6,874 | 3.8% | 2.7% |
| Share | 30.8% | 31.1% | 30.4% | 27.8% | 30.0% | 30.4% | 28.4% | ||
| System-generated Revenues | $7,206 | $7,015 | $8,477 | $11,128 | $9,832 | $10,112 | $9,890 | 3.6% | 0.3% |
| 45% | 42% | 46% | 51% | 45% | 43% | 41% | |||
| Total | $15,981 | $16,527 | $18,310 | $21,905 | $21,680 | $23,503 | $24,179 | 4.7% | 5.6% |
TEA-21 mandated that Federal funding to transit systems in urbanized areas with populations over 200,000 be used only for operating expenses for preventive maintenance. Formula grant funding to transit systems in urbanized areas with populations of less than 200,000 was still allowed to fund operating expenses.
As a result of the 2000 census, 56 areas were reclassified as urbanized areas with populations of more than 200,000. Transit agencies operating in these areas were slated to lose their eligibility to use Federal formula funding to finance transit operations starting in FY 2002. To help these agencies adjust their financing arrangements, the Transit Operating Flexibility Act (Pub.L. 107-232) was passed in September 2002, which amended Section 5307 of 49 USC to allow transit systems that were in urbanized areas that grew to more than 200,000 in the 2000 Census to continue using their formula funds for operating as well as capital expenses for one more year, despite their change in status.
Operating Expenditures by Transit Mode
In 2002, transit operators' actual operating expenditures were $22.9 billion [Exhibit 6-33]. These expenditures increased at an average annual rate of 7.0 percent between 2000 and 2002, more rapidly than during any other 2-year period since 1993. Operating expenditures for light rail and demand response systems increased more rapidly than operating expenditures for other modes, each at an average annual rate of about 15.0 percent. (As shown in Exhibit 6-37 and Exhibit 6-39, between 2000 and 2002 operating expenditures per revenue vehicle mile and operating expenditures per passenger mile for light rail and demand response systems increased more rapidly than for bus, heavy rail, or commuter rail.) Operating expenditures for heavy rail increased at an average annual rate of 4.2 percent between 2000 and 2002; operating expenditures for commuter rail increased at an average annual rate of 5.7 percent; operating expenditures for buses increased as an average annual rate of 7 percent; and operating expenditures for the remaining modes combined as "Other" increased at an average annual rate of 8.2 percent.
| Year | Bus | Heavy Rail |
Commuter Rail |
Light Rail |
Demand Response |
Other | Total |
|---|---|---|---|---|---|---|---|
| 1993 | $8,866 | $3,669 | $2,203 | $314 | $561 | $358 | $15,971 |
| 1994 | 9,168 | 3,786 | 2,353 | 412 | 712 | 401 | 16,832 |
| 1995 | 9,247 | 3,523 | 2,211 | 375 | 757 | 415 | 16,528 |
| 1996 | 9,324 | 3,402 | 2,294 | 440 | 849 | 440 | 16,748 |
| 1997 | 9,777 | 3,474 | 2,278 | 471 | 1,009 | 454 | 17,462 |
| 1998 | 10,120 | 3,530 | 2,360 | 493 | 1,134 | 498 | 18,135 |
| 1999 | 10,841 | 3,693 | 2,574 | 536 | 1,275 | 540 | 19,460 |
| 2000 | 11,026 | 3,931 | 2,679 | 592 | 1,225 | 549 | 20,003 |
| 2001 | 11,814 | 4,180 | 2,854 | 676 | 1,410 | 595 | 21,529 |
| 2002 | 12,586 | 4,267 | 2,995 | 778 | 1,636 | 643 | 22,905 |
| Percent of Total | |||||||
| 1993 | 55.5% | 23.0% | 13.8% | 2.0% | 3.5% | 2.2% | 100.0% |
| 2002 | 54.9% | 18.6% | 13.1% | 3.4% | 7.1% | 2.8% | 100.0% |
| Average Annual Growth Rate | |||||||
| 2002/2000 | 7% | 4.2% | 5.7% | 14.6% | 15.5% | 8.2% | 7.0% |
| 2002/1993 | 4.0% | 1.7% | 3.5% | 10.6% | 12.6% | 6.7% | 4.1% |
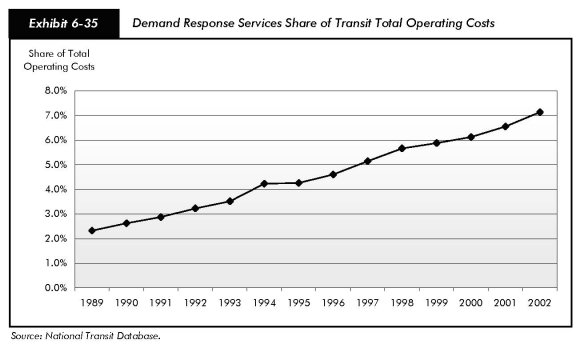
Operating expenditures for demand response vehicles have more than tripled over the past decade, from $561 million in 1993 to $1.6 billion in 2002, reflecting increased services to the elderly and persons with disabilities pursuant to the ADA and new programs targeted toward the provision of services to these groups. Although these expenditures appeared to be stabilizing, with a marginal decline from 1999 to 2000, between 2000 and 2002 they increased by 33 percent.
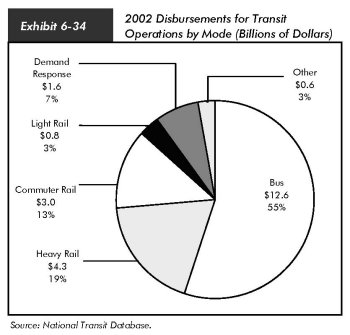
Buses accounted for the largest percentage of transit operating expenditures, $12.6 billion in 2002, or 55 percent of the operating expenditure total. Heavy rail accounted for $4.3 billion, or 19 percent of the total; and commuter rail accounted for $3.0 billion, or 13 percent of the total. In 2002, demand response systems accounted for 7.1 percent of total transit operating expenses, compared with 3.5 percent in 1993. Light rail and other transit vehicles accounted for 3 percent each [Exhibit 6-34].
Operating Expenses by Type of Cost
In 2002, $11.8 billion, or 51.5 percent of total transit operating expenses, were for vehicle operations [Exhibit 6-36]. Expenditures on vehicle maintenance were $4.7 billion or 20.3 percent of the total; expenditures on nonvehicle maintenance were $2.4 billion or 10.6 percent of the total; and expenditures on general administration were $4.0 billion or 17.6 percent of the total. Expenditures increased for vehicle operations at an average annual rate of 7 percent between 2000 and 2002, for vehicle maintenance at an average annual rate of 6 percent, for nonvehicle maintenance at an average annual rate of 7 percent, and for general administration at an average annual rate of 9 percent.
| Mode | Vehicle Operations | Vehicle Maintenance | Nonvehicle Maintenance | General Administration | Total | |||||
|---|---|---|---|---|---|---|---|---|---|---|
| Bus | $7,095 | 56.4% | $2,687 | 56.4% | $562 | 4.5% | $2,241 | 17.8% | $12,586 | 100.0% |
| Heavy Rail | 1,754 | 41.1% | 762 | 17.8% | 1,095 | 25.7% | 657 | 15.4% | 4,267 | 100.0% |
| Commuter Rail | 1,145 | 38.2% | 721 | 24.1% | 555 | 18.5% | 573 | 19.1% | 2,995 | 100.0% |
| Light Rail | 330 | 42.4% | 178 | 22.9% | 130 | 16.7% | 140 | 18.0% | 778 | 100.0% |
| Demand Response | 1,094 | 66.9% | 199 | 12.2% | 35 | 2.1% | 308 | 18.8% | 1,636 | 100.0% |
| Other | 370 | 57.5% | 106 | 16.5% | 57 | 8.9% | 110 | 17.1% | 643 | 100.0% |
| Total | $11,788 | 51.5% | $4,654 | 20.3% | $2,435 | 10.6% | $4,029 | 17.6% | $22,905 | 100.0% |
Bus and rail operations have inherently different cost structures. While 67 percent of total operations expenditures for demand response transit and 56 percent of total operations expenditures for buses were spent for actual operation of the vehicles, only about 40 percent of rail operations expenditures were spent on the operation of rail vehicles. A significantly higher percentage of expenditures for rail modes of transportation are classified as nonvehicle maintenance for the repair and maintenance of fixed guideway systems.
Financial Efficiency
Operating expense per vehicle revenue mile (VRM) is one measure of financial or cost efficiency. It calculates the expense of operating a transit vehicle in revenue service. In 2002, operating expense per VRM for all transit modes combined was $6.68 [Exhibit 6-37]. Operating costs per VRM for all modes combined increased marginally between 1993 and 2002 (at an average annual rate of 0.9 percent), but more rapidly between 2000 and 2002 (at an average annual rate of 3.4 percent). Demand response systems have experienced the most rapid increases in operating costs per VRM, at an average annual rate of 3.4 percent between 1993 and 2002 and at an average annual rate of 7.2 percent between 2000 and 2002.
| Year | Bus | Heavy Rail |
Commuter Rail |
Light Rail |
Demand Response |
Other 1 | Total |
|---|---|---|---|---|---|---|---|
| 1993 | $5.62 | $7.26 | $10.83 | $11.65 | $2.31 | $9.97 | $6.16 |
| 1994 | 5.78 | 7.34 | 11.23 | 12.38 | 2.61 | 6.46 | 6.17 |
| 1995 | 5.81 | 6.52 | 10.15 | 11.07 | 2.55 | 5.86 | 6.05 |
| 1996 | 5.91 | 6.44 | 10.36 | 12.01 | 2.76 | 5.53 | 6.09 |
| 1997 | 6.09 | 6.44 | 9.92 | 11.84 | 2.88 | 5.13 | 6.12 |
| 1998 | 6.12 | 6.43 | 9.91 | 11.65 | 2.92 | 5.00 | 6.11 |
| 1999 | 6.31 | 6.58 | 10.58 | 11.37 | 3.05 | 4.42 | 6.25 |
| 2000 | 6.25 | 6.80 | 10.81 | 11.51 | 2.71 | 5.05 | 6.25 |
| 2001 | 6.49 | 7.07 | 11.28 | 12.72 | 2.88 | 5.41 | 6.49 |
| 2002 | 6.75 | 7.07 | 11.56 | 12.98 | 3.11 | 5.59 | 6.68 |
| Average (1993–2002) | $6.11 | $6.79 | $10.66 | $11.92 | $2.78 | $5.84 | $6.24 |
| Average Annual Rate of Change | |||||||
| 2002/2000 | 3.9% | 2.0% | 3.4% | 6.2% | 7.2% | 5.2% | 3.4% |
| 2002/1993 | 2.1% | -0.3% | 0.7% | 1.2% | 3.4% | -6.2% | 0.9% |
Operating expense per capacity-equivalent VRM is a better measure of comparing cost efficiency among modes because it adjusts for passenger-carrying capacities [Exhibit 6-38]. Rail systems are more cost efficient in providing service than nonrail systems, once investment in rail infrastructure has been completed. Based on operating costs alone, heavy rail is the most efficient at providing transit service and demand response systems are the least efficient. [Note that annual changes in operating expense per capacity-equivalent VRM and unadjusted VRM are the same for modes that reported separately.]
| Year | Bus | Heavy Rail |
Commuter Rail |
Light Rail |
Demand Response |
Other 1 | Total |
|---|---|---|---|---|---|---|---|
| 1993 | $5.62 | $3.08 | $4.65 | $4.62 | $12.83 | $7.25 | $4.69 |
| 1994 | 5.78 | 3.11 | 4.82 | 4.91 | 14.50 | 6.98 | 4.75 |
| 1995 | 5.81 | 2.76 | 4.36 | 4.39 | 14.15 | 7.22 | 4.69 |
| 1996 | 5.91 | 2.73 | 4.45 | 4.77 | 15.31 | 7.20 | 4.72 |
| 1997 | 6.09 | 2.73 | 4.26 | 4.70 | 16.01 | 7.28 | 4.80 |
| 1998 | 6.12 | 2.72 | 4.25 | 4.62 | 16.22 | 7.44 | 4.84 |
| 1999 | 6.31 | 2.79 | 4.54 | 4.51 | 16.93 | 7.16 | 5.02 |
| 2000 | 6.25 | 2.88 | 4.64 | 4.57 | 15.05 | 7.58 | 5.01 |
| 2001 | 6.49 | 3.00 | 4.84 | 5.05 | 15.97 | 8.47 | 5.25 |
| 2002 | 6.75 | 3.00 | 4.96 | 5.15 | 17.30 | 8.53 | 5.44 |
| Average (1993–2002) | $6.11 | $2.88 | $4.58 | $4.73 | $15.43 | $7.51 | $4.92 |
| Average Annual Rate of Change | |||||||
| 2002/2000 | 3.9% | 2.0% | 3.4% | 6.2% | 7.2% | 6.1% | 4.1% |
| 2002/1993 | 2.1% | -0.3% | 0.7% | 1.2% | 3.4% | 1.8% | 1.7% |
Cost Effectiveness
Operating expenses per passenger mile is an indicator of the cost effectiveness of providing a transit service [Exhibit 6-39]. It shows the relationship between service inputs as expressed by operating expenses and service consumption as expressed by passenger miles traveled. Operating expenses per passenger mile for all transit modes combined increased at an average annual rate of 2.0 percent between 1993 and 2000 (from $0.42 to $0.50), at a rate close to the 1.9 percent average annual increase in the gross domestic product (GDP) deflator. This indicates that, on average, the cost effectiveness of transit services in relationship to the rest of the economy has remained relatively constant. Operating expenses per passenger mile for heavy rail declined at an average annual rate of 1.5 percent between 1993 and 2002 (from $0.36 to $0.31). Operating expenses per passenger mile for commuter rail were the same in 1993 and 2002, although they had been lower in the intervening years. The increase in operating expenses per passenger mile for buses, light rail, and demand response services was higher on an average annual basis between 1993 and 2002 than the GDP deflator. In the case of buses, operating expenses per passenger mile increased at an average annual rate of 2.6 percent (from $0.51 in 1993 to $0.64 in 2002), and in the case of light rail at 2.2 percent (from $0.45 to $0.54). Operating expenses per passenger mile is highest for demand response services. It increased at an average annual rate of 6.4 percent between 1993 and 2000.
| Year | Bus | Heavy Rail |
Commuter Rail |
Light Rail |
Demand Response |
Other 1 | Total |
|---|---|---|---|---|---|---|---|
| 1993 | $0.51 | $0.36 | $0.32 | $0.45 | $1.44 | $0.57 | $0.42 |
| 1994 | 0.53 | 0.35 | 0.29 | 0.50 | 1.89 | 0.49 | 0.41 |
| 1995 | 0.54 | 0.32 | 0.27 | 0.44 | 1.91 | 0.47 | 0.41 |
| 1996 | 0.55 | 0.30 | 0.27 | 0.46 | 2.17 | 0.46 | 0.43 |
| 1997 | 0.56 | 0.29 | 0.28 | 0.46 | 1.90 | 0.44 | 0.43 |
| 1998 | 0.57 | 0.29 | 0.27 | 0.44 | 2.21 | 0.45 | 0.44 |
| 1999 | 0.58 | 0.29 | 0.29 | 0.45 | 2.28 | 0.46 | 0.45 |
| 2000 | 0.59 | 0.28 | 0.29 | 0.44 | 2.09 | 0.49 | 0.44 |
| 2001 | 0.60 | 0.29 | 0.30 | 0.47 | 2.25 | 0.52 | 0.46 |
| 2002 | 0.64 | 0.31 | 0.32 | 0.54 | 2.51 | 0.55 | 0.50 |
| Average (1993–2002) | $0.57 | $0.31 | $0.29 | $0.47 | $2.07 | $0.49 | $0.44 |
| Average Annual Rate of Change | |||||||
| 2002/2000 | 4.9% | 4.9% | 5.2% | 10.9% | 9.8% | 6.0% | 6.0% |
| 2002/1993 | 2.6% | -1.5% | -0.1% | 2.2% | 6.4% | -0.4% | 2.0% |
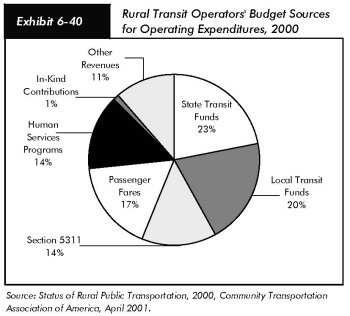
Rural Transit
Since 1978, the Federal Government has contributed to the financing of transit in rural areas, i.e., areas with populations of less than 50,000. These rural areas are estimated to account for 36 percent of the U.S. population and 38 percent of the transit-dependent population.
Funding for rural transit is currently provided through 49 USC Section 5311, which, in 1994, replaced Section 18 of the Urban Mass Transit Act. Rural transit funding was increased substantially with passage of TEA-21. Federal funding for rural transit was $224 million in FY 2002 and $240 million in FY 2003, the end of the TEA-21 authorization period. States may transfer additional funds to rural transit from highway projects, transit projects, or formula transit funds for small, urbanized areas.
On average, 14 percent of rural transit authorities' operating budgets come from Section 5311 funds [Exhibit 6-40]. State and local governments cover, respectively, 23 and 20 percent of their rural transit operating budgets through a combination of dedicated State and local taxes, appropriations from State general revenues, and allocations from other city and county funds. In 2000, the last year for which information is available, total State and local contributions to rural transit operating budgets increased to a total of $431 million, up from $145 million in 1994. Human Services programs, including Medicaid, cover about 14 percent of rural operating budgets, and in kind contributions and other revenues cover the remainder.