

- Summary
- Highways and Bridges
- Transit
- Highway and Bridge Investment Requirements
- Maximum Economic Investment for Highways and Bridges
- Cost to Maintain Highways and Bridges
- Investment Requirements by Improvement Type
- Sources of the Highway and Bridge Investment Requirements Estimates
- Highway Economic Requirements System
- National Bridge Investment Analysis System
- Transit Investment Requirements
- Average Annual Costs to Maintain and Improve Conditions and Performance
- Existing Needs in the Transit Infrastructure
- Summary of Revisions Since the Last Edition (2002) of this Report
Highway and Bridge Investment Requirements
This section presents the projected investment requirements for highways and bridges for two primary performance targets. The "Maximum Economic Investment" scenario (Cost to Improve Highways and Bridges) identifies the level of investment that would be required to significantly improve system performance in an economically justifiable manner. The "Cost to Maintain Highways and Bridges" represents the annual investment necessary to maintain the current level of highway system performance. The impacts of a wider range of alternative investment levels on various measures of system performance are shown in Chapter 9. Chapter 9 also explores recent trends in highway expenditures compared with recent changes in system performance.
The combined highway and bridge investment requirements are drawn from the separately estimated scenarios for highways and for bridges, and from external adjustments to the two models. These scenarios are defined differently, owing to the different natures of the models used to develop them. However, it is useful to combine them. This aggregation is particularly helpful when trying to compare these scenarios to current or projected investment levels, since amounts commonly referred to as "total highway spending" or "total highway capital outlay" include expenditures for both highways and bridges. Chapter 8 compares current highway and bridge spending with the investment requirements outlined in this section.
The average annual "Maximum Economic Investment for Highways and Bridges" over the 20-year period 2003 to 2022 is projected to be $118.9 billion in 2002 dollars. The average annual "Cost to Maintain Highways and Bridges" is projected to be $73.8 billion (also in 2002 dollars).
Note that these projections implicitly assume the continuation of current tax and fee structures. As pointed out in the "Congestion Pricing and Investment Requirements" section in the Introduction to Part II of this report, any shifts in financing mechanisms that significantly alter the costs incurred by individual users would have an effect on these results. The 2006 edition of the C&P report will begin to address this phenomena in a more quantitative manner. Note also that the accuracy of these projections depends on the validity of the technical assumptions underlying the analysis; Chapter 10 explores the impacts of altering some of these assumptions.
Maximum Economic Investment for Highways and Bridges
The average annual "Maximum Economic Investment for Highways and Bridges" is broken down by functional class and type of improvement in Exhibit 7-2. The estimated investment requirements for urban arterials and collectors total $69.2 billion, or 58.2 percent of the total average annual "Maximum Economic Investment for Highways and Bridges." Investment requirements on rural arterials and collectors are $32.4 billion (or 27.3 percent of the total), while the investment requirements for rural and urban local roads and streets total $17.2 billion (14.5 percent).
| Functional Class | System Preservation | System Expansion | System Enhancements | Total | ||
|---|---|---|---|---|---|---|
| Highway | Bridge | Total | ||||
| Rural Arterials & Collectors | ||||||
| Interstate | $2.6 | $0.7 | $3.3 | $2.5 | $0.7 | $6.4 |
| Other Principal Arterial | $4.3 | $1.0 | $5.3 | $1.7 | $1.1 | $8.1 |
| Minor Arterial | $4.2 | $1.0 | $5.2 | $1.0 | $0.6 | $6.8 |
| Major Collector | $6.1 | $1.5 | $7.6 | $0.6 | $0.5 | $8.7 |
| Minor Collector | $1.2 | $0.6 | $1.8 | $0.4 | $0.2 | $2.4 |
| Subtotal | $18.4 | $4.8 | $23.2 | $6.1 | $3.1 | $32.4 |
| Urban Arterials & Collectors | ||||||
| Interstate | $4.9 | $2.1 | $7.0 | $15.9 | $1.9 | $24.9 |
| Other Freeway & Expressway | $2.1 | $0.7 | $2.8 | $8.3 | $0.7 | $11.8 |
| Other Principal Arterial | $5.6 | $1.3 | $6.8 | $7.7 | $1.6 | $16.2 |
| Minor Arterial | $3.8 | $0.9 | $4.6 | $5.4 | $0.7 | $10.7 |
| Collector | $2.1 | $0.4 | $2.5 | $2.5 | $0.6 | $5.7 |
| Subtotal | $18.4 | $5.3 | $23.7 | $39.8 | $5.6 | $69.2 |
| Rural & Urban Local | $6.4 | $2.3 | $8.8 | $6.9 | $1.5 | $17.2 |
| Total | $43.2 | $12.5 | $55.7 | $52.9 | $10.2 | $118.9 |
This scenario combines the "Maximum Economic Investment" scenarios from the Highway Economic Requirements System (HERS) and the National Bridge Investment Analysis System (NBIAS) with external adjustments to the two models.
Cost to Maintain Highways and Bridges
Exhibit 7-3 shows the average annual "Cost to Maintain Highways and Bridges" by type of improvement and functional class. The estimated investment requirements for urban arterials and collectors under this scenario total $41.4 billion, or 56.1 percent of the average annual "Cost to Maintain Highways and Bridges." Investment requirements for rural arterials and collectors total $21.6 billion (29.3 percent), while the investment requirements for rural and urban local roads and streets total $10.8 billion (14.5 percent).
The "Cost to Maintain Highways and Bridges" scenario combines the "Maintain User Costs" scenario from HERS and the "Maintain Economic Backlog" scenario from NBIAS with external adjustments to the two models.
Investment Requirements by Improvement Type
Exhibits 7-2 and 7-3 also show investment requirements by type of improvement. The investment requirements are classified into three categories (defined in Chapter 6): system preservation, system expansion, and system enhancement. System preservation, as defined in this report, consists of the capital investment required to preserve the condition of the pavement and bridge infrastructure. This includes the costs of resurfacing, rehabilitation, and reconstruction, but does not include routine maintenance costs. System expansion includes the costs related to increasing system capacity by widening existing facilities or adding new roads and bridges. System enhancements include targeted safety enhancements, traffic control improvements, and environmental improvements. Appendix A describes how the investment requirements modeled by HERS and NBIAS were allocated among the three types of improvements.

| Functional Class | System Preservation | System Expansion | System Enhancements | Total | ||
|---|---|---|---|---|---|---|
| Highway | Bridge | Total | ||||
| Rural Arterials & Collectors | ||||||
| Interstate | $2.2 | $0.5 | $2.7 | $1.8 | $0.4 | $5.0 |
| Other Principal Arterial | $3.2 | $0.7 | $3.9 | $1.2 | $0.7 | $5.8 |
| Minor Arterial | $2.7 | $0.7 | $3.4 | $0.6 | $0.4 | $4.3 |
| Major Collector | $3.3 | $1.0 | $4.4 | $0.3 | $0.3 | $5.0 |
| Minor Collector | $0.7 | $0.4 | $1.2 | $0.2 | $0.1 | $1.5 |
| Subtotal | $12.2 | $3.4 | $15.5 | $4.2 | $1.9 | $21.6 |
| Urban Arterials & Collectors | ||||||
| Interstate | $3.8 | $1.6 | $5.5 | $7.1 | $1.2 | $13.8 |
| Other Freeway & Expressway | $1.9 | $0.6 | $2.4 | $3.6 | $0.4 | $6.5 |
| Other Principal Arterial | $4.7 | $0.9 | $5.6 | $4.1 | $1.0 | $10.7 |
| Minor Arterial | $3.0 | $0.6 | $3.7 | $3.0 | $0.5 | $7.1 |
| Collector | $1.4 | $0.2 | $1.7 | $1.3 | $0.4 | $3.3 |
| Subtotal | $14.9 | $4.0 | $18.9 | $19.0 | $3.5 | $41.4 |
| Rural & Urban Local | $4.0 | $1.5 | $5.5 | $4.3 | $1.0 | $10.8 |
| Total | $31.1 | $8.9 | $40.0 | $27.5 | $6.4 | $73.8 |
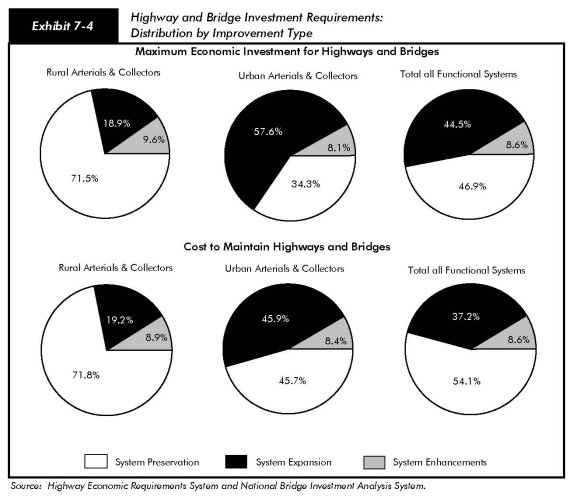
Exhibit 7-4 displays investment requirements by improvement type for rural and urban areas, for each scenario.
System Preservation
Average annual system preservation investment requirements are estimated to be $55.7 billion under the "Maximum Economic Investment" scenario and $40.0 billion under the "Cost to Maintain" scenario. These totals constitute 46.9 and 54.1 percent, respectively, of the totals for the two scenarios. Exhibits 7-2 and 7-3 also indicate that bridge preservation investments represent about 22 percent of total preservation investment requirements under each scenario. As shown in Exhibit 7-4, system preservation makes up a much larger share of total investment requirements in rural areas than in urban areas.
System Expansion
The $52.9 billion in average annual investment requirements for system expansion represent 44.5 percent of the total "Maximum Economic Investment for Highways and Bridges." Comparable figures for the "Cost to Maintain" scenario are $27.5 billion and 37.2 percent. Exhibits 7-2 through 7-4 indicate that system expansion requirements are much larger in urban areas than in rural areas, both in the total amount and as a share of overall investment requirements, under both investment scenarios.
| Q. | Can highway capacity be expanded without adding new lanes or new roads and bridges? |
| A. | Yes. In some cases, effective highway capacity can be increased by improving the utilization of the existing infrastructure. The investment requirements estimates presented in this edition of the report now consider the impact of some of the most significant such operations strategies and deployments on highway system performance. The capital investment costs associated with these strategies are included in the estimates of highway capacity investment presented in this chapter. Operations strategies are further discussed in Chapter 12. The methodology used to estimate system expansion requirements also allows high-cost capacity improvements to be considered as an option for segments with high volumes of projected future travel, but have been coded by States as infeasible for conventional widening. Conceptually, such improvements might consist of new highways or bridges in the same corridor (or tunneling or double-decking on an existing alignment), but the capacity upgrades could also come through other transportation improvements, such as a parallel fixed guideway transit line or mixed-use high occupancy vehicle/bus lanes. |
System Enhancements
Investment requirements for system enhancements represent 8.6 percent of both the "Maximum Economic Investment for Highways and Bridges" ($10.2 billion) and the "Cost to Maintain Highways and Bridges" ($6.4 billion). Investment requirements for safety enhancements, traffic control facilities, and environmental enhancements are not directly modeled, so this amount was derived solely from the external adjustment procedures described below.
Sources of the Highway and Bridge Investment Requirements Estimates
The estimates of investment requirements for highways and bridges under the "Improve" and "Maintain" scenarios were derived from three sources:
- Highway and bridge capacity expansion and highway preservation investments were modeled using HERS.
- Bridge preservation investments were modeled using NBIAS.
- The HERS and NBIAS results were supplemented by external adjustments made to account for functional classes not included in the data sources used by the models and types of capital investment that are not currently modeled.
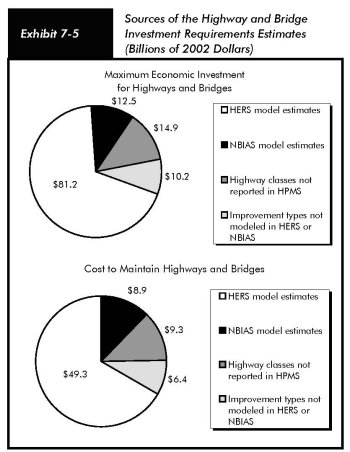
The model scenarios used in HERS and NBIAS to construct the "Improve" and "Maintain" scenarios are discussed in greater detail below. Exhibit 7-5 shows the sources of the highway and bridge investment requirements estimates.
External Adjustments
External adjustments were made to the directly modeled improvements generated by HERS and NBIAS in two areas:
- Highway functional classes. Bridges on all functional classes are represented in the National Bridge Inventory (NBI) database used by NBIAS, so all of the investment requirements for bridge preservation shown in this report are derived directly from NBIAS. However, the Highway Performance Monitoring System (HPMS) sample segment database used by HERS does not include rural minor collectors, rural local roads, or urban local roads. Consequently, HERS does not provide estimates for these systems, and separate estimates for highway preservation and system expansion were applied.
| Q. | Why does the analysis assume that the share of future highway investments for non-modeled items would remain the same? |
| A. | No data are currently available that would justify an assumption that this percentage would change. If this percentage of highway capital expenditures used for rural minor collectors, rural and urban local roads, and/or system enhancements were to rise in the future, then the investment requirements presented in this chapter would be understated. If this percentage falls over time, then the investment requirements shown would be overstated. |
- Improvement types. The improvement options that HERS and NBIAS consider primarily address pavement and capacity deficiencies on existing highway and bridge sections. Currently, HERS and NBIAS do not directly consider system enhancements. Estimates for this improvement type were applied across all functional classes.
The adjustment procedures assume that the share of total highway investment requirements represented by these functional classes and improvement types would be equivalent to their share of current highway capital spending. The amounts derived from these external adjustments are identified separately in this report because they would be expected to be less reliable than those derived from HERS and NBIAS.
The percentage of total investment requirements that are modeled in HERS and NBIAS is slightly higher than was the case in the 2002 C&P report. This is largely attributable to the fact that the share of combined highway capital expenditures by State and local governments estimated to have been devoted to local roads and rural minor collectors decreased between 2000 and 2002.
Highway Economic Requirements System
The investment requirements shown in this report for highway preservation and highway and bridge capacity expansion are developed primarily from HERS, a simulation model that employs incremental benefit cost analysis to evaluate highway improvements. The HERS analysis is based on data from the HPMS, which provides information on current roadway characteristics, conditions, and performance and anticipated future travel growth for a nationwide sample of more than 111,000 highway sections. While HERS analyzes these sample sections individually, the model is designed to provide results valid at the national level, and does not provide definitive improvement recommendations for individual highway segments.
| Q. | Does HERS identify a single "correct" level of highway investment? |
| A. | No. The HERS model is a tool for estimating what the consequences may be of various levels of spending on highway conditions and performance. If funding were unlimited, it might make sense to implement all projects identified by HERS as cost beneficial. In reality, however, funding is constrained, and highways must compete for funding with other economic priorities. The investment requirements scenarios in this chapter estimate the resources that would be required to attain certain levels of performance, but are not intended to endorse any specific level of funding as "correct" or "optimal." |
The HERS model initiates the investment requirements analysis by evaluating the current state of the highway system using information on pavements, geometry, traffic volumes, vehicle mix, and other characteristics from the HPMS sample dataset. It then considers potential improvements on sections with one or more deficiencies, including resurfacing, reconstruction, alignment improvements, and widening or adding travel lanes. The HERS model then selects the improvement with the greatest net benefits, where benefits are defined as reductions in direct highway user costs, agency costs, and societal costs. In cases where none of the potential improvements produces benefits exceeding construction costs, the segment is not improved. Appendix A contains a fuller description of the project selection and implementation process used by HERS.
| Q. | How closely does the HERS model simulate the actual project selection processes of State and local highway agencies? |
| A. | The HERS model is intended to approximate, rather than replicate, the decision processes used by State and local governments. HERS does not have access to the full array of information that local governments would use in making investment decisions. This means that the model results may include some highway and bridge improvements that simply are not practical because of factors the model doesn't consider. Excluding such projects would result in reducing the "true" level of investment that is economically justifiable. Conversely, the highway model assumes that State and local project selection will be economically optimal and doesn't consider external factors such as whether this will result in an equitable distribution of projects among the States or within each State. In actual practice, there are other important factors included in the project selection process aside from economic considerations; thus, the "true" level of investment that would achieve the outcome desired under the scenarios could be higher than that shown in this report. |
One of the key features of HERS as an economics-based model involves its treatment of travel demand. Recognizing that drivers will respond to changes in the relative price of driving and adjust their behavior accordingly, HERS explicitly models the relationship between the amount of highway travel and the price of that travel. This concept, sometimes referred to as travel demand elasticity, is applied to the forecasts of future travel found in the HPMS sample data. The HERS model assumes that the forecasts for each sample highway segment represent a future in which average conditions and performance are maintained, thus holding highway user costs at current levels. Any change in user costs relative to the initial conditions calculated by HERS will thus have the effect of either inducing or suppressing future travel growth on each segment. Consequently, for any highway investment requirement scenario that results in a decline in average user costs, the effective vehicle miles traveled (VMT) growth rate for the overall system will tend to be higher than the baseline rate derived from HPMS. For scenarios in which highway user costs increase, the effective VMT growth rate will tend to be lower than the baseline rate. A discussion of the impact that future investment levels could be expected to have on future travel growth is included in Chapter 9. Appendix A includes a further discussion of how travel demand elasticity is implemented in HERS.
While HERS was primarily designed to analyze highway segments, and the HERS outputs are described as "highway" investment requirements in this report, the model also factors in the costs of expanding bridges and other structures when deciding whether to add lanes to a highway segment. All highway and bridge investment requirements related to capacity are modeled in HERS; the NBIAS model considers only investment requirements related to bridge preservation.
Operations Investments
For this report, the HERS model has been adapted to take into account the impact that new investments in certain types of intelligent transportation systems (ITS) and the continued deployment of various operations strategies can have on highway system performance, and the amount of capital investment required to reach given performance benchmarks. The types of operations investments and strategies include those targeted at:
- Freeway management (ramp metering, electronic monitoring, variable message signs, and traffic management centers);
- Incident management (incident detection, verification, and response); and
- Arterial management (upgraded signal control, electronic monitoring, variable message signs, and emergency vehicle signal preemption).
| Q. | What are the costs associated with the operations strategies and investments included in the HERS investment analyses? |
| A. | The costs of the new or increased operations deployments include both the capital costs of the equipment and infrastructure and the ongoing costs of operating and maintaining that infrastructure. The costs include those for both the basic infrastructure needed to support a given strategy (such as a traffic operations management center) and the incremental costs of increasing the coverage of that structure (such as additional ramp meters). The estimated capital cost of new deployments under the existing trends scenario used for these analyses is $1.5 billion over 20 years (in 2002 dollars). These costs are included in the investment requirements estimates included in this report. Estimated operating and maintenance costs for the operations strategies over the same 2003 to 2022 time period are $10.9 billion, including $2.9 billion for new deployments and $8.0 billion for the existing infrastructure. These costs are not included in the "Cost to Maintain" or "Maximum Economic Investment" figures presented in this chapter, which are limited to capital investment requirements. Note that the costs shown above only reflect the particular types of improvements currently modeled in HERS, and thus represent a subset of total operations deployments that are expected to occur. This analysis attempts to capture other capital costs relating to operations control facilities via the external adjustment procedure for nonmodeled improvement types discussed above. |
Future operations investments are implemented in HERS through an assumed, exogenously specified scenario; they are not included directly in the benefit-cost calculations made within the model, and HERS does not directly consider any tradeoffs or complementarities between ITS and other types of highway improvements. The baseline scenario used for this report assumes the continuation of existing deployment trends. This baseline scenario was used for all of the HERS-based analyses presented in Chapters 7, 8, and 9. Chapter 10 includes a sensitivity analysis considering the potential impact of a more aggressive deployment scenario, as well as one showing the impact of ignoring operations entirely in the analysis.
Appendix A includes a more complete description of the operations strategies, their impacts on performance, and the implementation within HERS.
HERS Investment Scenarios
Two HERS investment scenarios were developed in order to generate the HERS-modeled portion of the two highway and bridge investment requirements scenarios. The HERS portion of the "Cost to Improve Highways and Bridges" was drawn from the HERS "Maximum Economic Investment" scenario, and the HERS "Maintain User Costs" scenario fed into the "Cost to Maintain Highways and Bridges." Exhibit 7-6 shows the estimated investment requirements under the two HERS scenarios. The impact of the various levels of investment on user costs and other indicators of highway condition and performance is presented in Chapter 9.
The "Maximum Economic Investment" scenario is of interest mainly because it defines the upper limit of highway investment that could be economically justified. It was used to generate the highway preservation and system capacity expansion components of the "Maximum Economic Investment for (Cost to Improve) Highways and Bridges." In this scenario, all improvements with a benefit-cost ratio greater than or equal to 1.0 are implemented in HERS. While this scenario does not target any particular level of desired system performance, it would eliminate the existing highway investment backlog and address other deficiencies that will develop over the next 20 years because of pavement deterioration and travel growth. As shown in Exhibit 7-6, the average annual investment modeled by the HERS "Maximum Economic Investment" scenario is $81.2 billion.
The second major highway investment requirement scenario in this report is the "Maintain User Costs" scenario. It was used to generate the highway preservation and system capacity expansion components of the "Cost to Maintain Highways and Bridges." This scenario gives the level of investment sufficient to allow total highway user costs per VMT at the end of the 20-year analysis period to match the base year levels. Highway user costs include travel time costs, vehicle operating costs, and crash costs. The average annual investment modeled by HERS under this scenario is estimated to be $49.3 billion.
| Combined Highway/Bridge Scenario | Average Annual Investment |
HERS Scenario | HERS- Derived Component 1 |
|---|---|---|---|
| Maximum Economic Investment for Highways and Bridges | $118.9 | Maximum Economic Investment | $81.2 |
| Cost to Maintain Highways and Bridges | $73.8 | Maintain User Costs | $49.3 |
| Q. | How is the HERS model used to produce investment requirements estimates for the various funding scenarios? |
| A. | The HERS model selects projects on the basis of their benefits and costs as calculated within the model. The HERS model can thus assign a benefit-cost ratio (BCR) to each selected improvement. The total investment over the 20-year forecast horizon is then estimated by establishing a list of cost-beneficial projects. For the "Maximum Economic Investment" scenario, all projects on the list are implemented. For other scenarios, projects are implemented in order of ranked BCR until a funding constraint is reached. By varying the funding constraint in different HERS runs and examining the output for different indicators, the user can then determine the level of investment that will achieve certain levels of condition and performance. It is important to note that these estimates represent the economically efficient levels of investment that would meet the targets, rather than the minimum amount of investment necessary to meet the same criteria. |
The "Maintain User Costs" concept was originally introduced in the 1997 C&P report to provide a new highway system performance benchmark based on economic criteria. It focuses on highway users, rather than the traditional engineering-based criteria, which are oriented more toward highway agencies. This scenario is also an important technical point in the operation of HERS, since the VMT growth rates in the model are partly dependent on changes in user costs, owing to the operation of the travel demand elasticity feature.
The impact of this and other levels of investment on individual highway user cost components (as well as other measures of conditions and performance) are discussed in Chapter 9.
Highway Investment Backlog
The highway investment backlog represents all highway improvements that could be economically justified for immediate implementation, based on the current conditions and operational performance of the highway system. The HERS model estimates that a total of $398 billion of investment could be justified based solely on the current conditions and operational performance of the highway system. Approximately 80 percent of the backlog is in urban areas, with the remainder in rural areas. About 60 percent of the backlog relates to capacity deficiencies on existing highways; the remainder results from pavement deficiencies.
| Q. | How does the HERS backlog estimate compare with what was reported in the 2002 C&P report? |
| A. | The estimated backlog is significantly higher than the $271.7 billion shown in the 2002 C&P report. This is due to several factors. First, as noted above, highway capital expenditures have been below the Cost to Maintain in recent years. Consequently, the overall performance of the system declined, which increased the number of potentially cost-beneficial highway and bridge investments that would address these performance problems. Second, as discussed in Appendix A, the HERS model has recently been modified to consider a broader range of alternative widening options, while the costs per lane mile of various highway improvements have been revised upward. While the higher costs would cause certain potential improvements to fall below the 1.0 BCR threshold, this is more than offset by the increased costs of other improvements whose BCR would remain above this level, and the broader range of potential improvements that the model can now evaluate. The overall "Maximum Economic Investment for Highways and Bridges," of which the backlog is a subset, is also higher than that estimated in the 2002 C&P report for similar reasons. |
This $398 billion backlog represents a subset of the "Maximum Economic Investment" scenario described above. Based on the average annual investment requirements identified in Exhibit 7 6, the total 20-year investment requirements under this scenario for capital improvements modeled by HERS would be approximately $1.6 trillion. This indicates that approximately 25 percent of the potential cost-beneficial improvements projected over the 20 year period could be implemented immediately if sufficient funding were available, while the remaining 75 percent would address deficiencies that are expected to develop between now and 2022.
Note that this figure does not include rural minor collectors or rural and urban local roads and streets because HPMS does not contain sample section data for these functional systems. The backlog figure also does not contain any estimate for system enhancements.
National Bridge Investment Analysis System
The estimates of future capital investment requirements relating to bridge preservation shown in this report are derived primarily from NBIAS, the successor to the Bridge Needs and Investment Process Model (BNIP) last used in the 1999 C&P report. The NBIAS incorporates analytical methods from the Pontis Bridge Management System. Pontis, first developed by FHWA in 1989, is now owned by the American Association of State Highway and Transportation Officials, which licenses the system to over 45 State transportation departments and other agencies.
While Pontis relies on detailed structural element-level data on bridges, NBIAS adds a capability to synthesize such data from general bridge condition ratings reported for all bridges in the NBI. While the analysis in this report is derived solely from NBI data, the current version of NBIAS is capable of processing element-level data directly. The NBIAS also builds certain economic criteria into its analytical procedures that are not currently included in Pontis. The NBIAS is discussed in more detail in Appendix B.
To estimate functional improvement needs, NBIAS applies a set of improvement standards and costs to each bridge in the NBI. The model then identifies potential improvements, such as widening existing bridge lanes, raising bridges to increase vertical clearances, and strengthening bridges to increase load-carrying capacity, and evaluates their potential benefits and costs.
The model uses a probabilistic approach to modeling bridge deterioration for each synthesized bridge element, relying on a set of transition probabilities that project the likelihood that an element will deteriorate from one condition state to another over a given period of time. The model then applies the Markov modeling approach from Pontis to determine an optimal set of preservation actions to take for each bridge element based on the condition of the element. As described in Appendix B, NBIAS has recently been modified to apply preservation policies at the individual bridge level and can now directly analyze costs and benefits of performing preservation work with the cost of completely replacing the bridge.
Bridge Investment Backlog
As defined in this report, the bridge investment backlog represents the cost of improving all existing bridge deficiencies if the benefits of doing so exceed the costs. The NBIAS defines deficiencies broadly and covers more than the structurally deficient and functionally obsolete categories defined in Chapter 3.
The NBIAS estimates that $62.6 billion could be invested immediately in a cost-beneficial fashion to replace or otherwise address currently existing bridge deficiencies.
| Q. | How does the NBIAS backlog estimate compare with what was reported in previous editions of the C&P report? |
| A. | The estimated backlog is higher than the $54.7 billion shown in the 2002 C&P report, but lower than the $87.3 billion shown in the 1999 C&P report computed using BNIP. The recent modifications to NBIAS to allow maintenance, repair, and replacement needs on an individual bridge level have allowed it to identify a broader range of potentially cost-beneficial improvements. The current estimate remains lower than what was projected by BNIP, as the reported backlog does not reflect potential improvements unless they pass a benefit-cost test. |
Bridge Investment Requirements Scenarios
The investment requirement scenarios for bridges have been renamed in this report to more accurately describe the manner in which they were computed in NBIAS, as the old names were more consistent with the BNIP engineering-based approach.
The "Maximum Economic Investment" scenario is the bridge preservation component of the "Cost to Improve Highways and Bridges" described earlier in this chapter. Where it is cost beneficial to do so, this scenario would eliminate the existing bridge investment backlog and correct other deficiencies that are expected to develop over the next 20 years. As shown in Exhibit 7-7, the average annual investment required under this scenario is estimated to be $12.5 billion, which is 10.5 percent of the $118.9 billion average annual investment required to improve highways and bridges over a 20-year period.
| Q. | How does the NBIAS definition of the bridge deficiencies compare with the information on structurally deficient bridges reported in Chapter 3? |
| A. | NBIAS considers bridge deficiencies and corrective improvements at the level of individual bridge elements. The economic backlog of bridge deficiencies estimated by NBIAS thus consists of the cost of all improvements to bridge elements that would be justified on both engineering and economic grounds. It includes many improvements on bridges with certain components that may warrant repair, rehabilitation, or replacement, but whose overall condition is not sufficiently deteriorated for them to be classified as structurally deficient. |
The "Maintain Economic Backlog" scenario is the bridge component of the "Cost to Maintain Highways and Bridges." This scenario identifies the level of annual investment that would be required so that the cost of addressing all bridge deficiencies in 2022 would remain the same as in 2002. Under this scenario, existing deficiencies and newly accruing deficiencies would be selectively corrected, but the overall level of deficiencies measured in dollar terms would be maintained. The average annual investment required under this scenario is estimated at $8.9 billion, or 12.1 percent of the $73.8 billion average annual investment required to maintain highways and bridges over a 20-year period.
| Combined Highway/Bridge Scenario | Average Annual Investment |
NBIAS Scenario | NBIAS- Derived Component 1 |
|---|---|---|---|
| Maximum Economic Investment for Highways and Bridges | $118.9 | Maximum Economic Investment | $12.5 |
| Cost to Maintain Highways and Bridges | $73.8 | Maintain Economic Backlog | $8.9 |