System Characteristics: Highways
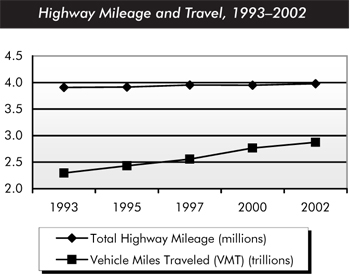
There were almost 3.98 million miles of public roads in the United States in 2002. This mileage was overwhelmingly rural and locally owned. About 3.08 million miles were in rural areas in 2002, or 77 percent of total mileage. The remaining 901,000 miles were in urban communities. There are 591,707 bridges in the United States.
Numerous trends are changing the extent and use of the American highway network. While total road mileage increased between 1993 and 2002, total rural mileage has decreased. This has been an ongoing trend, partly reflecting the reclassification of Federal roads and the growth of metropolitan areas throughout the United States.
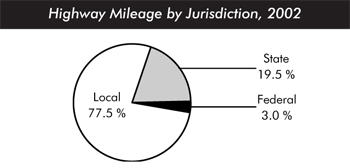
In 2002 about 77.5 percent of the highway miles were locally owned, States owned 19.5 percent, and 3.0 percent were owned by the Federal Government.
Americans traveled nearly 2.9 trillion vehicle miles in 2002. While highway mileage is mostly rural, a majority of highway travel (over 60 percent) occurred in urban areas in 2002. From 2000 to 2002, however, rural travel grew at a slightly faster average annual rate (2.8 percent) than urban travel (2.4 percent). This continues the trend noted in the 2002 C&P report. In the decade prior to 1993, urban travel growth rates were greater than rural. Vehicle miles traveled (VMT) nevertheless increased on every highway functional system from 2000 to 2002.
| Functional System | Miles | Lane Miles | Vehicle Miles Traveled |
|---|---|---|---|
| Rural Areas | |||
| Interstate | 0.8% | 1.6% | 9.8% |
| Other Principal Arterials | 2.5% | 3.1% | 9.0% |
| Minor Arterial | 3.5% | 3.5% | 6.2% |
| Major Collector | 10.8% | 10.4% | 7.5% |
| Minor Collector | 6.8% | 6.5% | 2.2% |
| Local | 52.9% | 50.6% | 4.9% |
| Subtotal Rural | 77.3% | 75.7% | 39.4% |
| Urban Areas | |||
| Interstate | 0.3% | 0.9% | 14.3% |
| Other Freeway and Expressway | 0.2% | 0.5% | 6.6% |
| Other Principal Arterial | 1.3% | 2.3% | 14.3% |
| Minor Arterial | 2.3% | 2.8% | 11.9% |
| Collector | 2.3% | 2.3% | 5.0% |
| Local | 16.2% | 15.5% | 8.4% |
| Subtotal Urban | 22.7% | 24.3% | 60.6% |
| Total | 100.0% | 100.0% | 100.0% |
In recent years, growth in VMT has exceeded the increase in highway lane miles. Between 1993 and 2002, lane miles grew by 0.2 percent annually, while VMT increased by 2.5 percent annually. VMT for trucks grew faster between 2000 and 2002 than did VMT for passenger vehicles.