


System Conditions: Highway and Bridges
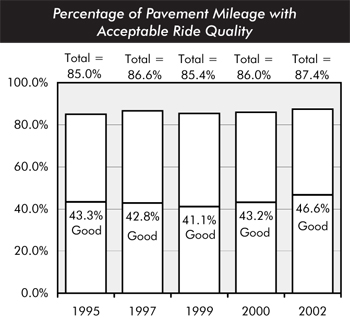
The ride quality of 87.4 percent of the Nation's total road mileage was rated "Acceptable" in 2002, up from 86.0 percent in 2000. Ride quality is defined based on pavement roughness. Pavements with roughness below 170 inches per mile are considered to have "acceptable" ride quality. Pavements with "good" ride quality comprised 46.6 percent of total highway mileage in 2002.
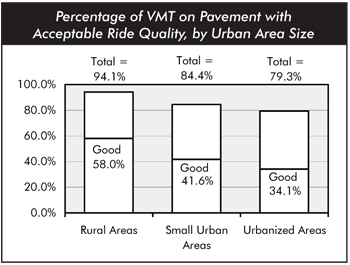
Pavement ride quality is generally better on higher functional class roads, and is better in rural areas (where 94.1 percent of travel is on pavements with acceptable ride quality) than in urbanized areas.
Information on ride quality on the National Highway System (the basis of the pavement performance measures in DOT's Strategic Plan) is located in Chapter 17.
The number of deficient bridges is widely used by policymakers to describe bridge quality nationwide. Deficient bridges include those characterized both as structurally deficient (deteriorated condition and the reduced load-carrying capacity) and as functionally obsolete (based appraisals of clearance adequacy, deck geometry, and alignment). Of the 591,707 bridges in the inventory, 162,869 (27.5 percent) were deficient in 2002. Of these, 81,304 (13.7 percent) were classified as structurally deficient and 81,565 (13.8 percent) were classified as functionally obsolete.
The percentage of bridges classified as deficient declined from 28.5 percent in 2000 to 27.5 percent in 2002. This reduction is mostly due to work done to correct problems on structurally deficient bridges. The percentage of functionally obsolete bridges has not changed significantly.
| Year | 1998 | 2000 | 2002 |
|---|---|---|---|
| Rural Bridges | |||
| Structurally Deficient | 17.4% | 16.2% | 15.1% |
| Functionally Obsolete | 11.4% | 11.4% | 11.4% |
| Total Deficiencies | 28.8% | 27.6% | 26.5% |
| Urban Bridges | |||
| Structurally Deficient | 11.0% | 9.9% | 9.2% |
| Functionally Obsolete | 21.5% | 22.0% | 21.9% |
| Total Deficiencies | 32.5% | 31.9% | 31.2% |
| All Bridges | |||
| Structurally Deficient | 16.0% | 14.8% | 13.7% |
| Functionally Obsolete | 13.6% | 13.8% | 13.8% |
| Total Deficiencies | 29.6% | 28.5% | 27.5% |
Other indicators of bridge conditions, including the traffic carried on deficient bridges and the deck area on deficient bridges, are described in the body of Chapter 3 and in Chapter 15.