U.S. Department of Transportation
Federal Highway Administration
1200 New Jersey Avenue, SE
Washington, DC 20590
202-366-4000


Skip to content
Facebook iconYouTube iconTwitter iconFlickr iconLinkedInInstagram

Policy and Governmental Affairs

FHWA Home / Policy & Governmental Affairs / 2004 Conditions and Performance

Conditions and Performance

2004 Conditions and Performance Report: Executive Summary Chapter 4
Status of the Nation's Highways, Bridges, and Transit:
2004 Conditions and Performance

Chapter 4 Executive Summary

Operational Performance: Highways

Three measures of congestion developed by the Texas Transportation Institute (TTI) clearly show congestion is getting worse throughout the Nation. (Note that the values shown in this report are based on data for all urbanized areas. The values shown for these same measures in TTI's annual Urban Mobility Study are different, since that study is based on a subset of urbanized areas that is weighted towards the most heavily populated areas.)

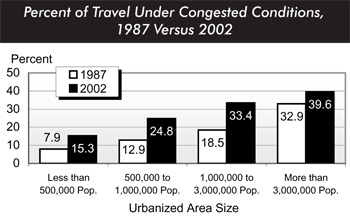
Percent of Travel Under Congested Conditions:

Percent of Travel Under Congested Conditions is an indicator of the portion of traffic on freeways and other principal arterials in an urbanized area that moves at less than free-flow speeds. Congested travel increased from 21.1 percent in 1987 to 30.4 percent in 2002. The length of the average congested period, or "rush hour," increased from 5.4 to 6.6 hours per day over these 15 years. For urban areas with populations greater than 3 million, 39.6 percent of daily travel in 2002 occurred under congested conditions.

Percent of travel under congested conditions, 1987 versus 2002. Bar chart comparing values for four categories of urban area population. For urban areas with a population of less than 500,000, the value for 1987 is 7.9 percent and the value for 2002 is 15.3 percent. For urban areas with a population of 500,000 to 1 million, the value for 1987 is 12.9 percent and the value for 2002 is 24.8 percent. For urban areas with a population of 1 million to 3 million, the value for 1987 is 18.5 percent and the value for 2002 is 33.4 percent. For urban areas with a population of more than 3 million, the value for 1987 is 32.9 percent and the value for 2002 is 39.6 percent.

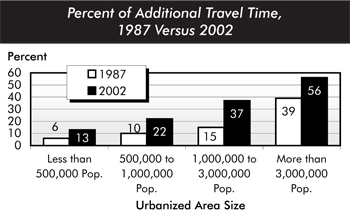
Percent of Additional Travel Time:

Percent of Additional Travel Time is an indicator of the additional time required to make a trip during the congested peak travel period rather than at other times of the day. In 2002, an average peak period trip required 37.0 percent more timethan the same trip under nonpeak, noncongested conditions. In 1987, a 20-minute trip during noncongested periods required 24.4 minutes under congested conditions. The same trip in 2002 required 27.4 minutes, or an additional 3 minutes.

Between 1987 and 2002, the percent of additional travel time grew fastest in urbanized areas with a population between 1 million and 3 million.

Percent of additional travel time, 1987 versus 2002. Bar chart comparing values for four categories of urban area population. For urban areas with a population of less than 500,000, the value for 1987 is 6 percent and the value for 2002 is 13 percent. For urban areas with a population of 500,000 to 1 million, the value for 1987 is 10 percent and the value for 2002 is 22 percent. For urban areas with a population of 1 million to 3 million, the value for 1987 is 15 percent and the value for 2002 is 37 percent. For urban areas with a population of more than 3 million, the value for 1987 is 39 percent and the value for 2002 is 56 percent.

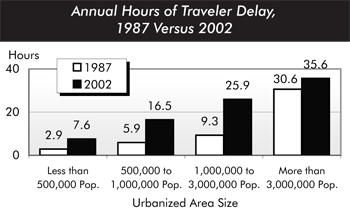
Annual Hours of Traveler Delay:

Annual Hours of Traveler Delay is an indicator of the total time an individual loses due to traveling under congested conditions. Cities with populations between 500,000 and 1 million experienced the greatest percentage growth in the average annual delay experienced by drivers, from 5.9 hours in 1987 to 16.5 hours in 2002—an increase of nearly 180 percent.

Annual hours of traveler delay, 1987 versus 2002. Bar chart comparing values for four categories of urban area population. For urban areas with a population of less than 500,000, the value for 1987 is 2.9 hours and the value for 2002 is 7.6 hours. For urban areas with a population of 500,000 to 1 million, the value for 1987 is 5.9 hours and the value for 2002 is 16.5 hours. For urban areas with a population of 1 million to 3 million, the value for 1987 is 9.3 hours and the value for 2002 is 25.9 hours. For urban areas with a population of more than 3 million, the value for 1987 is 30.6 hours and the value for 2002 is 35.6 hours.

Page last modified on November 7, 2014
Federal Highway Administration | 1200 New Jersey Avenue, SE | Washington, DC 20590 | 202-366-4000