


Safety Performance: Highways
The U.S. Department of Transportation has established the goal of reducing the highway fatality rate to 1.00 per 100 million VMT by 2008. Federal safety initiatives intended to support the achievement of this goal are discussed in Chapter 11, while this chapter focuses on safety statistics.
Highway fatalities increased slightly between 1997 (42,013) and 2002 (43,005). Although the number of fatalities has fallen sharply since 1966, when Federal legislation first addressed highway safety, there has been a steady increase in the annual number of fatalities between 1994 and 2002.
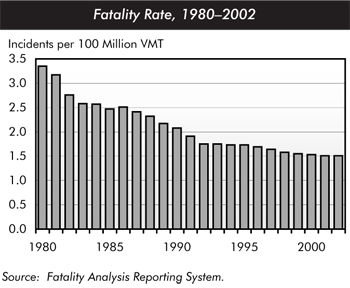
The fatality rate per 100 million VMT dropped from 1.64 in 1997 to 1.51 in 2002. This drop coincided with a significant increase in the number of VMT. Similarly, the fatality rate per 100,000 population was 14.93, a decrease from the 1997 fatality rate of 15.69.
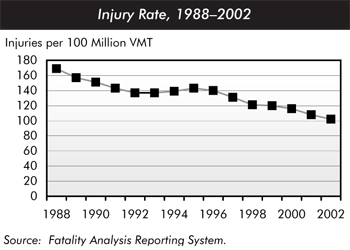
The number of injuries declined from about 3.35 million in 1997 to 2.89 million in 2002. The injury rate per 100,000 people declined from 1,250 in 1997 to 1,016 in 2002, and the injury rate per 100 million VMT dropped from 131 in 1997 to 102 in 2002.
Alcohol-impaired driving is a serious public safety problem in the United States. The National Highway Traffic Safety Administration (NHTSA) estimates that alcohol was involved in 41 percent of fatal crashes and 6 percent of all crashes in 2002. The 17,524 fatalities in 2002 represent an average of one alcohol-related fatality every 30 minutes.
The number of alcohol-related fatalities dropped from 17,908 in 1993 to 17,524 in 2002, although the pattern of alcohol-related fatalities has been uneven—declining between 1996 and 1999, then increasing between 1999 and 2002.
| 1993 | 1995 | 1997 | 1999 | 2000 | 2002 |
|---|---|---|---|---|---|
| 17,908 | 17,732 | 16,711 | 16,572 | 17,380 | 17,524 |
The most common types of fatalities are those related to alcohol-impaired driving, single-vehicle run-off-the-road crashes, and speeding. There is a correlation between speeding, age, and alcohol consumption in fatal crashes. The NHTSA estimates that in 2002, 27 percent of underage speeding drivers involved in fatal crashes were intoxicated, while only 12 percent of underage nonspeeding drivers involved in fatal crashes were intoxicated.