Safety Performance: Transit
Public transit in the United States has been and continues to be a highly safe mode of transportation, as evidenced by statistics on incidents, injuries, and fatalities reported by transit agencies for the vehicles they operate directly. Reportable safety incidents include collisions and any other type of occurrence (e.g., derailment) that result in injury or death, or fire or property damage in excess of a threshold. Injuries and fatalities include those suffered by riders as well as by pedestrians, bicyclists, and people in other vehicles. Injuries and fatalities may occur while traveling or while boarding, alighting, or waiting for a transit vehicle.
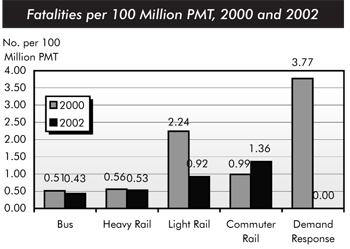
In 2002, the definitions of an incident and an injury were revised. The threshold for a reportable safety incident was raised from $1,000 to $7,500. An injury was redefined to be an occurrence that required immediate transportation for medical care away from the scene of the incident. Before 2002, any event for which the FTA received a report was classified as an injury. These adjustments to incident and injury definitions led to a decrease in reported incidents and injuries in 2002. These adjustments preclude the direct comparison of 2002 incident and injury statistics with those for earlier years. The definition of fatalities has remained the same. Fatalities decreased from 292 in 2000 to 282 in 2002, and fell from 0.69 per 100 million PMT in 2000, to 0.66 per 100 million PMT in 2002.
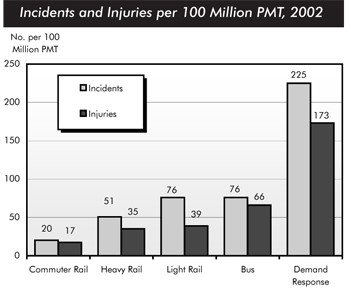
Transit vehicles that travel on roads have higher incident and injury rates than those that travel on fixed guideways. Incidents and injuries, when adjusted for PMT, are consistently the lowest for commuter rail and highest for demand response systems. Buses and demand response vehicles experienced the greatest fall in reported incidents and injuries from 2000 to 2002 as a result of the changes in definitions. While buses historically have had more incidents per PMT than light rail, the number of incidents reported by each of these modes was the same in 2002 under the new higher incident reporting threshold.
Fatalities, adjusted for PMT, are lowest for buses and heavy rail systems. Fatality rates for commuter and light rail have, on average, been higher than fatality rates for heavy rail. Demand response vehicles have widely fluctuating fatality rates, well above those for other types of transit services. There were, however, no fatalities on demand response vehicles operated directly by public transit agencies in 2002.