


Finance: Transit
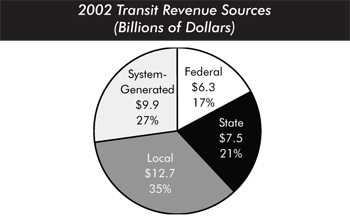
In 2002, $36.5 billion was available from all sources to finance transit capital investments and operations. Transit funding comes from: public funds allocated by Federal, State, and local governments; and system-generated revenues earned by transit agencies from the provision of transit services. In 2002, Federal funds accounted for 17 percent of all transit revenue sources, State funds for 21 percent, local funds for 35 percent, and system-generated funds for 27 percent.
Eighty percent of the Federal funds allocated to transit are from a dedicated portion of the Federal motor-fuel tax receipts, and 20 percent are from general revenues. Federal funding for transit increased from $5.3 billion in 2000 to $6.3 billion in 2002, and State and local funding increased from $15.7 billion in 2000 to $20.3 billion in 2002.
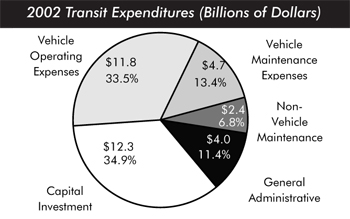
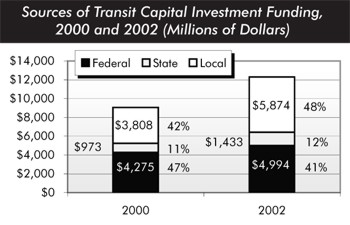
In 2002, $12.3 billion, or 34.9 percent of total available transit funds, was spent on capital investment. Federal capital funding was $5.0 billion, or 40.6 percent of total capital expenditures; State capital funding was $1.4 billion, or 11.6 percent of total capital expenditures; and local capital funding was $5.8 billion, or 47.8 percent of total capital expenditures. Between 2000 and 2002, Federal capital funding increased by 17 percent and State and local capital funding by 53 percent.
In 2002, $4.1 billion, or 33 percent of total capital expenditures, was for rolling stock; $3.2 billion, or 26 percent, was for guideway; $2.2 billion, or 18 percent of capital spending, was for facilities; and $1.0 billion, or 8 percent, was for other capital.
In 2002, $24.2 billion was available for operating expenses and accounted for 65.1 percent of total available funds. System-generated revenues provided $9.9 billion, or 41.0 percent of the total amount available for operating expenses; local governments provided $6.9 billion (28.4 percent), State governments provided $6.1 billion (25.3 percent), and the Federal government provided $1.3 billion (5.4 percent). Actual operating expenditures were $22.9 billion, slightly below the amount available. Vehicle operating expenses were $11.8 billion, or 51.5 percent of total operating expenses; vehicle maintenance expenses were $4.7 billion, or 20.3 percent of total operating expenses, nonvehicle maintenance expenses were $2.4 billion, or 10.6 percent of total operating expenses; and general administrative expenses were $4.0 billion, or 17.6 percent of total operating expenses.