Comparison of Spending and Investment Requirements: Highway and Bridge
While this report does not recommend any specific level of investment, a comparison of the investment requirement scenarios with current and projected spending levels provides some insights into the likelihood that the level of performance implied by the scenarios will be achieved.
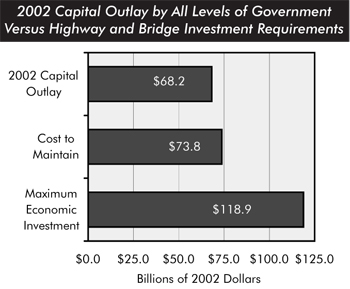
Federal, State, and local capital expenditures for highways and bridges totaled $68.2 billion in 2002. Capital outlay by all levels of government would have to increase by 8.3 percent above this level to reach the projected $73.8 billion Cost to Maintain Highways and Bridges level. The percentage gap is greatest for the highway pavement preservation component of the Cost to Maintain. Capital expenditures for bridge preservation were 21 percent higher than the estimated annual cost to maintain the current economic backlog of bridge improvements in constant dollar terms (though significant progress remains to be made in reducing the number of deficient bridges). An increase in highway capital outlay of 74.3 percent above current levels would be required to reach the projected $118.9 billion Maximum Economic Investment (Cost to Improve Highways and Bridges) level.
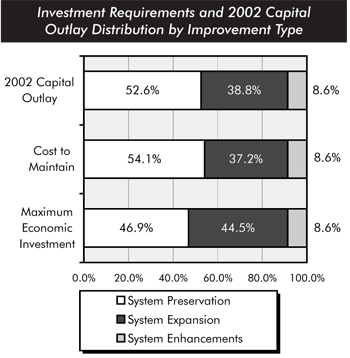
The distribution of funding by investment type suggested by the investment requirement scenarios developed using the HERS and NBIAS models depends on the level of available funding. In 2002, 38.8 percent of highway capital outlay went for system expansion, including the construction of new roads and bridges and the widening of existing facilities.
For the Cost to Maintain Highways and Bridges, 37.2 percent of the projected 20-year investment requirements is for system expansion, slightly lower than its share of current capital spending. The analysis indicates that modest increases in funding over current levels might best be directed more toward system preservation than is currently the case. However, if funding were to rise significantly above this level, the analysis suggests that even more cost-beneficial system expansion expenditures would be found, so that at the Maximum Economic Investment level, 44.5 percent of total investment requirements are for system expansion.