


- Interstate System
- Background
- Characteristics, Conditions, and Performance
- Interstate System Characteristics
- Interstate Use Characteristics
- Pavement Ride Quality
- Lane Width, Alignment, and Access Control
- Bridge Age and Conditions
- Safety Performance
- Finance
- Future Capital Investment and Performance
- Rural Interstates
- Urban Interstates
- Bridge Rehabilitation and Replacement
- Current Spending and Future Investment
Interstate System
In 2006, the Dwight D. Eisenhower National System of Interstate and Defense Highways, commonly known as the Interstate System, turns 50 years old. On June 29, 1956, President Eisenhower signed the Federal-Aid Highway Act of 1956, which launched the Interstate construction program. The safety and operational benefits of the Interstate System were felt as each segment opened and the miles began to stretch across the country. The Interstate System has become the backbone of transportation and commerce in the United States over the last half-century.
The Interstate System has become such an integral element of the American way of life that most people never knew or have forgotten what highway travel was like in the pre-Interstate era. As a result, they take it for granted. The 50th anniversary is a time to remind people of what is possibly the greatest public works project in history and to honor the men and women who made it possible. More important, it is an opportunity to examine what the country will have to do to keep the Interstates an evolving and flexible network that will continue to meet the changing needs—economic, social, and military—of the 21st century.
Along with a brief history, this chapter provides a snapshot of the current physical conditions, operational performance, and finance of the Interstate System, and projects the potential impacts of future investment on the Interstates. This chapter represents a supplementary analysis to those of the larger, national road network presented in Chapters 2 through 9 of the report.
Background
The Interstate System dates to the period in the late 1930s when the United States was completing its first "Interstate System," a two-lane paved network of highways generally carrying U.S. highway numbers (such as U.S. 1 and U.S. 66). Its safety and operational deficiencies for the growing traffic volumes of the day prompted consideration of the next stage of highway development.
In a 1939 report to Congress titled Toll Roads and Free Roads, the U.S. Bureau of Public Roads (BPR) described the need for a toll-free network of express highways. A 1944 report to Congress, Interregional Highways, prompted Congress to incorporate the concept into the Federal-Aid Highway Act of 1944. The legislation authorized designation of a 40,000-mile "National System of Interstate Highways" that would connect principal metropolitan areas, cities, and industrial centers; serve the national defense; and provide suitable connections with Canada and Mexico.
On August 2, 1947, the BPR (then called the Public Roads Administration) designated the first 37,681 miles of principal highways, including 2,882 miles carrying the routes through urban areas. The agency reserved the remaining 2,319 for urban circumferential and distributing routes that would be designated at a later date (in 1955 as it turned out). As the announcement of the designation pointed out:
Although the new interstate system follows, in general, the principal routes in the present Federal-aid system, it may be necessary in many instances to relocate existing highways or build alternate routes for express traffic in order to meet essential standards of width, grade, alignment, and control of access.
Although the 1944 Act was a major step forward, it did not authorize special funds for the Interstate System. The assumption was that the State highway agencies would use their annual apportionment of Federal-aid highway funds on Interstate projects. Although some progress was made, the pace was slow and the lack of progress frustrating.
President Eisenhower took office on January 20, 1953, with a keen understanding of the value of roads. As a young officer in 1919, he had been an observer on the U.S. Army's first transcontinental convoy—a 2-month trek from Washington, D.C., to San Francisco over roads that often challenged the sturdiest military vehicles. During and after World War II, he had seen the autobahn express highway network Germany had built in the 1930s and understood the network's military and civilian value. As he would say in his memoirs, "The old convoy had started me thinking about good, two-lane highways, but Germany had made me see the wisdom of broader ribbons across the land."
With the President's strong support, the Federal-Aid Highway Act of 1956 declared that the completion of the "National System of Interstate and Defense Highways" was essential to the national interest. It made national commitment to Interstate completion within the Federal-State partnership of the Federal-aid highway program, with the State responsible for construction to approved standards. In addition, the legislation authorized Interstate Construction funds for what was expected to be the entire construction period (through FY 1969, with completion in 1971).
The 1956 Act resolved the challenging issue of how to pay for construction by establishing the Highway Trust Fund to ensure that revenue from highway user taxes, such as the gas tax, would be dedicated to the Interstate System and other Federal-aid highway and bridge projects. The Highway Trust Fund has allowed massive investment in infrastructure projects—generating $182 billion starting in FY 1957 for the Interstates alone (for construction and improvement) through apportionments to the States.
President Eisenhower wrote in his memoirs that "more than any single action by the government since the end of the war, this one would change the face of America. Its impact on the American economy…was beyond calculation." A look back on the 50th anniversary of the 1956 Act reveals that his prediction proved true. Although the Interstate System accounts for slightly more than 1 percent of the Nation's total public road mileage, it carries over 24 percent of all highway travel. The Dwight D. Eisenhower National System of Interstate and Defense Highways, as it is now called, accelerated interstate and regional commerce, enhanced the country's competitiveness in international markets, increased personal mobility, and accelerated metropolitan development throughout the United States. At the same time, it facilitated military transportation from the Cold War to the War on Terrorism.
The National Highway System Designation Act of 1995 included the Interstate System as the core of a National Highway System (NHS), described in Chapter 12.
Characteristics, Conditions, and Performance
Expectations of the Interstate System have changed dramatically since the start of the construction program in 1956. The year before, the BPR had submitted a report to Congress on Needs of the Highway Systems, 1955-84 (the Interstate portion of the report covered only the 37,681 miles designated in 1947). The report assumed that the Interstate System would be completed by 1966. Much of the construction would take place on the alignment of the existing road in the designated Interstate corridor. A substantial portion of the Interstate System, nearly 7,000 miles, would need only two lanes through the mid-1960s, while 28,000 miles would require four lanes. Only about 2,300 miles would require six or more lanes and that only in the more heavily populated areas. Minimum design standards assumed that, in less populated areas, particularly in the West, two-lane Interstates could retain at-grade intersections with lower-volume highways and railroads.
The 1956 Act and subsequent legislation changed these assumptions. Higher design standards would be adopted; all routes were required to have a minimum of four lanes with no at-grade crossings. The features needed for full access control and safe, efficient operation required construction on new alignment for much of the Interstate System. More mileage was authorized (including 1,000 miles in 1956 and another 1,500 miles in 1968), bringing the total covered by the 1956 Act, as amended, to 42,794 miles. Moreover, construction of the Interstates evolved from an engineering feat, as it was perceived at the start, to a challenge of blending engineering necessity with environmental sensitivity and serving traffic needs while eliminating or reducing adverse impacts. As traffic volumes increased substantially, the pressure to improve performance far exceeded the high expectations common at the start of the program.
This evolution of assumptions and expectations highlights the importance of understanding the conditions and performance of the Interstate System today. As officials explore the future of the Interstate System, an accurate assessment of network and use characteristics will provide a baseline for the discussion. It can be, however, only a baseline, for as the history of the Interstate System demonstrates, many unforeseeable factors will affect its performance in coming decades.
Interstate System Characteristics
Exhibit 11-1 describes the total public road length of the Interstate System (comparable data for all roads can be found in the "Highways by Purpose" section in Chapter 2). The route miles of the Interstate System in the United States increased from 46,747 in 2004 to 46,835 in 2004. About 67.1 percent (31,447 route miles) were in rural areas, slightly less than 4.5 percent (2,088 route miles) were in small urban areas, and 28.3 percent (13,270 route miles) were in urbanized areas. By comparison, of the total 3,997,462 route miles for all roads in the United States, slightly more than 75.1 percent were in rural areas, slightly less than 4.7 percent were in small urban areas, and the remaining approximately 20.2 percent were in urbanized areas.
| 1995 | 1997 | 2000 | 2002 | 2004 | Annual Rate of Change 2004/1995 |
|
|---|---|---|---|---|---|---|
| Route Miles | ||||||
| Rural | 32,703 | 32,919 | 33,152 | 33,107 | 31,477 | -0.4% |
| Small Urban | 1,731 | 1,744 | 1,794 | 1,808 | 2,088 | 2.1% |
| Urbanized | 11,569 | 11,651 | 11,729 | 11,832 | 13,270 | 1.5% |
| Total | 46,003 | 46,314 | 46,675 | 46,747 | 46,835 | 0.2% |
| Lane Miles | ||||||
| Rural | 132,346 | 133,573 | 135,000 | 135,032 | 128,012 | -0.4% |
| Small Urban | 7,269 | 7,365 | 7,626 | 7,776 | 8,890 | 2.3% |
| Urbanized | 64,865 | 65,603 | 67,020 | 68,088 | 75,127 | 1.6% |
| Total | 204,480 | 206,541 | 209,647 | 210,896 | 212,029 | 0.4% |
The number of Interstate route miles in rural areas declined from 33,107 in 2002 to 31,477 in 2004. During the same period, the number of Interstate System miles in small urban areas increased from 1,808 in 2002 to 2,088 in 2004 and the number of route miles in urbanized areas increased from 11,832 in 2002 to 13,270 in 2004. Rural Interstate route miles declined due to the expansion of small urban and urbanized boundaries resulting from the 2000 decennial census, causing some formerly rural areas to be reclassified as urban. Note that some States are typically faster than others in modifying their data reporting to correspond to new decennial census information; therefore, while many of the states have submitted modified information to the Highway Performance Monitoring System (HPMS), some changes may still be forthcoming. The next edition of the C&P report may still show some minor additional rural Interstate mileage having been reclassified as urban.
Between 1995 and 2004, rural Interstate route miles decreased by approximately 0.4 percent annually, small urban Interstate route miles increased at an average annual rate of 2.1 percent, and Interstate route miles in urbanized areas increased 1.5 percent annually. The 0.2 percent overall annual growth rate for Interstates roughly matches that for all roads during that time period.
Exhibit 11-1 also describes the number of Interstate lane miles between 1995 and 2004 (comparable data for all roads can be found in the "Highways by Purpose" section in Chapter 2). In 2004, there were 212,029 lane miles of Interstates in the United States. Slightly less than 60.4 percent were in rural communities, just less than 4.2 percent were in small urban areas, and 35.4 percent were in urbanized areas. By comparison, about 73.4 percent of all highway lane miles in the United States were in rural areas, 4.8 percent of lane miles were in small urban areas, and 21.8 percent of lane miles were in urbanized areas.
Between 1995 and 2004, rural Interstate lane miles decreased by 0.4 percent annually, small urban Interstate lane miles grew at 2.3 percent annually, and urbanized Interstate lane miles increased by 1.6 percent annually. The annual growth rate of lane miles from 1995 to 2004 for the total Interstate System was 0.5 percent annually or almost double the annual growth rate of lane miles for all roads in the United States over the same period. This growth in Interstate lane miles has occurred due to both new construction and the reclassification of some arterials to Interstate status.
Exhibit 11-2 describes the number of Interstate bridges in 1996, 1998, 2000, 2002, and 2004 (comparable data for all bridges can be found in the "Bridges by Functional Classification" section in Chapter 2). Between 1996 and 2004, the number of rural Interstate bridges decreased from 28,638 to 27,648 bridges, while during the same period, the number of urban Interstate bridges increased from 26,596 to 27,667. The reduction in rural bridges is caused in part by the reclassification of some rural Interstates to urban status as communities have grown in size.
| 1996 | 1998 | 2000 | 2002 | 2004 | |
|---|---|---|---|---|---|
| Rural | 28,683 | 27,530 | 27,797 | 27,316 | 27,648 |
| Urban | 26,596 | 27,480 | 27,882 | 27,929 | 27,667 |
| Total | 55,234 | 55,010 | 55,679 | 55,245 | 55,315 |
Interstate Use Characteristics
Exhibit 11-3 describes vehicle miles traveled (VMT) on Interstate highways between 1995 and 2004 (comparable data for all roads can be found in the "Highways Travel" section in Chapter 2). In 2004, Americans traveled more than 267 billion vehicle miles on rural Interstates, 25.7 billion vehicle miles on small urban Interstates, and in excess of 433.9 billion vehicle miles on urban Interstates. Interstate travel continued to represent the fastest-growing portion of VMT between 1995 and 2004. Interstate VMT grew at an average annual rate of approximately 2.8 percent during this period, while VMT on all roads grew by about 2.3 percent annually.
| 1995 | 1997 | 2000 | 2002 | 2004 | Annual Rate of Change 2004/1995 | |
|---|---|---|---|---|---|---|
| Rural | 224,705 | 241,451 | 269,533 | 281,461 | 267,397 | 2.0% |
| Small Urban | 17,310 | 18,393 | 21,059 | 22,578 | 25,784 | 4.5% |
| Urbanized | 327,329 | 346,376 | 375,088 | 389,903 | 433,982 | 3.2% |
| Total | 569,345 | 606,220 | 665,681 | 693,941 | 727,163 | 2.8% |
Many of the operational performance measures discussed in Chapter 4 are not computed separately by functional class, so no specific information is available for the Interstate System. However, data for the Daily Vehicle Miles Traveled (DVMT) per Lane Mile metric are available on a functional class basis, and demonstrates the increasing demands being placed on the Interstate System. From 1995 to 2004, DVMT per lane mile increased from 4,329 to 5,707 on rural Interstate highways, from 6,254 to 7,925 on small urban Interstate highways, and from 13,826 to 15,783 on Interstate highways in urbanized areas (comparable data for all roads can be found in the "DVMT per Lane Mile" section in Chapter 4).
Exhibit 11-4 describes Interstate highway travel by vehicle type between 1995 and 2004. In 2004, 81.3 percent of travel on rural Interstates was by passenger vehicle; 2.9 percent was by single-unit truck; and 15.9 percent was by combination truck. About 92.8 percent of urban Interstate travel was by passenger vehicle; 2.1 percent was by single-unit truck; and 5.1 percent was by combination truck. By contrast, passenger vehicle travel represented approximately 92.3 percent of travel on all roads in 2004. Single-unit truck travel was just above 2.7 percent of travel, and combination truck travel represented slightly more than 4.9 percent.
| 1995 | 1997 | 2000 | 2002 | 2004 | Annual Rate of Change 2004/1995 |
|
|---|---|---|---|---|---|---|
| Rural | ||||||
| PV | 180,031 | 188,969 | 214,175 | 224,375 | 270,816 | 4.6% |
| SU | 6,708 | 7,667 | 8,260 | 8,745 | 9,627 | 4.1% |
| Combo | 36,644 | 41,642 | 44,377 | 45,633 | 52,828 | 4.1% |
| Urban | ||||||
| PV | 315,888 | 330,668 | 358,906 | 373,957 | 471,597 | 4.6% |
| SU | 7,148 | 7,906 | 8,719 | 9,106 | 10,482 | 4.3% |
| Combo | 18,492 | 20,641 | 23,472 | 23,887 | 26,044 | 3.9% |
Travel on rural and urban Interstates grew faster than on any other functional system. Between 1995 and 2004, for example, combination truck travel grew by 3.9 percent annually on urban Interstates and by 4.1 percent on rural Interstates. By comparison, combination truck travel on all roads increased by 2.6 percent annually during the same period.
Pavement Ride Quality
The Federal Highway Administration (FHWA) has adopted a performance measure for the NHS based on the percentage of VMT that occurs on roadways meeting the standard for "good" ride quality, defined as having an International Roughness Index (IRI) value of less than 95 inches per mile. Another measure still in use is based on "acceptable" ride quality, defined as having an IRI value of less than or equal to 170 inches per mile. Note that, based on the way the measures are defined, "good" is a subset of "acceptable."
Exhibit 11-5 shows the percentage of total Interstate VMT on pavements with good and/or acceptable ride quality broken down by population area subsets (comparable data for other functional systems can be found in the "Overall Pavement Ride Quality" section in Chapter 3). Since 1995, the percentage of VMT on pavements with good ride quality has increased in rural areas, small urban areas, and urbanized areas.
| Quality | 1995 | 1997 | 1999 | 2000 | 2002 | 2004 |
|---|---|---|---|---|---|---|
| Good (IRI<95) | ||||||
| Rural Areas | 53.3% | 56.5% | 66.8% | 69.6% | 72.2% | 73.7% |
| Small Urban Areas | 51.4% | 52.9% | 59.8% | 62.5% | 65.1% | 65.6% |
| Urbanized Areas | 39.1% | 35.4% | 39.7% | 42.5% | 43.8% | 48.5% |
| Acceptable (IRI≤170) | ||||||
| Rural Areas | 94.5% | 95.7% | 97.4% | 97.4% | 97.3% | 97.8% |
| Small Urban Areas | 94.9% | 96.1% | 95.9% | 95.3% | 94.6% | 95.0% |
| Urbanized Areas | 88.8% | 88.1% | 90.4% | 91.0% | 89.3% | 89.9% |
Among the three population area subsets shown, rural Interstates had the highest percentage of VMT on pavements with good ride quality in 2004, at 73.7 percent. A total of 97.8 percent of all VMT on the rural Interstate System occurred on pavements with acceptable ride quality.
On small urban Interstates, the percentage of VMT occurring on pavements with good ride quality was 65.6 percent in 2004. VMT on small urban Interstate pavements classified as having acceptable ride quality was 95.0 percent. For urbanized Interstates, the percentage of VMT on pavements with good ride quality was 48.5 percent in 2004, while the percentage of VMT on acceptable ride quality pavements was 89.9 percent.
Lane Width, Alignment, and Access Control
As described in Chapter 3, roadway alignment affects the level of service and safety of the highway system. Inadequate alignment may result in speed reductions as well as impaired sight distance. In particular, trucks are affected by inadequate roadway alignment with regard to speed.
There are two types of alignment: horizontal (curvature) and vertical (gradient). Alignment adequacy is evaluated on a scale from Code 1 (best) to Code 4 (worst). Exhibit 11-6 summarizes alignment for rural Interstates (alignment is normally not an issue in urban areas). More than 92.6 percent of rural Interstate miles are classified as Code 1 for vertical alignment and 95.4 percent as Code 1 for horizontal alignment (comparable data for other functional systems can be found in the "Roadway Alignment" section in Chapter 3).
| Vertical | Horizontal | ||
|---|---|---|---|
| Code 1: | All curves and grades meet appropriate design standards. | 92.6% | 95.3% |
| Code 2: | Some curves or grades are below design standards for new construction, but curves can be negotiated safely at prevailing speed limits. Truck speed is not substantially affected. | 6.3% | 1.3% |
| Code 3: | Infrequent curves or grades occur that impair sight distance or severely affect truck speeds. May have reduced speed limits. | 0.4% | 0.8% |
| Code 4: | Frequent grades occur that impair sight distance or severely affect truck speeds. Generally, curves are unsafe or uncomfortable at prevailing speed limit, or the speed limit is severely restricted due to the design speed limits of the curves. | 0.7% | 2.6% |
Lane width can have an impact on highway safety and operational performance. Currently, higher functional systems such as Interstates are expected to have 12-foot lanes. As shown in Exhibit 11-7, approximately 99.7 percent of rural Interstate miles and 98.3 percent of urban Interstate miles have minimum 12-foot lane widths (comparable data for other functional systems can be found in the "Lane Width" section in Chapter 3).
| >=12 ft | 11 ft | 10 ft | 9 ft | <9 ft | |
|---|---|---|---|---|---|
| Rural | 99.66% | 0.32% | 0.00% | 0.00% | 0.02% |
| Urban | 98.31% | 1.55% | 0.10% | 0.00% | 0.03% |
The vast majority of the Interstate mileage consists of divided highways with a minimum of four lanes and full access control. The Interstate Systems for Alaska and Puerto Rico are not required to meet this standard. For Alaska and Puerto Rico, the requirement is that construction is adequate for current and probable future traffic demands and the needs of the locality. In Alaska, 1,034 miles of rural Interstate are not required to have a minimum of four lanes and full access control. For urban Interstates, 104 miles do not meet the specified criteria for access control; 53 of these miles are in Puerto Rico and the remaining miles are in Alaska.
Bridge Age and Conditions
Exhibit 11-8 shows that, of the bridges currently on the Interstate highway system, approximately 17.4 percent were constructed during the 1950s, 44.0 percent were constructed during the 1960s and 20.0 percent were constructed during the 1970s. Since such a large percentage of these bridges are in approximately the same period in their service lives, this poses a challenge for long-term strategies relating to the rehabilitation or replacement of Interstate bridges. Future spending may be more variable over time than would be the case for bridges on other functional classes, which were constructed more evenly over time.
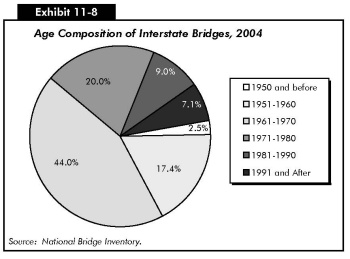
Exhibit 11-9 shows that approximately 15.9 percent of all rural Interstate bridges were deficient in 2004, including 1,163 that were structurally deficient (about 4.2 percent of the total number) and 3,224 that were functionally obsolete (11.7 percent of the total number). Among rural functional systems, the rural Interstate System had the lowest percentage of structurally deficient bridges and the lowest number of functionally obsolete bridges and deficient bridges (comparable data for other functional systems can be found in the "Rural and Urban Deficient Bridges by Functional Classification" section in Chapter 3).
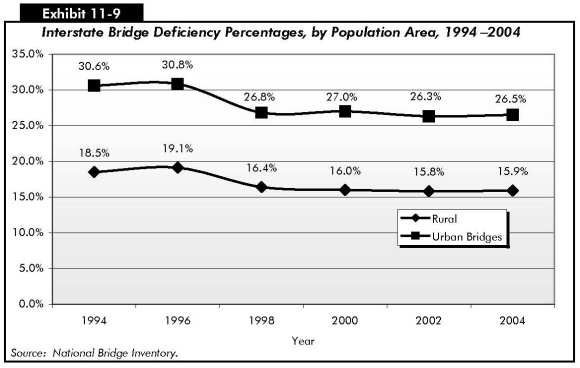
Approximately 26.5 percent of all urban Interstate bridges were deficient in 2004. This included 1,667 structurally deficient bridges (6.0 percent of total urban Interstate bridges) and 5,617 functionally obsolete bridges (20.5 percent of the total). Among urban functional systems, the Interstate System had the lowest percentage of deficient bridges.
The percentage of deficient bridges has steadily declined in recent years. In 1994, for example, 18.5 percent of rural Interstate bridges were deficient. That percentage had declined to 15.9 percent by 2004. The percentage of deficient urban Interstate bridges also declined, from 30.6 percent in 1994 to 26.5 percent in 2004.
The FHWA also looks at bridge deficiencies by the percentage of deficient deck area. Approximately 17.9 percent of the rural Interstate bridge deck area was deficient in 1996. This has decreased to 15.7 percent in 2004. The percentage of deficient deck area on urban Interstate bridges decreased from 34.2 percent in 1996 to 31.8 percent in 2004.
Exhibit 11-10 shows the number of Interstate bridges built by time period and the percentage of such bridges that are structurally deficient or functionally obsolete. Among the time periods shown, the highest percentage of deficiencies is on bridges constructed between 1911 and 1920; of the five Interstate bridges, one is structurally deficient and two are functionally obsolete; thus, the total percentage of deficient bridges is 60.0 percent. Of the bridges built between 1951 and 1960, 33.0 percent are either structurally deficient or functionally obsolete. This percentage falls to 24.0 percent for bridges built from 1961 to 1970, to 13.0 percent for bridges built from 1971 to 1980, to 12.7 percent for bridges built from 1981 to 1990, to 7.2 percent for bridges built from 1991 to 2000. None of the 886 bridges constructed from 2001 to 2004 are currently structurally deficient or functionally obsolete.
| Time Period | Number of Interstate Bridges Built | Percent Structurally Deficient | Percent Functionally Obsolete | Total Percent Deficient |
|---|---|---|---|---|
| <= 1900 | 6 | 0.0% | 16.7% | 16.7% |
| 1901-1910 | 3 | 0.0% | 33.3% | 33.3% |
| 1911-1920 | 5 | 20.0% | 40.0% | 60.0% |
| 1921-1930 | 114 | 12.3% | 25.4% | 37.7% |
| 1931-1940 | 524 | 6.3% | 18.3% | 24.6% |
| 1941-1950 | 754 | 6.6% | 24.0% | 30.6% |
| 1951-1960 | 9,597 | 8.0% | 25.1% | 33.0% |
| 1961-1970 | 24,314 | 6.1% | 17.9% | 24.0% |
| 1971-1980 | 11,084 | 3.7% | 9.3% | 13.0% |
| 1981-1990 | 5,001 | 1.1% | 11.5% | 12.7% |
| 1991-2000 | 3,013 | 0.4% | 7.2% | 7.7% |
| 2001-2004 | 886 | 0.0% | 0.0% | 0.0% |
| Not Reported | 14 | 7.1% | 28.6% | 35.7% |
| Total | 55,315 | 5.1% | 16.1% | 21.2% |
Safety Performance
Exhibits 11-11 and 11-12 describe the number of fatalities and the fatality rate for Interstates between 1995 and 2004. While the number of fatalities has increased on both rural and urban Interstates, these roads are still safer on average than those in other functional classes. The fatality rate on rural Interstates has remained lower than any other rural functional class, and the fatality rate on the urban Interstate System has remained the lowest of any functional class. More detailed information about highway safety can be found in Chapter 5.
| 1995 | 1997 | 2000 | 2002 | 2004 | |
|---|---|---|---|---|---|
| Rural Interstates | 2,658 | 3,040 | 3,254 | 3,298 | 3,246 |
| Urban Interstates | 2,177 | 2,292 | 2,419 | 2,482 | 2,516 |
For the period from 1995 to 2004, the rural Interstate fatality rate has been almost double that of the urban Interstate System. This is consistent with the statistics presented in Chapter 5, which showed that fatality rates are generally higher in rural areas.
| 1995 | 1997 | 2000 | 2002 | 2004 | |
|---|---|---|---|---|---|
| Rural Interstates | 1.18 | 1.28 | 1.21 | 1.17 | 1.21 |
| Urban Interstates | 0.63 | 0.63 | 0.61 | 0.60 | 0.55 |
Finance
All levels of government spent $15.5 billion for capital improvements on Interstate highways and bridges in 2004, which constituted 22.0 percent of the $70.3 billion of capital outlay on all functional classes. Exhibit 11-13 categorizes this total by type of improvement. System rehabilitation expenditures constituted 51.3 percent of total capital spending on Interstates, system expansion 41.4 percent, and system enhancement 7.3 percent. (See the "Capital Outlay by Improvement Type" section in Chapter 6 for definitions of these three broad categories of improvement types).
| Total Invested (Billions of Dollars) | Percent of Total Interstate | Percent of Total for all Functional Classes | |||||
|---|---|---|---|---|---|---|---|
| Rural | Urban | Total | Rural | Urban | Total | ||
| System Rehabilitation | |||||||
| Highway | $2.1 | $2.9 | $5.0 | 32.2% | 8.0% | 11.2% | 19.2% |
| Bridge | $0.5 | $2.5 | $3.0 | 19.2% | 4.6% | 23.9% | 28.5% |
| Subtotal | $2.6 | $5.4 | $8.0 | 51.3% | 7.0% | 14.9% | 21.9% |
| System Expansion | |||||||
| Additions to Existing Roadways | $0.9 | $2.1 | $3.1 | 19.8% | 7.2% | 16.7% | 24.0% |
| New Routes | $0.6 | $2.5 | $3.1 | 20.1% | 4.9% | 19.0% | 23.9% |
| New Bridges | $0.1 | $0.2 | $0.2 | 1.5% | 3.8% | 10.9% | 14.6% |
| Subtotal | $1.6 | $4.8 | $6.4 | 41.4% | 5.9% | 17.5% | 23.4% |
| System Enhancements | $0.3 | $0.8 | $1.1 | 7.3% | 4.8% | 13.0% | 17.8% |
| Total Investment | $4.5 | $11.0 | $15.5 | 100.0% | 6.4% | 15.7% | 22.1% |
Capital investment on Interstate highways decreased slightly between 2002 and 2004, falling 9.2 percent; total capital investment on all functional classes rose by only 3.1 percent. Exhibit 11-14 shows that rural Interstate spending fell by 32.1 percent between these 2 years, driven by decreases of 60.9 percent in rural Interstate bridge system rehabilitation and 43.0 percent in system expansion involving rural Interstate widening.
It is important to note that, for a particular functional class (such as rural Interstates) and a particular type of capital improvement (such as the bridge component of system rehabilitation), year-to-year spending is much more variable than for total capital investment of all types and can be more easily affected by large individual projects that happen to have a high level of cash outlays in a given year. It would be premature to suggest that the changes in expenditure patterns observed between 2002 and 2004 represent a long-term trend. This comparison is included primarily to help put into perspective the comparisons of 2004 spending with the future capital investment scenarios discussed later in this chapter.
| 2002 (Billions of Dollars) | 2004 (Billions of Dollars) | Percent Change 2004 Versus 2002 | |||||||
|---|---|---|---|---|---|---|---|---|---|
| Rural | Urban | Total | Rural | Urban | Total | Rural | Urban | Total | |
| System Rehabilitation | |||||||||
| Highway | $2.8 | $3.1 | $5.9 | $2.1 | $2.9 | $5.0 | -25.6% | -6.2% | -15.4% |
| Bridge | $1.2 | $1.9 | $3.2 | $0.5 | $2.5 | $3.0 | -60.9% | 28.4% | -6.1% |
| Subtotal | $4.0 | $5.1 | $9.1 | $2.6 | $5.4 | $8.0 | -36.3% | 7.1% | -12.1% |
| System Expansion | |||||||||
| Additions to Existing Roadways | $1.6 | $2.0 | $3.7 | $0.9 | $2.1 | $3.1 | -43.0% | 6.1% | -15.8% |
| New Routes | $0.5 | $2.2 | $2.7 | $0.6 | $2.5 | $3.1 | 18.0% | 14.7% | 15.3% |
| New Bridges | $0.0 | $0.2 | $0.2 | $0.1 | $0.2 | $0.2 | 195.0% | 8.9% | 30.2% |
| Subtotal | $2.2 | $4.3 | $6.5 | $1.6 | $4.8 | $6.4 | -25.8% | 10.5% | -1.7% |
| System Enhancements | $0.4 | $1.1 | $1.5 | $0.3 | $0.8 | $1.1 | -22.8% | -25.4% | -24.7% |
| Total Investment | $6.6 | $10.5 | $17.1 | $4.5 | $11.0 | $15.5 | -32.1% | 5.1% | -9.2% |
Future Capital Investment and Performance
Exhibits 7-2 and 7-3 in Chapter 7 show the estimated average annual Maximum Economic Investment for Highways and Bridges (Cost to Improve) and the Cost to Maintain Highways and Bridges for 2005–2024, categorized by functional class and improvement type. For the "Cost to Maintain" scenario, the portion of the estimated investment on Interstates totals $4.0 billion for rural and $18.2 billion for urban. These amounts are 5.1 and 23.1 percent, respectively, of the total Cost to Maintain Highways and Bridges. At this level of investment, average user costs on all highways in 2024 would be maintained at their 2004 levels. User costs would increase on some sections and functional classes and would decrease on others. In the case of Interstate highways, average user costs in both urban and rural areas would decrease.
For the "Maximum Economic Investment" scenario, the investment scenario estimates for rural and urban Interstates total $5.5 billion (4.2 percent of total) and $29.8 billion (22.6 percent of the total), respectively. This represents the highest level of capital expenditures that could be attained while investing only in improvements that are cost-beneficial. See Chapter 7 and Appendix A for more on the investment analysis methodology used in this report.
Exhibits 11-15 through 11-18 show the impacts of different levels of future capital spending on the physical conditions and operational performance of rural and urban Interstates. The first line in each exhibit shows current values for each of the measures, and the second line corresponds to the maximum economic efficiency level of investment. All investment levels are in constant 2004 dollars.
Exhibits 11-15 and 11-17 show the impact of different levels of combined highway rehabilitation and expansion spending on pavement condition, for rural and urban Interstates, respectively. Exhibits 11-16 and 11-18 show the impact of these same outlays on measures of operational performance for rural and urban Interstates, respectively. Highway rehabilitation and system expansion investments are modeled by the Highway Economic Requirements System (HERS) (see Appendix A).
Expenditures on system enhancement (including traffic operational improvements, safety improvements, and environmental enhancements) are not directly modeled and are not included in the totals shown in the exhibits. Bridge rehabilitation investments are discussed separately below.
Rural Interstates
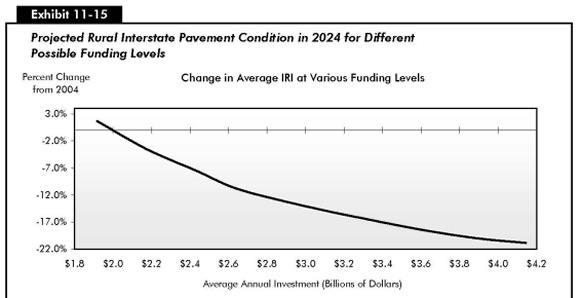
Exhibit 11-15 shows projected values for average IRI, a measure of average pavement ride quality, and the percentage of VMT at an IRI below 95 and below 170. As indicated earlier in this chapter, these two levels are used to define good and acceptable levels of pavement ride quality. The exhibit shows that the 2004 rehabilitation and expansion investment level of $3.7 billion on rural highways is only slightly below the maximum economic investment level of $4.1 billion estimated by HERS.
| Average Annual Highway Rehabilitation + Expansion Investment (Rural Interstates) (Billions of 2004 Dollars) |
Percent Change in Average IRI |
Percent of VMT on Roads with IRI<95 IRI<170 |
Funding Level Description: Investment Required to... |
|
|---|---|---|---|---|
| $3.7 | 74.0% | 97.6% | 2004 Values | |
| $4.1 | -20.9% | 88.9% | 100.0% | |
| $3.9 | -20.0% | 88.5% | 100.0% | |
| $3.6 | -18.4% | 87.9% | 99.9% | |
| $3.3 | -16.6% | 86.3% | 99.9% | |
| $3.1 | -15.0% | 84.5% | 99.9% | |
| $2.8 | -12.4% | 81.3% | 99.8% | |
| $2.6 | -10.4% | 78.5% | 99.7% | |
| $2.4 | -7.5% | 74.8% | 99.5% | ...Maintain VMT with IRI<95 |
| $2.2 | -3.4% | 70.0% | 99.2% | ...Maintain Average IRI |
| $1.9 | 1.7% | 64.3% | 98.6% | |
If current funding levels were sustained, and the mix of highway rehabilitation and widening investments recommended by HERS were implemented, then average IRI would be projected to improve by more than 18.4 percent over 20 years, and the percentage of travel on roads with good ride quality would rise to over 88 percent. Virtually all travel on rural Interstates would occur on roads with at least acceptable ride quality. The annual level of funding required to maintain average IRI at its 2004 level is between $1.9 billion and $2.2 billion.
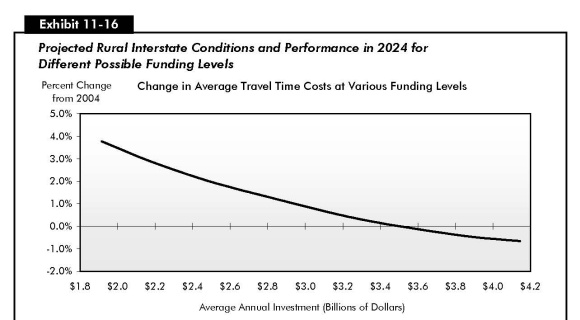
Exhibit 11-16 shows how future values for average delay per VMT (discussed in Chapter 9), total user costs, and travel time costs on rural Interstates would be affected by different levels of highway rehabilitation and expansion investment. Average user costs on rural Interstates would be maintained at an average annual investment level of $2.4 billion, while average travel time costs would increase by 2.2 percent at that funding level. If current funding levels were sustained, and the mix of highway rehabilitation and widening investments recommended by HERS were implemented, then reductions could be achieved in both average total user costs and average travel time costs.
Average delay on rural Interstates would be maintained at an investment level between $2.8 billion and $3.1 billion and would decline by over 13 percent at 2004 rehabilitation and expansion expenditure levels. It should be noted, however, that average delay on rural Interstates is a small fraction of that on urban Interstates and is overwhelmingly related to incident delay. Thus, the large percentage changes in rural delay at different funding levels indicated in Exhibit 11-16 are not as significant as they may appear.
| Average Annual Highway Rehabilitation + Expansion Investment (Rural Interstates) (Billions of 2004 Dollars) |
Percent Change in | Funding Level Description: Investment Required to... |
||
|---|---|---|---|---|
| Average Total Delay |
Total User Costs | Travel Time Costs | ||
| $3.7 | 2004 Values | |||
| $4.1 | -20.9% | -1.2% | -0.7% | |
| $3.9 | -17.8% | -1.1% | -0.5% | |
| $3.6 | -13.0% | -1.0% | -0.1% | ...Maintain Average Travel Time Costs |
| $3.3 | -7.7% | -0.8% | 0.2% | |
| $3.1 | -1.4% | -0.7% | 0.7% | ...Maintain Average Delay |
| $2.8 | 9.1% | -0.4% | 1.3% | |
| $2.6 | 15.5% | -0.2% | 1.7% | |
| $2.4 | 22.6% | 0.0% | 2.2% | ...Maintain Average User Costs |
| $2.2 | 34.6% | 0.5% | 2.9% | |
| $1.9 | 47.8% | 1.0% | 3.8% | |
Urban Interstates
Exhibits 11-17 and 11-18 show the impacts on the same measures of conditions and performance for different levels of capital spending on urban Interstates. Exhibit 11-17 shows that an average annual highway rehabilitation investment of between $9.3 billion and $10.6 billion would be required to maintain average IRI at 2004 levels. As with rural Interstates, the percentage of travel on urban Interstate pavements with good or acceptable ride quality would increase at this level of investment.
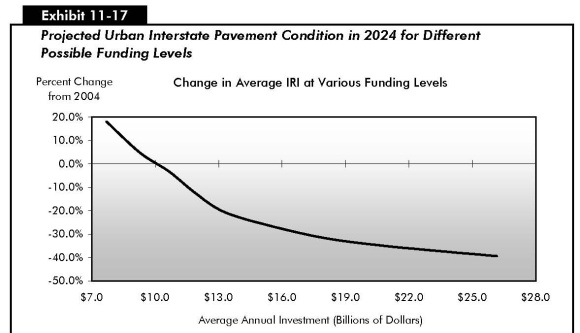
| Average Annual Highway Rehabilitation + Expansion Investment (Urban Interstates) (Billions of 2004 Dollars) |
Percent Change in Average IRI |
Percent of VMT on Roads with IRI<95 IRI<170 |
Funding Level Description: Investment Required to... |
|
|---|---|---|---|---|
| $7.7 | 49.5% | 89.8% | 2004 Values | |
| $26.2 | -39.4% | 95.0% | 99.6% | |
| $23.1 | -37.0% | 93.0% | 99.4% | |
| $20.6 | -34.7% | 91.0% | 98.7% | |
| $18.0 | -31.8% | 88.1% | 98.1% | |
| $15.6 | -26.9% | 84.2% | 97.0% | |
| $13.3 | -20.5% | 79.0% | 95.8% | |
| $11.8 | -12.1% | 75.2% | 94.5% | |
| $10.6 | -3.2% | 70.7% | 92.4% | ...Maintain Average IRI |
| $9.3 | 4.7% | 66.6% | 90.4% | ...Maintain VMT with IRI<170 |
| $7.7 | 18.1% | 59.8% | 87.4% | |
If current funding levels were sustained, and the mix of highway rehabilitation and widening investments recommended by HERS were implemented, then average IRI on urban Interstates would be expected to worsen by 18.1 percent, and the percent of VMT on roads with acceptable ride quality would fall slightly, to 87.4 percent. The results suggest that a substantial increase in urban Interstate investment would be necessary to prevent average pavement condition on urban Interstates from deteriorating in the future.
Exhibit 11-18 indicates that an average annual investment level in highway rehabilitation and capacity expansion of between $11.8 billion and $13.3 billion would be needed to maintain average delay on urban Interstates. Total user costs would be maintained at investment levels of about $10.6 billion, and travel time costs on urban Interstates would be maintained at funding levels of about $13.3 billion. These amounts are significantly higher than the comparable 2004 funding level of $7.7 billion. The results suggest that, if average annual funding were maintained (in constant dollars) at 2004 levels through 2024, average delay on urban Interstates would increase by 31 percent, total user costs would increase by 4.4 percent, and travel time costs would increase by 12.1 percent.
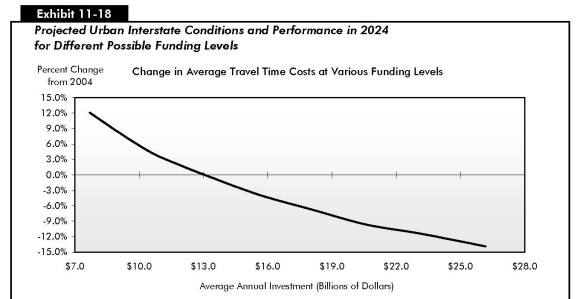
| Average Annual Highway Rehabilitation + Expansion Investment (Urban Interstates) (Billions of 2004 Dollars) |
Percent Change in | Funding Level Description: Investment Required to... |
||
|---|---|---|---|---|
| Average Total Delay |
Total User Costs | Travel Time Costs | ||
| $7.7 | 2004 Values | |||
| $26.2 | -44.6% | -11.1% | -13.9% | |
| $23.1 | -36.5% | -9.8% | -11.4% | |
| $20.6 | -31.1% | -8.9% | -9.7% | |
| $18.0 | -21.2% | -7.3% | -6.7% | |
| $15.6 | -12.6% | -5.7% | -3.9% | |
| $13.3 | -1.8% | -3.6% | -0.3% | ...Maintain Avg Delay and Avg Travel Time Costs |
| $11.8 | 3.6% | -2.0% | 2.0% | |
| $10.6 | 8.6% | -0.6% | 4.2% | ...Maintain Average User Costs |
| $9.3 | 18.5% | 1.5% | 7.6% | |
| $7.7 | 31.0% | 4.4% | 12.1% | |
Bridge Rehabilitation and Replacement
As described in Chapter 7, the National Bridge Investment Analysis System (NBIAS) model analyzes rehabilitation and replacement investment for all bridges, including those on Interstates. The current Interstate bridge investment backlog is estimated at $19.1 billion.
Exhibit 11-19 describes what the Interstate bridge backlog after 20 years would be at different funding levels. An average annual investment in bridge rehabilitation and replacement of $2.0 billion would be required so that the Interstate bridge investment backlog would not increase above its current level over a 20-year period. An average annual investment of $2.9 billion would be sufficient to eliminate the existing Interstate bridge investment backlog and correct other deficiencies that are expected to develop over the next 20 years, where it is cost-beneficial to do so.
| (Billions of 2004 Dollars) | |
|---|---|
| Average Annual Investment | 2024 Interstate Bridge Backlog |
| $2.9 | $0.0 |
| $2.8 | $1.9 |
| $2.6 | $5.7 |
| $2.4 | $10.4 |
| $2.1 | $16.2 |
| $2.0 | $19.1 |
| $1.8 | $23.6 |
| $1.4 | $31.0 |
Exhibit 11-13 indicates that bridge rehabilitation expenditures on Interstates totaled $3.0 billion in 2004. Thus, if this level of funding were maintained in constant dollars over 20 years, NBIAS projects that the Interstate bridge backlog could be eliminated.
Current Spending and Future Investment
Exhibits 11-15 through 11-19 indicate that 2004 levels of highway rehabilitation and system expansion investment on rural Interstates are above the levels necessary to maintain conditions and performance in the future, although there remain significant opportunities for cost-beneficial improvements to the system. The 2004 level of rural and urban Interstate bridge investment would be adequate to address the economic backlog of bridge deficiencies, if that level of investment could be sustained.
On urban Interstates, significant increases in funding for rehabilitation and expansion above current levels would be required to prevent both average physical conditions and operational performance from becoming degraded.