


- Summary
- Highways and Bridges
- Transit
- Highway and Bridge Investment Scenarios
- Cost to Maintain Highways and Bridges
- Maximum Economic Investment for Highways and Bridges
- Investment Requirements by Improvement Type
- System Rehabilitation
- System Expansion
- System Enhancement
- Sources of the Highway and Bridge Investment Scenario Estimates
- External Adjustments
- Highway Economic Requirements System
- Linking Investment Scenarios and Revenue Sources HERS Investment Scenarios
- HERS Investment Scenarios
- Highway Investment Backlog
- National Bridge Investment Analysis System
- Bridge Investment Scenarios
- Bridge Investment Backlog
- Transit Investment Scenarios
- Costs to Maintain and Improve Conditions and Performance
- Investment Estimates by Population Area Size
- Investment Estimates by Asset Type
- Rural Transit Vehicles and Facilities
- Special Service Vehicles
- U.S. Federal Lands
- Transit Investment Backlog
- Summary of Revisions Since the 2004 C&P Report and Effects on Investment Estimates
- Costs to Maintain and Improve Conditions and Performance
Summary
Exhibit 7-1 compares the 20-year average annual investment scenario estimates in this report with those presented in the 2004 C&P report. The first column shows the projection for 2003 to 2022, based on 2002 data shown in the 2004 C&P report and stated in 2002 dollars. The second column restates these highway and transit values in 2004 dollars, to offset the effect of inflation. The third column shows new average annual investment scenario projections for 2005 to 2024 based on 2004 data.
| 2003–2022 Projection (Based on 2002 Data) |
2005–2024 Projection (Based on 2004 Data) |
||
|---|---|---|---|
| 2004 Report | Adjusted for Inflation | ||
| Average Annual Investment Scenario Estimates* | 2002 $ | 2004 $ | 2004 $ |
| Cost to Maintain | |||
| Highways and Bridges | $73.8 | $77.1 | $78.8 |
| Transit | $15.6 | $16.3 | $15.8 |
| Cost to Improve | |||
| Highways and Bridges (Maximum Economic Investment Level) | $118.9 | $124.1 | $131.7 |
| Transit | $24.0 | $25.1 | $21.8 |
Results for highways, bridges, and transit are presented for two key scenarios: one in which the status of the current system is maintained and one in which it is improved. However, the exact specifications of the scenarios differ for each mode. Investment scenario estimates for highways and bridges are drawn from the Highway Economic Requirements System (HERS), which estimates the highway rehabilitation and highway and bridge capacity expansion component of investment; the National Bridge Investment Analysis System (NBIAS), which analyzes future bridge rehabilitation and replacement investment; and external adjustments to reflect functional classes and improvement types not directly modeled. The transit investment estimates for urbanized area operators that report to the National Transit Database (NTD) are calculated by the Transit Economic Requirements Model (TERM). Estimates for rural and special services are derived separately from the number of vehicles, the percentage of overage vehicles, vehicle replacement costs, and actual and industry-recommended replacement ages.
This chapter focuses on the "Maintain" and "Improve" investment scenarios noted in Exhibit 7-1. The Introduction to Part II provides critical background information needed to properly interpret these figures. That section also discusses the development of the future investment scenario estimates and the motivation for using economic analysis as the basis for the estimates, as well as the role of uncertainty in the investment analysis modeling process and the relationship between pricing and investment analysis.
Chapter 9 includes an analysis of the projected impacts of these and other future investment levels on conditions and performance. Chapter 10 includes sensitivity analyses, showing how the investment scenario estimates would change under different assumptions about the values of key model parameters.
|
|
|
How would alternative assumptions affect the investment scenario estimates presented in this report?
The accuracy of these projections depends on the validity of the technical assumptions underlying the analysis. Chapter 10 explores the impacts of altering some of these assumptions, including the impacts of aggressive congestion reduction strategies; alternative model parameters and assumptions; and recent model enhancements.
One of the key assumptions in these projections is the continuation of current tax and fee structures. As pointed out in the Introduction to Part II of this report, any shifts in financing mechanisms that significantly alter the out-of-pocket costs incurred by individual users would have an effect on the scenario results. Chapter 10 includes a hypothetical analysis of the impact that universal congestion pricing could have on these estimates. While that analysis is itself limited by its scope and attendant assumptions, the results indicate that universal congestion pricing could have a significant impact on the investment scenario estimates. The Maximum Economic Investment for Highways and Bridges level would be reduced by 15.9 percent, while the projected Cost to Maintain Highways and Bridges would be reduced by 27.5 percent. See Chapter 10 for more information on this analysis.
|
Both the highway and transit analyses depend heavily on forecasts of future demand. Chapter 10 explores the effects that varying assumptions about future travel demand would have on the projections identified in Exhibit 7-1. That chapter also includes a hypothetical analysis of the impact that the universal adoption of congestion pricing could have on the investment scenario estimates, by more efficiently aligning the costs borne by highway travelers with those that they impose on the transportation system. Highway travel growth forecasts are also discussed in Chapter 9.
More information on the methodology used to develop the investment projections, including recent changes to the methodology, is contained in Appendices A, B, and C. Part IV of this report examines some fundamental data and analytical issues relating to the types of investment/performance analysis reflected in this chapter.
Highways and Bridges
The average annual Cost to Maintain Highways and Bridges is projected to be $78.8 billion from all sources for 2005 to 2024. Accounting for inflation between 2002 and 2004 (using FHWA's Construction Bid Price Index), this estimate is 2.3 percent greater than the "Cost to Maintain" for 2003 to 2022 reported in the 2004 C&P report. At this level of investment, future conditions and performance of the Nation's highway system would be maintained at a level sufficient to keep average highway user costs from rising above their 2004 levels. The average annual Maximum Economic Investment for ("Cost to Improve") highways and bridges is projected to be $131.7 billion for 2005 to 2024, which is 6.2 percent higher than the estimate in the 2004 C&P report for 2003 to 2022, again accounting for inflation. This figure represents an "investment ceiling" above which it would not be cost beneficial to invest.
|
|
|
What is the Federal share of the highway and transit investment scenario estimates presented in this report?
The investment scenario estimates presented in this report represent the projected levels of total capital investment that would be necessary to obtain certain outcomes. The question of what portion should be funded by the Federal government, State governments, local governments, or the private sector is outside the scope of this report.
Chapter 6 includes information on historic trends in public funding for highways and transit by different levels of government.
|
|
|
|
What about inflation since 2004?
The investment scenario estimates in this chapter are stated in constant 2004 dollars. This matches up with both the financial data reported in Chapter 6 and the base year for the highway and bridge data that was used in generating the estimates. However, there are many indications that highway construction costs increased significantly in 2005, above the rate of general inflation. The "Improvement Costs" section in Chapter 10 includes a sensitivity analysis describing the impact that a 25 percent increase in highway and bridge improvement costs would have on the investment scenario estimates.
|
The changes in the projected investment scenario levels from the 2004 report are attributable both to changes in the underlying characteristics, conditions, and performance of the highway system as reported in the available data sources, and to changes in the methodology and models used to generate the estimates. Notable HERS methodological changes include updated estimates of highway improvement costs, particularly in large urbanized areas. These new estimates, which are generally higher than those used previously, reflect the increasing complexity of implementing highway projects in large cities, which often require additional costs aimed at mitigating the impacts of improvements on the environment, communities, and current users of the roadways.
The other notable revision to the HERS methodology is the addition of a linkage between investment and the financing mechanisms used to pay for them. The model assumes that investment levels above current highway capital spending would be financed through increases in user charges. Such assumed increases have the effect of dampening travel demand growth, thereby limiting the amount of investment required to achieve a given level of performance. Further information on changes to HERS is found in Appendix A.
The increase in the Maximum Economic Investment for highways and bridges relative to the last report is also related to the fact that capital investment by all levels of government between 2002 and 2004 remained below the "Cost to Maintain" level. Consequently, the overall performance of the system declined, which increased the number of potentially cost-beneficial highway and bridge investments that would address these performance problems.
Transit
The estimated average annual "Cost to Maintain" transit asset conditions and operating performance is estimated to be $15.8 billion, compared with $15.6 billion in 2002 dollars presented in the last report. Eighty-seven percent of this transit investment is estimated to be in urban areas with populations of over 1 million, reflecting the fact that 92 percent of the Nation's passenger miles are currently in these areas. The average annual "Cost to Improve" both the physical condition of transit assets and transit operational performance to targeted levels by 2024 is estimated to be $21.8 billion, compared with $24.0 billion in 2000 dollars for the 2003 to 2022 period presented in the last report.
Fifty-eight percent of the total amount needed to maintain conditions and performance, or $9.0 billion dollars annually, and 60 percent of the total amount needed to improve conditions and performance, or $13.0 billion annually, are estimated to be for rail infrastructure. Guideway elements are estimated to require the largest amount of the total capital investment of all rail assets between 2005 and 2024, followed (in descending order of investment) by vehicles, systems, stations, and facilities.
Forty-three percent of the total amount needed to maintain conditions and performance, or $6.8 billion dollars annually, and 40 percent of the total amount needed to improve conditions and performance, or $8.8 billion annually, are estimated to be for nonrail infrastructure. Vehicles are estimated to require the largest amount of the total capital investment in nonrail assets between 2005 and 2024, followed (in descending order of investment) by facilities, guideway elements (dedicated lanes for buses), power systems, and stations.
Since the 2004 report, the asset inventory and asset deterioration information in TERM has been improved through special data collection efforts and engineering surveys. Ridership forecasts have been revised upward very slightly from 1.5 percent to 1.57 percent per year based on updated information collected from an expanded list of metropolitan planning organizations (MPOs). Changes in estimated investment reflect real changes in projected ridership, transit infrastructure size, and transit asset replacement costs. They also reflect improvements in the Federal Transit Administration's (FTA's) knowledge about the magnitude, deterioration, conditions, and replacement costs of these assets. The cost to improve conditions and performance declined largely due to a downward revision in congestion delay costs, which decreased the estimated amount required to improve performance.
Highway and Bridge Investment Scenario
This section presents the projected investment scenario estimates for highways and bridges for two primary performance targets. The "Cost to Maintain Highways and Bridges" scenario represents the annual investment necessary to maintain the current level of highway system performance. The "Maximum Economic Investment" scenario (Cost to Improve Highways and Bridges) identifies a level of investment that would allow system performance to be significantly improved in an economically justifiable manner. These investment levels illustrate two points on a continuum of alternative investment levels. Neither is endorsed as a target level of funding. The impacts of a wider range of alternative investment levels on various measures of system performance are shown in Chapter 9. Chapter 9 also explores recent trends in highway expenditures compared with recent changes in system performance.
The combined highway and bridge investment scenarios are drawn from the separately estimated scenarios for highways and for bridges, and from external adjustments to the two models. These scenarios are defined differently, owing to the different natures of the data sources and models used to develop them. However, it is useful to combine them, particularly when comparing them to current or projected investment levels, since amounts commonly referred to as "total highway spending" or "total highway capital outlay" include expenditures for both highways and bridges. Chapter 8 compares current highway and bridge spending with the investment levels under the two scenarios outlined in this section.
The average annual "Cost to Maintain Highways and Bridges" over the 20-year period 2005 to 2024 is projected to be $78.8 billion from all sources in 2004 dollars. The average annual "Maximum Economic Investment for Highways and Bridges" is projected to be $131.7 billion (also in 2004 dollars). See the Introduction to Part II for a discussion of the implications of these scenarios and critical caveats that should be considered in interpreting them.
As described in the "Financing Mechanisms and Investment Analysis" section in the Introduction to Part II, a significant change that has been made for this report is the linkage of the analysis of highway investment to funding mechanisms that might be used to finance such investment levels. The scenarios assume that any increases in investment above base year levels would be financed through increases in user charges, one of the primary mechanisms currently used to fund highway investment in the United States. The analysis assumes that, by raising the out-of-pocket costs of highway travel to users, these increased charges would also reduce the demand for use of the system, thereby reducing the amount of additional investment that would be needed to achieve a given level of condition and performance, or to exhaust all cost-beneficial investments.
While the baseline scenarios presented in this chapter assume the continuation of current tax and fee structures, any shifts in financing mechanisms that significantly alter the out-of-pocket costs incurred by individual users would have an effect on these results. This concept is discussed in more detail in the "Congestion Pricing and Investment Analysis" section in the Introduction to Part II. Chapter 10 includes a hypothetical analysis of the impact that universal congestion pricing could have on these estimates, as well as a discussion of the impact that the linkage between financing and investment has on the results.
Finally, it should be noted that the accuracy of these projections depends on the validity of the technical assumptions underlying the analysis. Chapter 10 explores the impacts of altering some of these assumptions.
Cost to Maintain Highways and Bridges
Exhibit 7-2 shows the average annual "Cost to Maintain Highways and Bridges" by type of improvement and functional class. The component of investment on urban arterials and collectors under this scenario totals $49.7 billion, or 63.1 percent of the average annual "Cost to Maintain Highways and Bridges." Investment on rural arterials and collectors under this scenario totals $17.6 billion (22.4 percent), while the rural and urban local roads and streets component totals $11.5 billion (14.6 percent).
| System Rehabilitation | ||||||
|---|---|---|---|---|---|---|
| Functional Class | Highway | Bridge | Total | System Expansion | System Enhancement | Total |
| Rural Arterials & Collectors | ||||||
| Interstate | $1.5 | $0.6 | $2.1 | $1.6 | $0.3 | $4.0 |
| Other Principal Arterial | 1.8 | 0.7 | 2.5 | 0.9 | 0.7 | 4.1 |
| Minor Arterial | 1.6 | 0.7 | 2.3 | 0.4 | 0.4 | 3.0 |
| Major Collector | 3.0 | 1.0 | 4.1 | 0.4 | 0.4 | 4.9 |
| Minor Collector | 0.8 | 0.4 | 1.2 | 0.3 | 0.2 | 1.6 |
| Subtotal | $8.7 | $3.4 | $12.1 | $3.6 | $2.0 | $17.6 |
| Urban Arterials & Collectors | ||||||
| Interstate | $4.3 | $1.6 | $6.0 | $11.3 | $0.9 | $18.2 |
| Other Freeway & Expressway | 2.0 | 0.6 | 2.6 | 5.3 | 0.7 | 8.7 |
| Other Principal Arterial | 4.4 | 0.9 | 5.3 | 3.9 | 1.0 | 10.2 |
| Minor Arterial | 4.5 | 0.6 | 5.1 | 3.0 | 0.7 | 8.9 |
| Collector | 1.9 | 0.3 | 2.1 | 1.2 | 0.5 | 3.8 |
| Subtotal | $17.2 | $4.0 | $21.1 | $24.7 | $3.9 | $49.7 |
| Rural and Urban Local | $6.0 | $1.4 | $7.4 | $2.8 | $1.3 | $11.5 |
| Total | $31.9 | $8.7 | $40.7 | $31.0 | $7.1 | $78.8 |
The "Cost to Maintain Highways and Bridges" scenario combines the "Maintain User Costs" scenario from HERS and the "Maintain Economic Backlog" scenario from NBIAS with external adjustments to the estimates produced by the two models.
Maximum Economic Investment for Highways and Bridges
The average annual "Maximum Economic Investment for Highways and Bridges" is broken down by functional class and type of improvement in Exhibit 7-3. The component of investment on urban arterials and collectors total $84.5 billion, or 64.1 percent of the total average annual "Maximum Economic Investment for Highways and Bridges." Investment on rural arterials and collectors under this scenario totals $28.2 billion (or 21.4 percent of the total), while the rural and urban local roads and streets component totals $19.0 billion (14.5 percent).
This scenario combines the "Maximum Economic Investment" scenarios from HERS and NBIAS with external adjustments to the two models.
| System Rehabilitation | ||||||
|---|---|---|---|---|---|---|
| Functional Class | Highway | Bridge | Total | System Expansion | System Enhancement | Total |
| Rural Arterials & Collectors | ||||||
| Interstate | $2.0 | $0.8 | $2.7 | $2.2 | $0.6 | $5.5 |
| Other Principal Arterial | 3.0 | 1.1 | 4.0 | 1.2 | 1.1 | 604 |
| Minor Arterial | 3.3 | 1.0 | 4.2 | 0.8 | 0.7 | 5.7 |
| Major Collector | 5.0 | 1.6 | 6.5 | 0.8 | 0.6 | 7.9 |
| Minor Collector | 1.4 | 0.6 | 1.9 | 0.5 | 0.3 | 2.7 |
| Subtotal | $14.6 | $4.9 | $19.5 | $5.5 | $3.3 | $28.2 |
| Urban Arterials & Collectors | ||||||
| Interstate | $5.3 | $2.1 | $7.4 | $20.8 | $1.6 | $29.8 |
| Other Freeway & Expressway | 2.6 | 0.7 | 3.3 | 1.07 | 1.2 | 15.2 |
| Other Principal Arterial | 7.4 | 1.3 | 8.6 | 8.4 | 1.6 | 18.7 |
| Minor Arterial | 5.8 | 0.9 | 6.7 | 6.4 | 1.2 | 14.4 |
| Collector | 2.8 | 0.4 | 3.2 | 2.4 | 0.8 | 6.4 |
| Subtotal | $24.0 | $5.3 | $29.3 | $48.7 | $6.5 | $84.5 |
| Rural and Urban Local | $10.1 | $2.2 | $12.2 | $4.6 | $2.2 | $19.0 |
| Total | $48.6 | $12.4 | $61.0 | $58.8 | $11.9 | $131.7 |
Investment Scenario Estimates by Improvement Type
Exhibits 7-2 and 7-3 also show the investment scenario estimates by type of improvement. The investment levels are classified into three categories (defined in Chapter 6): system rehabilitation, system expansion, and system enhancement. System rehabilitation, as defined in this report, consists of capital investment focused on preserving the condition of the pavement and bridge infrastructure. This includes the costs of resurfacing and reconstructing highways and repairing and replacing bridges, but does not include routine maintenance costs. Note that previous editions of the C&P report used the term "system preservation" for this type of investment. However, because, this term is increasingly being used for maintenance activities aimed at prolonging the life of the existing infrastructure, it has been replaced in this report by "rehabilitation," which is more directly indicative of the nature of these activities as capital investments.
System expansion includes the costs related to increasing system capacity by widening existing facilities or adding new roads and bridges. System enhancement includes targeted safety enhancements, traffic control improvements, and environmental improvements. Appendix A describes how the investment modeled by HERS and NBIAS was allocated among the three types of improvements.
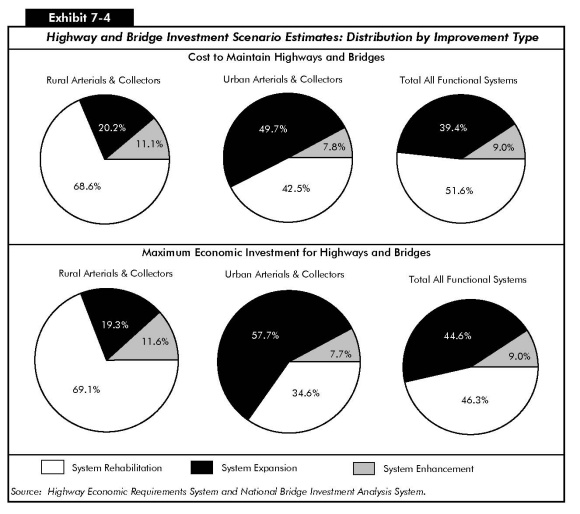
Exhibit 7-4 displays the investment scenario estimates by improvement type for rural and urban areas for each scenario.
System Rehabilitation
Average annual investment in system rehabilitation is estimated to be $40.7 billion under the "Cost to Maintain" scenario and $61.0 billion under the "Maximum Economic Investment" scenario. These totals constitute 51.6 and 46.3 percent, respectively, of the totals for the two scenarios. Exhibits 7-2 and 7-3 also indicate that bridge repair and replacement investments represent roughly 20 percent of total system rehabilitation investment under each scenario. As shown in Exhibit 7-4, system rehabilitation makes up a much larger share of total investment in rural areas than in urban areas under each scenario.
System Expansion
The $31.0 billion in average annual investment for system expansion represents 39.4 percent of the total "Cost to Maintain Highways and Bridges" scenario. Comparable figures for the "Maximum Economic Investment" scenario are $58.8 billion and 44.6 percent. Exhibits 7-2 through 7-4 indicate that system expansion investment under each scenario is much larger in urban areas than in rural areas, both in the total amount and as a share of overall investment.
|
|
|
Can highway capacity be expanded without building new roads and bridges or adding new lanes to existing facilities?
Yes. The "system expansion" investment levels identified in Exhibits 7-2 and 7-3 reflect a need for a certain amount of effective highway capacity, which could be met by traditional expansion or by other means. In some cases, effective highway capacity can be increased by improving the utilization of the existing infrastructure rather than by expanding it. The investment scenario estimates presented in this edition of the report consider the impact of some of the most significant operations strategies and deployments on highway system performance. The capital investment costs associated with these strategies are included in the estimates of highway capacity investment presented in this chapter. Operations strategies are further discussed in Chapter 15.
The methodology used to estimate the system expansion component of the investment scenarios also allows high-cost capacity improvements to be considered as an option for segments with high volumes of projected future travel, but have been coded by States as infeasible for conventional widening. Such improvements constitute 9 percent of the total lane miles of additional capacity required under the "Maintain" scenario, but 38 percent of the total costs. Under the "Maximum Economic Investment" scenario, high-cost improvements represent 14 percent of added lane miles and 55 percent of total capacity investment. Conceptually, such improvements might consist of new highways or bridges in the same corridor (or tunneling or double-decking on an existing alignment), but the capacity upgrades could also come through other transportation improvements, such as a parallel fixed-guideway transit line or mixed-use, high-occupancy vehicle/bus lanes.
|
System Enhancement
Investment for system enhancement represents 9.0 percent of both the "Cost to Maintain Highways and Bridges" ($7.1 billion) and the "Maximum Economic Investment for Highways and Bridges" ($11.9 billion) scenarios. Investment in safety enhancements, traffic control facilities, and environmental enhancements are not directly modeled, so this amount was derived solely from the external adjustment procedures described below.
Sources of the Highway and Bridge Investment Scenario Estimates
The investment scenario estimates for highways and bridges under the "Maintain" and "Improve" scenarios were derived from three sources:
- Highway and bridge capacity expansion and highway resurfacing and reconstruction improvements were modeled using HERS.
- Bridge repair and replacement investments were modeled using NBIAS.
- The HERS and NBIAS results were supplemented by external adjustments made to account for functional classes not included in the data sources used by the models and types of capital investment that are not currently modeled.
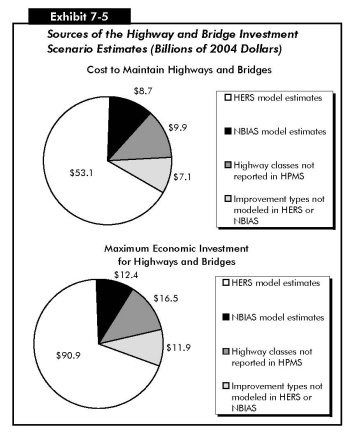
The model scenarios used in HERS and NBIAS to construct the "Maintain" and "Improve" scenarios are discussed in greater detail below. Exhibit 7-5 shows the sources of the highway and bridge investment scenario estimates.
External Adjustments
External adjustments were made to the directly modeled improvements generated by HERS and NBIAS in two areas:
Highway functional classes. Bridges on all functional classes are represented in the National Bridge Inventory (NBI) database used by NBIAS, so all of the investment scenario estimates related to bridge rehabilitation shown in this report are derived directly from NBIAS. However, the Highway Performance Monitoring System (HPMS) sample segment database used by HERS does not include rural minor collectors, rural local roads, or urban local roads. Consequently, HERS does not provide estimates for these systems, and separate estimates for highway resurfacing/reconstruction and system expansion were applied.
Improvement types. The improvement options that HERS and NBIAS consider primarily address pavement and capacity deficiencies on existing highway and bridge sections. Currently, HERS and NBIAS do not directly model investment in system enhancement. Estimates for this improvement type were applied across all functional classes.
The adjustment procedures assume that the share of the highway investment scenario estimates represented by these functional classes and improvement types would be equivalent to their share of current highway capital spending. The amounts derived from these external adjustments are identified separately in this report because they would be expected to be less reliable than those derived from HERS and NBIAS.
|
|
|
Why does the analysis assume that the share of the future highway investment scenario estimates for non-modeled items would match their share of current spending?
No data are currently available that would justify an assumption that the percentage of capital spending devoted to these investments would (or should) change in the future. In the absence of such data, it is thus reasonable to assume that their share of future investment under each scenario would approximate their share of current spending.
|
The percentage of the total investment scenario estimates that are modeled in HERS and NBIAS in this report is approximately the same as it was in the 2004 C&P report.
|
|
|
Do the adjustments for non-modeled items reflect highway-rail grade separation improvements?
Highway-rail grade separation improvements are at least partially captured in the adjustments made for non-modeled capital investments, which include safety enhancements. However, the analysis may not fully capture separation improvements that are aimed primarily at reducing highway user delay. The 2004 C&P report summarized the results of an analysis prepared by the Federal Railroad Administration which looked at the potential impacts of alternative future levels of investment in grade separation improvements. [See Chapter 19 of the 2004 C&P report for details.]
|
Highway Economic Requirements System
The investment scenario estimates shown in this report for highway resurfacing and reconstruction and highway and bridge capacity expansion are developed primarily from HERS, a simulation model that employs incremental benefit cost analysis to evaluate highway improvements. The HERS analysis is based on data from the HPMS, which provides information on current roadway characteristics, conditions, and performance and anticipated future travel growth for a nationwide sample of more than 116,000 highway sections. While HERS analyzes these sample sections individually, the model is designed to provide results valid at the national level, and does not provide definitive improvement recommendations for individual highway segments.
|
|
|
Does HERS identify a single "correct" level of highway investment?
No. The HERS model is a tool for estimating what the consequences may be of various levels of spending on highway conditions and performance. If funding were unlimited, it might make sense to implement all projects identified by HERS as cost beneficial. In reality, however, funding is constrained, and highways must compete for funding with other economic priorities. The investment scenarios in this chapter estimate the resources that would be required to attain certain levels of performance, but are not intended to endorse any specific level of funding as "correct" or "optimal."
|
The HERS model analyzes highway investment by first evaluating the current state of the highway system using information on pavements, geometry, traffic volumes, vehicle mix, and other characteristics from the HPMS sample dataset. It then considers potential improvements on sections with one or more deficiencies, including resurfacing, reconstruction, alignment improvements, and widening or adding travel lanes. HERS then selects the improvement with the greatest net benefits, where benefits are defined as reductions in direct highway user costs, agency costs, and societal costs. In cases where none of the potential improvements produces benefits exceeding construction costs, the segment is not improved. Appendix A contains a more detailed description of the project selection and implementation process used by HERS.
|
|
|
How closely does the HERS model simulate the actual project selection processes of State and local highway agencies?
The HERS model is intended to approximate, rather than replicate, the decision processes used by State and local governments. HERS does not have access to the full array of information that local governments would use in making investment decisions. This means that the model results may include some highway and bridge improvements that simply are not feasible because of factors the model doesn't consider, such as political issues or other practical impediments. Excluding such projects would result in reducing the "true" level of investment that is economically justifiable. Conversely, the highway model assumes that State and local project selection will be economically optimal and doesn't consider external factors such as the distribution of projects among the States or within each State. In actual practice, projects are not selected solely on the basis of their benefit-cost ratios; there are other important factors included in the project selection process aside from economic considerations. Thus, the "true" level of investment that would achieve the outcome desired under the scenarios could be higher than that shown in this report.
|
One of the key economic analysis features of HERS involves its treatment of travel demand. Recognizing that drivers will respond to changes in the relative price of driving and adjust their behavior accordingly, HERS explicitly models the relationship between the amount of highway travel and the price of that travel. This concept, sometimes referred to as travel demand elasticity, is applied to the forecasts of future travel found in the HPMS sample data. The HERS model assumes that the forecasts for each sample highway segment represent a future in which average conditions and performance are maintained, thus holding highway user costs at current levels. Any change in user costs relative to the initial conditions calculated by HERS will thus have the effect of either inducing or suppressing future travel growth on each segment. Consequently, for any highway investment scenario that results in a decline in average user costs, the effective vehicle miles traveled (VMT) growth rate for the overall system will tend to be higher than the baseline rate derived from HPMS. For scenarios in which highway user costs increase, the effective VMT growth rate will tend to be lower than the baseline rate. A discussion of the impact that future investment levels could be expected to have on future travel growth is included in Chapter 9.
While HERS was primarily designed to analyze highway segments, and the HERS outputs are described as "highway" investments in this report, the model also factors in the costs of expanding bridges and other structures when deciding whether to add lanes to a highway segment. All highway and bridge improvements related to capacity are modeled in HERS; the NBIAS model considers only investment related to bridge repair, rehabilitation, and replacement.
The HERS model also takes into account the impact that new investments in certain types of intelligent transportation systems (ITS) and the continued deployment of various operations strategies can have on highway system performance, as well as on the estimated level of capital investment that would be needed to reach given performance benchmarks. This feature was introduced in the 2004 edition of the C&P report. The types of operations investments and strategies considered include freeway management (ramp metering, electronic monitoring, variable message signs, and traffic management centers), incident management (incident detection, verification, and response), and arterial management (upgraded signal control, electronic monitoring, and variable message signs).
Future operations investments are implemented in HERS through an assumed, exogenously specified scenario; they are not included directly in the benefit-cost calculations made within the model, and HERS does not directly consider any tradeoffs or complementarities between ITS and other types of highway improvements. The baseline scenario used for this report assumes the continuation of existing deployment trends. This baseline scenario was used for all of the HERS-based analyses presented in Chapters 7, 8, and 9. Chapter 10 includes a sensitivity analysis considering the potential impacts of a more aggressive deployment of operations strategies and ITS.
|
|
|
What are the costs associated with the operations strategies and investments included in the HERS investment analyses?
The costs of the new or increased operations deployments include both the capital costs of the equipment and infrastructure and the ongoing costs of operating and maintaining that infrastructure. The costs include those for both the basic infrastructure needed to support a given strategy (such as a traffic operations management center) and the incremental costs of increasing the coverage of that structure (such as additional ramp meters).
The estimated average annual capital cost of new deployments under the existing trends scenario used for these analyses is $94 million (in 2004 dollars). These costs are included in the investment scenario estimates included in this report.
Estimated average annual operating and maintenance costs for the operations strategies over the same 2005 to 2024 time period are $2.7 billion, including $260 million for new deployments and $2.5 billion for the existing infrastructure. These costs are not included in the "Cost to Maintain" or "Maximum Economic Investment" figures presented in this chapter, which are limited to capital investments only.
Note that the costs shown above only reflect the particular types of improvements currently modeled in HERS, and thus represent a subset of total operations deployments that are expected to occur. This analysis attempts to capture other capital costs relating to operations control facilities via the external adjustment procedure for nonmodeled improvement types discussed above.
|
Appendix A includes a more complete description of the operations strategies, their impacts on performance, and their implementation within HERS, as well as a further discussion of how travel demand elasticity is implemented in HERS.
Linking Investment Scenarios and Revenue Sources
A significant new feature in the version of HERS used for this report links the estimates of future investment scenario levels to the revenues that would be required to achieve this level of investment. The procedure assumes that increases in investment above current levels would be financed by levying additional charges on highway users. Through the HERS travel demand elasticity procedures, the increased cost of highway travel has a dampening effect on future travel growth, which in turn tends to reduce the future investment scenario estimates. Chapter 10 includes an analysis of the impact that this feature has on the HERS estimates. Appendix A includes more details on how this feature was implemented in HERS.
HERS Investment Scenarios
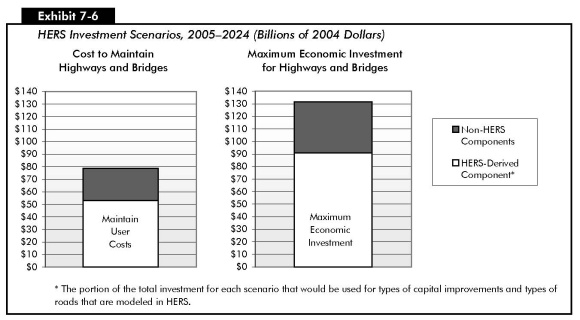
Two HERS investment scenarios were developed in order to generate the HERS-modeled portion of the two combined highway and bridge investment scenarios. The HERS portion of the "Cost to Maintain Highways and Bridges" was drawn from the HERS "Maintain User Costs" scenario, and the HERS "Maximum Economic Investment" scenario was fed into the "Maximum Economic Investment for Highways and Bridges (Cost to Improve)." Exhibit 7-6 shows the estimated investment levels under the two HERS scenarios. The "Non-HERS Components" of the investment scenarios include NBIAS model estimates, highway classes not reported in HPMS, and improvement types not modeled in HERS or NBIAS.
The "Maintain User Costs" scenario in HERS was used to generate the highway resurfacing and reconstruction and system expansion components of the "Cost to Maintain Highways and Bridges." This scenario reflects the level of investment sufficient to allow highway conditions and performance at the end of the 20-year analysis period (as reflected in total highway user costs per vehicle mile traveled) to match the base year levels. It focuses on highway users, rather than the traditional engineering-based criteria, which are oriented more toward highway agencies. Highway user costs include travel time costs, vehicle operating costs, and crash costs. The average annual investment modeled by HERS under this scenario is estimated to be $53.1 billion.
The "Maximum Economic Investment" scenario is of interest mainly because it defines the highest level of annual highway investment that could be economically justified. It was used to generate the highway resurfacing and reconstruction and system capacity expansion components of the "Maximum Economic Investment for (Cost to Improve) Highways and Bridges." This scenario shows the highest funding level that could be justified while making investments that HERS deems to be cost-beneficial. While this scenario does not target any particular level of desired system performance, it would address the existing highway investment backlog and other deficiencies that will develop over the next 20 years because of pavement deterioration and travel growth. As shown in Exhibit 7-6, the average annual investment modeled by the HERS "Maximum Economic Investment" scenario is $90.9 billion. See the Introduction to Part II for more details on the two scenarios.
The impact of these and other levels of investment on individual highway user cost components and other measures of conditions and performance is discussed in Chapter 9.
Highway Investment Backlog
The highway investment backlog represents all highway improvements that could be economically justified for immediate implementation, based on the current conditions and operational performance of the highway system. The HERS model estimates that a total of $430 billion of investment could be justified nationwide based solely on the current conditions and operational performance of the highway system. Approximately 81 percent of the backlog is in urban areas, with the remainder in rural areas. Capacity deficiencies on existing highways account for 58 percent of the backlog; the remainder results from pavement deficiencies.
Note that this figure does not include rural minor collectors or rural and urban local roads and streets because HPMS does not contain sample section data for these functional systems. The backlog figure also does not contain any estimate for system enhancement.
National Bridge Investment Analysis System
The scenario estimates of future capital investment relating to bridge repair and replacement shown in this report are derived primarily from NBIAS. While NBIAS incorporates analytical methods from the Pontis bridge management system, a tool first developed by FHWA in 1989 and now owned and licensed by the American Association of State Highway and Transportation Officials, it also builds certain economic criteria into its analytical procedures that are not included in Pontis.
While Pontis relies on detailed structural element-level data on bridges, NBIAS adds a capability to synthesize such data from general bridge condition ratings reported for all bridges in the NBI. While the analysis in this report is derived solely from NBI data, the current version of NBIAS is capable of processing element-level data directly.
To estimate functional improvement needs, NBIAS applies a set of improvement standards and costs to each bridge in the NBI. The model then identifies potential improvements, such as widening existing bridge lanes, raising bridges to increase vertical clearances, and strengthening bridges to increase load-carrying capacity, and evaluates their potential benefits and costs.
The model uses a probabilistic approach to modeling bridge deterioration for each synthesized bridge element, relying on a set of transition probabilities that project the likelihood that an element will deteriorate from one condition state to another over a given period of time. The model then applies the Markov modeling approach from Pontis to determine an optimal set of preservation actions to take for each bridge element, based on the condition of the element. NBIAS can also apply preservation policies at the individual bridge level and directly compare the costs and benefits of performing preservation work relative to completely replacing the bridge.
The NBIAS model is discussed in more detail in Appendix B.
Bridge Investment Scenarios
The "Maintain Economic Backlog" scenario is the bridge component of the "Cost to Maintain Highways and Bridges." This scenario identifies the estimated level of annual investment that would allow the cost of addressing all bridge deficiencies in 2024 to remain the same as in 2004. Under this scenario, existing deficiencies and newly accruing deficiencies would be selectively corrected, but the overall level of deficiencies measured in dollar terms would be maintained. As shown in Exhibit 7-7, the average annual investment under this scenario is estimated at $8.7 billion, or 11.1 percent of the $78.8 billion average "Cost to Maintain Highways and Bridges" over a 20-year period. The "Non-NBIAS Components" of the investment scenarios include HERS model estimates, highway classes not reported in HPMS, and improvement types not modeled in HERS or NBIAS.
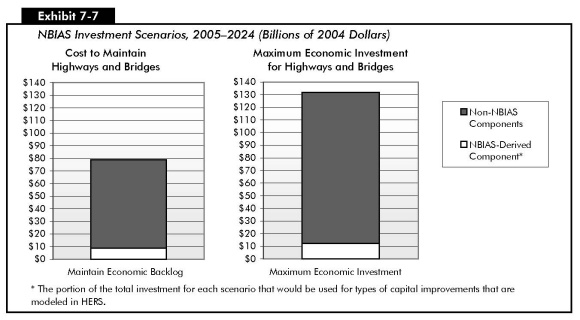
The "Maximum Economic Investment" scenario is the bridge repair and replacement component of the "Cost to Improve Highways and Bridges" described earlier in this chapter. Where it is cost beneficial to do so, this scenario would eliminate the existing bridge investment backlog and correct other deficiencies that are expected to develop over the next 20 years. The average annual investment under this scenario is estimated to be $12.4 billion, which is 9.4 percent of the $131.7 billion average annual investment level under the "Maximum Economic Investment for Highways and Bridges" scenario.
Bridge Investment Backlog
As defined in this report, the bridge investment backlog represents the cost of improving all existing bridge deficiencies if the benefits of doing so exceed the costs. The NBIAS defines deficiencies broadly and covers more than the structurally deficient and functionally obsolete categories defined in Chapter 3. The NBIAS estimates that $65.2 billion could be invested immediately in a cost-beneficial fashion to replace or otherwise address currently existing bridge deficiencies.
|
|
|
How does the NBIAS definition of bridge deficiencies compare with the information on structurally deficient bridges reported in Chapter 3?
NBIAS considers bridge deficiencies and corrective improvements at the level of individual bridge elements. The economic backlog of bridge deficiencies estimated by NBIAS thus consists of the cost of all improvements to bridge elements that would be justified on both engineering and economic grounds. It includes many improvements on bridges with certain components that may warrant repair, rehabilitation, or replacement, but whose overall condition is not sufficiently deteriorated for them to be classified as structurally deficient.
|
Transit Investment Scenarios
FTA uses the Transit Economic Requirements Model (TERM), a model based on engineering and economic concepts, to prepare estimates of total capital investment projections for the U.S. transit industry. TERM was developed to improve the quality of these FTA estimates. This edition of the C&P report uses TERM to project the dollar amount of capital investment for the transit sector to meet various asset condition and operational performance scenarios by 2024. These capital investment scenario estimates are based on the asset condition estimation process and results provided in Chapter 3, ridership growth projections, and data from the National Transit Database (NTD) on the existing transit asset base (e.g., number of vehicles and stations) and operating statistics (e.g., operating speed). Since the last edition of the report, the accuracy of the asset inventory and asset deterioration in TERM has been improved through special data collection efforts and engineering surveys also discussed in Chapter 3. Ridership forecasts have been revised upward very slightly since the last report, by 0.07 percent per year, based on updated information collected from an expanded list of metropolitan planning organizations (MPOs).
TERM identifies potential investments using asset decay curves relating condition to age, and in some cases additionally to maintenance and use. TERM also identifies investments to achieve stated performance goals based on proxies of vehicle occupancies and passenger travel time. TERM uses benefit-cost analysis to limit the actual level of investment recommended by TERM to a subgroup of the total investments identified based on asset condition and performance targets which have benefit-cost ratios greater than one.
The benefit-cost component of TERM has been updated and refined since the 2004 report, refining values used by the benefit-cost analysis to be more agency-specific or region-specific. The investment estimates presented here have, therefore, been subjected to a much more rigorous benefit-cost test than investment estimates based on TERM provided in earlier report editions. [A technical description of TERM, including an explanation of changes made to the benefit-cost component of TERM since the last edition of this report, is provided in Appendix C.]
TERM projects estimated capital investment to achieve the following benchmarks which are then combined to form the different investment scenarios:
- Maintain Asset Conditions
Transit assets are replaced and rehabilitated over the 20-year period such that the average condition of the assets existing at the beginning of the period remains the same at the end of the period. - Maintain Performance
New transit vehicles and infrastructure investments are undertaken to accommodate increases in transit ridership so that the vehicle utilization rate existing at the beginning of the period remains the same at the end of the period. Ridership growth estimates are obtained from MPOs. - Improve Conditions
Transit asset rehabilitation and replacement is accelerated to improve the average condition of all transit assets to a "good" level at the end of the 20-year period (2024). If an average condition of "good" can be reached only by replacing assets that are still in operationally acceptable condition, then the "Improve Conditions" scenario targets a lower condition level. This condition level will be equal to the highest condition that can be achieved without replacing assets that are in operationally acceptable condition. - Improve Performance
The performance of the Nation's transit system is improved as additional investments in bus rapid transit (BRT), light rail, or heavy rail are undertaken in urbanized areas with the most crowded vehicles and the systems with the slowest speeds to reduce vehicle utilization rates (and crowding) and increase average transit operating speeds.
TERM has two benefit-cost tests. One benefit-cost test is applied to all proposed investments to maintain conditions, improve conditions, and maintain performance and compares the benefits to riders and society of continuing to maintain each agency-mode with the costs of maintaining each agency-mode over a 20-year period. This includes an assessment of the benefits and cost to riders of an agency-mode with the benefits and costs of using an alternative mode. A separate benefit-cost test is applied on an urbanized area basis to investments proposed to improve performance. This test assesses whether the benefits to an urbanized area from the speed improving investments exceed the costs of these investments over a 20-year period.
Exhibit 7-8 provides estimates of the total annual capital investment to meet combinations the four investment scenarios. These estimates combine those calculated by TERM with rural and special service investment estimates prepared by FTA outside of the TERM framework. Annual transit investment is estimated to be $15.8 billion for the scenario to maintain the conditions and performance of the Nation's transit system at its 2004 level (compared with $15.6 billion in 2002 dollars and $16.3 billion in 2004 dollars in the last report). To reach the "Improve" scenario, which targets an average transit asset condition level of "good" by 2024 and which improves performance by increasing vehicle speeds as experienced by passengers and reduces occupancy rates to threshold levels, the amount of the "Maintain" scenario is increased by an additional $6.0 billion per year for a total average annual capital amount of $21.8 billion (compared with $24.0 billion in 2002 dollars and $25.1 billion in 2004 dollars in the last report). These investment estimates assume a 1.57 percent average annual increase in ridership over the 20-year projection period compared with a 1.50 percent assumed in the 2004 report (and 1.60 percent average annual increase assumed in the 2002 report). Note that the "Improve Conditions and Performance" scenario is an ideal target and defines an upper limit above which additional investment in transit is unlikely to be economically justifiable.
|
|
|
Is the average asset condition to Maintain Conditions reached after 20 years always the same as in the base year? Does the average asset condition to Improve Condition absolutely reach a level of 4 at the end of the 20-year period?
The Maintain Conditions scenario tries to match the average asset condition in the projected year (2024) with the average asset condition in the base year (2004). The investment needs in this report to Maintain Conditions assume that in 2024 average conditions will be 3.6, compared with an average condition of 3.9 in 2004. To reach an average condition of 3.9 in 2024 would require TERM to replace assets below the condition replacement threshold, i.e., still in an operationally acceptable condition. The Improve Conditions scenario assumes that an average asset condition of 3.7 is reached in 2024; guideway and vehicles are replaced at very slightly lower conditions in the Improve Conditions scenario than in the Maintain Conditions scenario. To reach a condition of 4.0 in 2024 would require TERM to replace assets below the condition replacement threshold. (See Appendix C.)
|
| Conditions | Performance | Average Annual Cost |
|---|---|---|
| Maintain | Maintain | $15.8 |
| Improve | Maintain | $16.4 |
| Maintain | Improve | $21.2 |
| Improve | Improve | $21.8 |
The "Improve Conditions and Maintain Performance" and the "Maintain Conditions and Improve Performance" scenarios in Exhibit 7-8 represent intermediate points between the "Maintain Conditions and Performance Scenario" and the "Improve Conditions and Performance Scenario."
The level of investment estimated by the Maintain Conditions and Performance scenario increased marginally in current dollars from those in the 2004 C&P report, but declined in real terms. The level of investment estimated by the Improve Conditions and Performance scenario has declined, both in current and real-dollar terms. The upward revision in projected ridership growth and improvements to the methodology used to generate asset records for transit capital assets not reported to FTA had upward effects on the estimated investment for both scenarios. In contrast, revisions to maintenance facility replacement costs, improvements to the benefit-cost analysis, revisions to the asset deterioration schedules for stations and rail systems, replacement and rehabilitation assumptions for subways structures and underground rail stations, and updated NTD data had downward effects on estimated investment, with the first two predominating. The asset inventory updates had a limited impact on estimated investment. The 2004 update increased estimated investment amounts slightly, and the 2005 update decreased them slightly. The estimated investment for the Improve Conditions and Performance scenario declined due to a decline in the estimate of the investment to improve performance, principally resulting from a reduction in estimated cost of congestion delay.
As shown in Exhibit 7-9, replacement and rehabilitation costs are $10.4 billion annually for the scenario to maintain conditions and performance (compared with $10.3 billion in the 2004 report), and $10.9 billion annually for the scenario to improve conditions and performance (compared with $11.7 billion in the 2004 report). The incremental $0.5 billion for asset rehabilitation and replacement under the "Improve Conditions" scenario results from the extra investment required to rehabilitate and replace additional assets to attain an overall physical condition of "good." Average asset condition levels are estimated to be closer to "good" than in the 2004 report, leading to a decline in the difference between the amount required to maintain conditions and the amount required to improve conditions. Asset expansion costs to meet the projected 1.57 percent average annual increase in ridership growth are $5.4 billion, similar to the last report. Investments to improve performance (increasing passenger speeds and reducing crowding in systems not operating at "good" performance threshold levels) are estimated to be $5.5 billion annually, compared with $6.6 billion annually in the 2004 report. This amount declined primarily due to a revision in the methodology used to calculate congestion delay costs, the latter being a key input to the benefit-cost evaluation of all investment proposed by TERM. The assumed cost of congestion delay used in determining the investment estimates in this report are lower than in earlier reports and vary according to the average level of congestion in areas with similar levels of population. The amount to improve performance also declined very slightly due to the use of agency-specific maintenance expenditures, fares, and speeds in the benefit-cost analysis instead of national modal averages.
| Type of Improvement | Maintain Conditions & Performance | Improve Conditions & Maintain Performance | Maintain Conditions & Improve Performance | Improve Conditions & Performance |
|---|---|---|---|---|
| Replacement and Rehabilitation | $10.4 | $10.9 | $10.4 | $10.9 |
| Asset Expansion | $5.4 | $5.4 | $5.4 | $5.4 |
| Performance Improvements | $5.5 | $5.5 | ||
| Total | $15.8 | $16.4 | $21.2 | $21.8 |
Costs to Maintain and Improve Conditions and Performance
Investment Estimates by Population Area Size
Exhibit 7-10 provides a summary of transit investment by TERM scenario, area population size, and broad asset type (rail or nonrail). This information is provided in more detail in Exhibit 7-11. Eighty-seven percent of transit investment estimates are concentrated in urban areas with populations of over 1 million, reflecting the fact that, in 2004, 92 percent of the Nation's passenger miles were in these areas.
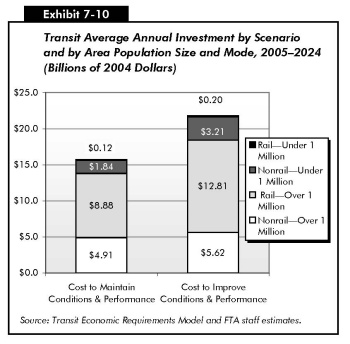
The "Maintain" scenario estimates an average annual investment of $13.8 billion to maintain the conditions and performance of transit assets in large urban areas (compared with $13.5 billion in the 2004 C&P report); the "Improve" scenario estimates an average annual investment of $18.4 billion annually to improve the conditions and performance of transit assets in large urban areas (compared with $20.5 billion in the 2004 C&P report). The investment in less-populated areas (i.e., those with populations under 1 million) is estimated to be considerably lower than the investment in more populous areas because the former has fewer transit assets. The Maintain Conditions and Performance scenario estimates an average investment of $2.0 billion annually in the transit infrastructure in these less-populated areas (compared with $2.1 billion in the 2004 C&P report), and the Improve Conditions and Performance scenario estimates an average investment of $3.4 billion annually in transit infrastructure in these less-populated areas (compared with $3.5 billion in the 2004 C&P report).
| (Millions of 2004 Dollars) Mode, Purpose & Asset Type |
Cost to Maintain Conditions & Performance | Incremental Cost to Improve Conditions | Incremental Cost to Improve Performance | Cost to Improve Conditions & Performance | |
|---|---|---|---|---|---|
| Areas Over 1 Million in Population | |||||
| Nonrail 1 | |||||
| Replacement & Rehabilitation | (Vehicles) | $2,437 | $40 | $2,477 | |
| (Nonvehicles) 2 | 1,205 | -5 | 1,200 | ||
| Asset Expansion | (Vehicles) | 749 | 16 | 765 | |
| (Nonvehicles) | 489 | 0 | 489 | ||
| Improve Performance | (Vehicles) | 411 | 411 | ||
| (Nonvehicles) 2 | 227 | 227 | |||
| Special Service 3 | (Vehicles) | 31 | 17 | 48 | |
| Subtotal Nonrail | 4,910 | 68 | 637 | 5,616 | |
| Rail | |||||
| Replacement & Rehabilitation | (Vehicles) | 1,636 | 246 | 1,882 | |
| (Nonvehicles) 2 | 3,517 | 0 | 3,517 | ||
| Asset Expansion | (Vehicles) | 930 | 0 | 930 | |
| (Nonvehicles) 2 | 2,798 | 0 | 2,798 | ||
| Improve Performance | (Vehicles) | 499 | 499 | ||
| (Nonvehicles) 2 | 3,185 | 3,185 | |||
| Subtotal Rail | 8,880 | 246 | 3,684 | 12,811 | |
| Total Areas Over 1 Million | 13,790 | 315 | 4,321 | 18,426 | |
| Areas Under 1 Million in Population | |||||
| Nonrail 1 | |||||
| Replacement & Rehabilitation | (Vehicles) | 689 | 40 | 729 | |
| (Nonvehicles) 2 | 388 | -2 | 386 | ||
| Fleet Expansion | (Vehicles) | 212 | 6 | 218 | |
| (Nonvehicles) 2 | 113 | 0 | 113 | ||
| Improve Performance | (Vehicles) | 203 | 203 | ||
| (Nonvehicles) 2 | 564 | 564 | |||
| Special Service 3 | (Vehicles) | 174 | 94 | 268 | |
| Rural | (Vehicles) | 264 | 147 | 294 | 705 |
| (Nonvehicles) 2 | 5 | 10 | 13 | 28 | |
| Subtotal Nonrail | 1,844 | 295 | 1,074 | 3,213 | |
| Rail | |||||
| Replacement & Rehabilitation | (Vehicles) | 3 | 0 | 3 | |
| (Nonvehicles) 2 | 10 | 0 | 10 | ||
| Fleet Expansion | (Vehicles) | 16 | 0 | 16 | |
| (Nonvehicles) 2 | 92 | 0 | 93 | ||
| Improve Performance | (Vehicles) | 0 | 12 | 12 | |
| (Nonvehicles) 2 | 0 | 66 | 66 | ||
| Subtotal Rail | 120 | 0 | 78 | 199 | |
| Total Areas Under 1 Million | 1,964 | 295 | 1,152 | 3,412 | |
| Total | 15,754 | 609 | 5,473 | 21,838 | |
Nonrail Needs in Areas with Populations of Over 1 Million
The nonrail infrastructure (buses, vans, and ferryboats) component of the scenario to maintain conditions and performance in urban areas with populations over 1 million is considerably smaller than the rail component. The Maintain Conditions and Performance scenario estimates that 26 percent of the investment in larger urban areas, or about $4.9 billion annually, is for nonrail infrastructure (compared with $4.5 billion annually in the 2004 C&P report). Of this $4.9 billion, 74 percent, or $3.6 billion annually, is estimated for the rehabilitation and replacement of assets; and 25 percent, or $1.2 billion, is estimated for the purchase of new assets to maintain performance. It is estimated that 67 percent of rehabilitation and replacement expenditures and 61 percent of asset expansion expenditures would be for vehicles. The incremental costs to improve nonrail conditions are estimated to be $68 million annually, of which $40 million would be for vehicle rehabilitation and replacement. The incremental costs to improve performance are estimated to be $637 million annually, of which 64 percent ($411 million) would be spent on new vehicles (principally buses) and 36 percent ($227 million) on new nonvehicle assets. Expenditures on nonvehicle assets include investments for the purchase or construction of dedicated highway lanes for bus rapid transit (BRT). The Improve Conditions and Performance scenario estimates that, in total, $5.6 billion is estimated for investment in these more heavily populated areas (compared with $5.7 billion annually in the 2004 C&P report). Estimated investment in nonrail performance was not affected significantly by revisions to the benefit-cost analysis.
Rail Needs in Areas with Populations of Over 1 Million
The Maintain Conditions and Performance scenario estimates that 64 percent of the total transit investment in large urban areas, or $8.9 billion annually, is for rail infrastructure (compared with about $9.0 billion in the 2004 C&P report). Of this $8.9 billion, 58 percent, or $5.2 billion annually, is for the rehabilitation and replacement of rail assets to maintain conditions; and 42 percent, or $3.7 billion, is for the purchase of new assets to expand rail systems as ridership increases. The "Improve Conditions" scenario estimates an additional amount of $246 million annually for vehicles, but no additional amount for nonvehicle assets as the average condition of these assets is already "good." The "Improve Performance" scenario estimates an additional amount of $4.3 billion annually, including the cost of purchasing rights-of-way. (The amount estimated by the "Improve Performance" scenario in the 2004 C&P report was $5.1 billion annually. The amount declined due to revisions in the benefit-cost methodology.) Eighty-six percent of the $4.3 billion performance investments, or $3.2 billion, is for the expansion of the nonvehicle rail infrastructure. The split between vehicle and nonvehicle investment for performance improvement is within the range of what is typical for new heavy and light rail infrastructure development projects. A total of $12.8 billion annually is estimated by the Improve Conditions and Performance scenario for rail in these more heavily populated, urbanized areas.
Nonrail Needs in Areas with Populations of Under 1 Million
Based on the investment scenarios, 94 percent of the transit investment in areas with populations under 1 million is estimated to be for nonrail transit. The Maintain Conditions and Performance scenario estimates investment in the nonrail transit infrastructure in these less-populated areas to be $1.8 billion annually (compared with $2.0 billion annually in the 2004 C&P report); and the Improve Conditions and Performance scenario estimates it to be $3.2 billion annually (compared with $3.4 billion annually in the 2004 C&P report). The incremental investment estimated to improve conditions in these areas is $295 million annually, and the incremental investment to improve performance is $1.2 billion. Of the $1.2 billion incremental annual investment to improve performance, 46 percent, or $497 million, would be needed to acquire new vehicles; and 54 percent, or $577 million, would need to be invested in the new nonvehicle infrastructure. The current report assumes that investment required to improve speed will be in the form of BRT rather than light rail, except in systems where rail already exists. This assumption was also made for the 2004 report. The 2002 C&P report and earlier editions assumed that all investment to increase speeds in these less populous areas would be in light rail. Twenty-nine percent of the expansion in investment to improve performance, or $307 million annually, is assumed to be necessary to improve service to rural areas, that now have limited or no service.
Rail Needs in Areas with Populations of Under 1 Million
The investment scenarios find that rail needs in areas with populations of less than 1 million are minimal. Six light rail systems currently operate in these less-populated areas. The Maintain Conditions and Performance scenario estimates investment in rail for these areas to be $120 million annually, compared with $40 million annually in the 2004 C&P report. This investment estimate increased due to an increase in the estimated size of the rail infrastructure in these areas because of enhancements in estimating unreported assets and extensions and the opening of new systems. Eighty-five percent of the $120 million, or $102 million annually, is for investment in nonvehicle rail infrastructure. The amount needed for the "Improve Performance" scenario is estimated to be $78 million annually (compared with $67 million in the 2004 C&P report).
|
|
|
What would be the effect of investing in light rail instead of BRT to improve performance in areas with populations of less than 1 million?
This change would increase the annual amount to improve performance by $302 million annually. The amount of rail investment in these areas would increase by $797 million and the amount of bus investment in these areas would decrease by $495 million. More light rail projects are economically viable (and pass the benefit-cost test) than was found in the analysis for the 2004 C&P report. This is mainly due to changes in agency-specific costs and ridership values as reported to the NTD.
|
Investment Estimates by Asset Type
Exhibit 7-12 provides disaggregated annual investment by scenario for rail and nonrail transportation modes by asset type for the following:
- Asset replacement and rehabilitation
- Asset expansion
- Performance improvement.
| Maintain Conditions and Performance | |||||
|---|---|---|---|---|---|
| Asset Type | Rehabilitation and Replacement | Asset Expansion | Improve Performance | Total | |
| Rail | |||||
| Guideway Elements | $1,508 | $1,035 | $2,543 | ||
| Facilities | $279 | $101 | $380 | ||
| Systems | $1,030 | $219 | $1,249 | ||
| Stations | $710 | $587 | $1,296 | ||
| Vehicles | $1,638 | $945 | $2,583 | ||
| Other Project Costs | $949 | $949 | |||
| Subtotal Rail | $5,165 | $3,836 | $0 | $9,000 | |
| Nonrail | |||||
| Guideway Elements | $263 | $137 | $400 | ||
| Facilities | $1,182 | $353 | $1,535 | ||
| Systems | $80 | $47 | $127 | ||
| Stations | $73 | $40 | $113 | ||
| Vehicles | $3,594 | $961 | $4,555 | ||
| Other Project Costs | $25 | $25 | |||
| Subtotal Nonrail | $5,192 | $1,562 | $0 | $6,754 | |
| Total Maintain Conditions | $10,357 | $5,398 | $0 | $15,754 | |
| Improve Conditions and Performance | ||||
|---|---|---|---|---|
| Asset Type | Rehabilitation and Replacement | Asset Expansion | Improve Performance | Total |
| Rail | ||||
| Guideway Elements | $1,508 | $1,035 | $1,011 | $3,554 |
| Facilities | $279 | $101 | $92 | $471 |
| Systems | $1,030 | $219 | $270 | $1,518 |
| Stations | $710 | $587 | $641 | $1,937 |
| Vehicles | $1,884 | $945 | $511 | $3,341 |
| Other Project Costs | $949 | $1,238 | $2,187 | |
| Subtotal Rail | $5,411 | $3,836 | $3,762 | $13,008 |
| Nonrail | ||||
| Guideway Elements | $263 | $137 | $209 | $609 |
| Facilities | $1,186 | $353 | $356 | $1,894 |
| Systems | $79 | $47 | $11 | $137 |
| Stations | $72 | $40 | $75 | $188 |
| Vehicles | $3,932 | $983 | $909 | $5,824 |
| Other Project Costs | $25 | $152 | $177 | |
| Subtotal Nonrail | $5,533 | $1,584 | $1,712 | $8,829 |
| Total Improve Conditions | $10,944 | $5,420 | $5,474 | $21,838 |
Assets are disaggregated into five categories—guideway elements, facilities, systems, stations, and vehicles. The estimates of annual funding for services to support investment in new transit capacity are provided under "Other Project Costs." These costs include expenditures for project design, project management and oversight, right-of-way acquisition, and site preparation.
Rail Infrastructure
Fifty-eight percent of the total amount estimated by the Maintain Conditions and Performance scenario ($9.0 billion dollars annually) and 60 percent of the total amount estimated by the Improve Conditions and Performance scenario ($13.0 billion annually) are for rail infrastructure. As shown in Exhibit 7-13, vehicles and guideway elements are estimated to have the largest amounts of the total capital investment of all rail assets between 2005 and 2024, followed in descending order of investment by stations, systems, and facilities.
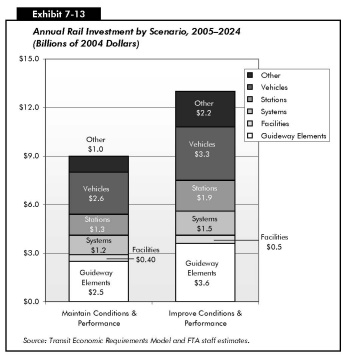
Guideways are estimated to account for 43 percent of the total value of the Nation's rail infrastructure. [See the "Value of U.S. Transit Assets" section in Chapter 3.] Just over a quarter of the total amount of the investment in the Nation's transit rail assets estimated by the Maintain and Improve Conditions and Performance scenarios is for guideway elements. Guideway elements are composed of elevated structures, systems structures, and track, assets with long, useful lives relative to most other transit assets. The Maintain Conditions and Performance scenario estimates annual rail guideway investment to be $2.5 billion, and the Improve Conditions and Performance scenario estimates annual guideway investment to be $3.6 billion. The "Maintain Conditions" scenario estimates annual rehabilitation and replacement to be $1.5 billion; the "Maintain Performance" scenario estimates annual asset expansions to cost $1.0 billion and the "Improve Performance" scenario an incremental $1.0 billion annually. The estimated average condition of guideway improved slightly, from 4.25 in 2002 to 4.39 in 2004, primarily based on updated asset information. The amount estimated by the "Improve Conditions" scenario declined due to replacing the default assumption to replace tunnels after 100 years with the assumption not to replace them and to only undertake annual capital maintenance as reflected by NTD data for each agency's practices. The amount estimated by the "Improve Performance" scenario was also reduced by revisions to estimated cost of congestion delay used in the benefit-cost analysis. The impact of these declines outweighed increases resulting from a 3.9 percent increase in the value of rail guideway asset infrastructure between 2002 and 2004, and an increase in the TERM replacement threshold for all guideway except tunnels from a condition of 1.50 to a condition of 1.75. (For the 2004 C&P report, the Maintain Conditions and Performance scenario estimated investment of $3.5 billion annually for guideway; and the Improve Conditions and Performance scenario estimated investment of $3.8 billion annually for guideway.)
Vehicles are estimated to account for 19 percent of the total value of the Nation's rail infrastructure. Twenty-nine percent of the amount estimated to maintain rail asset conditions and performance, or $2.6 billion annually, and 26 percent of the amount estimated to improve rail asset conditions and performance, or $3.3 billion annually, are for vehicles. Annual vehicle rehabilitation and replacement costs are estimated to be $1.6 billion to maintain conditions and $1.9 billion to improve conditions. Annual asset expansion costs are estimated to be $945 million to maintain performance and $511 million to improve performance. These values are comparable to those in the 2004 C&P report, which estimated that $2.4 billion annually was needed to maintain rail vehicle conditions and performance and $3.3 billion annually to improve rail vehicle conditions and performance.
Rail systems, comprising train control, traction power, and communications, are estimated to account for 16 percent of the total value of the Nation's rail asset base. Fourteen percent of the amount estimated to maintain the conditions and performance of rail assets, or $1.2 billion annually, and 12 percent of the amount estimated to improve the conditions and performance of rail assets, or $1.5 billion annually, are for rail systems. Annual rehabilitation and replacement costs are estimated to be $1.0 billion both to maintain and to improve conditions. Annual asset expansion costs are estimated to be $219 million to maintain rail power system performance and an additional $270 million to improve performance. These values are comparable to the 2004 report, which estimated that $1.2 billion annually was needed to maintain rail power systems conditions and performance and $1.4 billion annually to improve rail power systems conditions and performance. Preliminary revisions to system decay curves had a very limited effect on estimated investment.
Stations are estimated to account for 17 percent of the total value of the Nation's rail infrastructure. Fourteen percent of the amount estimated to maintain the conditions and performance of rail assets, or $1.3 billion annually, and 15 percent of the annual amount estimated to improve the conditions and performance of rail assets, or $1.9 billion annually, are estimated to be for stations. The amount estimated for rehabilitation and replacement both to maintain rail station conditions and to improve rail station conditions is estimated to be $710 million annually, about half the amounts indicated in the 2004 C&P report. The annual amount of station expansion to maintain performance is estimated to be $587 million, and the annual amount of station expansion to improve performance is estimated to be $641 million. Estimated investment for stations has declined since the 2004 report due to revisions to station deterioration curves (which led to an increase in average condition), a revision to the station replacement assumption in TERM, and revisions to the estimated cost of congestion delay. Investment estimates in this report assume that underground stations are rehabilitated only, and not replaced as assumed in earlier reports. The decrease in estimated station investment resulting from changes in station deterioration curves, the cost of congestion delay, and replacement assumptions outweighed increases in estimated station investment due to a 21 percent increase in the value of rail station assets as a result of revisions to the process of generating missing assets. (The 2004 C&P report estimated that $1.7 billion annually was needed to maintain station conditions and performance and $3.1 billion annually to improve station conditions and performance.)
Facilities for rail vehicles (maintenance facilities and yards) are estimated to account for 5 percent of the total value of the Nation's rail transit asset base. Four percent of the amount to maintain conditions, $380 million annually, and 3 percent of the amount to improve conditions and performance, $471 million annually, are estimated to be for facilities. Annual rehabilitation and replacement costs are estimated to be $279 million both to maintain and to improve conditions. Asset expansion costs are estimated to be $101 million annually to maintain performance and $92 million annually to improve performance. The estimated value of facilities in current dollars is 25 percent higher in 2004 than in 2002, as a result of updated asset information from agencies and revised facility replacement costs. The estimated average condition of facilities increased from 3.56 in 2002 to 3.82 in 2004. In summary, the somewhat higher asset valuation of maintenance facilities has led to higher estimates of future capital investment outweighing any reductions due to the increase in average condition. (The 2004 C&P report estimated $307 million annually to maintain rail facilities conditions and performance and $424 million annually to improve rail facilities conditions and performance.)
Nonrail Assets
Forty-three percent of the total amount to maintain conditions and performance, or $6.8 billion dollars annually, and 40 percent of the total amount estimated to improve conditions and performance, or $8.8 billion annually, are for nonrail infrastructure. Vehicles are estimated to require the largest amount of the total capital investment in nonrail assets between 2005 and 2024, as shown in Exhibit 7-14, followed in descending order of estimated investment by facilities, guideway elements (dedicated lanes for buses), stations, and systems.
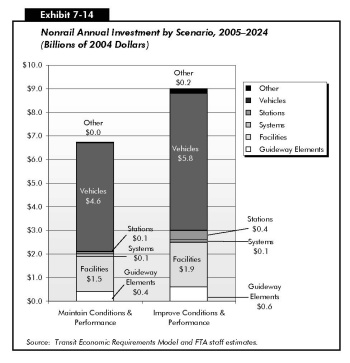
Vehicles are estimated to account for 34 percent of the total value of the Nation's nonrail assets, excluding vehicles in rural areas. [Note that asset value is estimated by TERM, which does not include rural operators.] However, they account for substantially more of estimated nonrail investment because they depreciate much more quickly than nonvehicle assets. The investment in nonrail vehicles estimated by the Maintain Conditions and Performance scenario is $4.6 billion annually, and the investment in nonrail estimated by the Improve Conditions and Performance scenario is $5.8 billion annually. Seventy percent of estimated nonrail rehabilitation and replacement expenditures is for vehicles. Vehicles are also estimated to account for the largest proportion, about 60 percent, of nonrail asset expansion investments by the "Maintain Performance" scenario and 53 percent of the amount estimated by the "Improve Performance" scenario. (The 2004 C&P report estimated that $4.4 billion annually was needed to maintain the conditions and performance of nonrail vehicles and $6.0 billion annually to improve the conditions and performance of nonrail vehicles.)
Facilities are estimated to account for 52 percent of the total value of the Nation's nonrail assets, excluding facilities in rural areas. Although facilities account for more than half of the nonrail assets, it is estimated that they will account for over 20 percent of future nonrail investment because external structures and many of the facility components depreciate slowly. The Maintain Conditions and Performance scenario estimates investment in facilities to be $1.5 billion, and the Improve Conditions and Performance scenario estimates investment in facilities to be $1.9 billion. The conditions of bus maintenance facilities increased from 3.34 in 2002 to 3.41 in 2004. These results are comparable to those in the 2004 C&P report; the Maintain Conditions and Performance scenario in the 2004 report estimated investment of $1.6 billion annually for nonrail maintenance facilities, and the Improve Conditions and Performance scenario estimated investment of $1.9 billion annually for nonrail maintenance facilities. Although average condition increased, the amount needed to maintain facilities' condition declined due to revisions in facility replacement costs and revisions to the benefit-cost analysis.
Guideway elements account for 9 percent of the Nation's nonrail assets, stations account for 3 percent, and power systems account for 2 percent. The Maintain Conditions and Performance scenario estimates investment of $400 million annually for nonrail guideway, and the Improve Conditions and Performance scenario estimates investment of $609 million for nonrail guideway (compared with $212 million annually and $456 million annually in the 2004 report). These amounts increased principally due to an increase in the estimated value of the nonrail guideway infrastructure as a result of improvements to the process used to generate asset records for unreported assets. The Maintain Conditions and Performance scenario estimates investment of $133 million annually for nonrail stations, and the Improve Conditions and Performance scenario estimates investment of $188 million for nonrail stations (compared with $100 million annually and $350 million annually in the 2004 report). The increase in the amount to maintain conditions resulted from revisions to nonrail station deterioration curves and to a reduction in the assumed interval between rehabilitations from 40 to 35 years. The amount to improve performance declined as a result of the reduction in the assumed costs of congestion delay used in the benefit-cost analysis. The Maintain Conditions and Performance scenario estimates investment of $127 million annually in nonrail systems; and the Improve Conditions and Performance scenario estimates investment of $137 million in nonrail systems (compared with $180 million annually and $185 million annually in the 2004 C&P report). Nonrail systems are primarily comprised of communications systems. The decline in the amount needed to maintain conditions resulted from revised system decay curves for PBX systems. These systems were found to deteriorate much more slowly than previously estimated. The amount needed to improve performance declined as a result of the reduction in congestion costs by the benefit-cost analysis.
|
|
|
What is a PBX system?
PBX stands for private branch exchange, a private telephone network used within an enterprise. Users of the PBX share a certain number of outside lines for making telephone calls external to the PBX.
|
Rural Transit Vehicles and Facilities
Investment for rural areas has been estimated using the same information and methodology as in the 2004 C&P Report [see Appendix C]. The most recent information on rural systems was published by the Community Transportation Association of America (CTAA) in 2000 and was also used to estimate investment for the 2002 edition of this report. The changes in estimated investment since the last report result from revisions in estimated vehicle and facility replacement costs. The estimated amount to maintain conditions and performance decreased by 2.9 percent in current dollars, from $277 million in 2002 to $269 million in 2004; the estimated amount to improve conditions and performance increased by 7.6 percent from $681 million in 2002 to $733 million in 2004. The estimate to maintain the conditions and performance of rural transit decreased as a result of reductions in the estimated replacement costs of automobiles and nonaccessible vans. Combined, these automobiles and vans are estimated to account for 63 percent of the rural fleet. The replacement cost of facilities (maintenance and administrative) was estimated to be the same. The estimate to improve conditions and performance increased by 3.4 percent due to a 9.2 percent increase in the cost of an ADA-accessible van. The "Improve Conditions and Performance" scenario assumes that all vans are replaced with models that are ADA accessible. Nonaccessible vans are estimated to account for 38 percent of the total rural fleet. As in the 2004 C&P report, the number of rural vehicles is assumed to increase at an average annual rate of 3.5 percent to improve performance.
Special Service Vehicles
The investment estimated for special service vehicles is 24 percent lower than in the 2004 C&P report as a result of a reduction in estimated vehicle replacement costs. The number of special service vehicles, as reported in the "FTA Trends Report FY2002 on the use of Section 5310 Elderly and Persons with Disabilities Program Funds" was estimated to be 37,720 in 2002, used as a proxy for 2004 in this report. Based on information reported to FTA by grantees, the average replacement price of a special service vehicle decreased from $46,985 in 2002 to $37,949 in 2004. Note that the estimated investment for vehicles funded by FTA accounts for 43 percent of the total amount estimated for the entire 37,720 special service vehicle fleet.
U.S. Federal Lands
Growth in public recreational use of Federal Lands has created a need for additional investment in alternative transportation systems (ATS), i.e., transit and transit enhancements, on Federal Lands. Transit investment on Federal Lands has been estimated outside the scope of the TERM framework and is discussed in more detail in Chapter 20 of the 2004 C&P report. In 2004, a joint FTA and FHWA study was completed, which estimated ATS on U.S. Forest Service (USFS) lands, which are part of the U.S. Department of Agriculture. This study identified 30 USFS sites that would benefit from new or supplemental ATS investments and estimated that approximately $698 million in 2003 dollars ($714 million in 2004 dollars or $60 million per year) would be needed in these areas between 2003 and 2022. An earlier joint FTA/FHWA study, undertaken in 2001, estimated ATS investment needs on National Park Service (NPS), Bureau of Land Management (BLM), and U.S. Fish and Wildlife Service (USFWS) lands, which are all part of the U.S. Department of the Interior (DOI). Total DOI needs for the period 2002 to 2020 were estimated to be $1.71 billion in 1999 dollars ($2.16 billion in 2004 dollars or $180 million per year). Ninety-one percent of these needs were estimated to be required by the NPS, 7 percent by the USFWS, and 2 percent by BLM.
Transit Investment Backlog
TERM estimates the amount of investment that would be required to replace the transit assets in not meeting certain replacement criteria. The "backlog" is the level of investment needed to replace all assets with conditions below the condition replacement thresholds specified by TERM necessary to improve conditions and is similar to the backlog requirement calculated by the HERS for highways. TERM assumes that the backlog is eliminated over a 20-year period, meaning that the average annual investment estimates calculated by TERM include one-twentieth of the backlog [see Appendix C]. TERM estimates that the Nation's transit infrastructure has an existing backlog of $27.66 billion (compared with $41.8 billion in the 2004 report).
|
|
|
How much would be required to replace assets falling below thresholds to maintain conditions?
TERM estimates that $23.8 billion is needed to replace assets with conditions below the threshold levels specified by TERM to maintain conditions (compared with $27.0 billion in the 2004 C&P report). The investment estimated under the Maintain scenario in this chapter assume that these deferred needs are eliminated over a 20-year period, i.e., the average annual investment estimates include one-twentieth of this amount. Forty-one percent of the $23.8 billion, or $9.83 billion, is estimated to be needed to replace vehicles; 9 percent, or $2.3 billion, is estimated to be needed to replace stations; 29 percent, or $6.93 billion, is estimated to be needed to replace systems; 15 percent, or $3.5 billion, is estimated to be needed to replace facilities; and 5 percent, or $1.3 billion, is estimated to be needed to replace guideway. Fifty-four percent of the $23.8 billion, or $12.8 billion, is estimated to be for heavy rail assets, 33 percent, or $7.9 billion, is estimated to be for bus assets and 8 percent, or $2.2 billion, is estimated to be for commuter rail assets.
|
Exhibit 7-15 shows the backlog according to asset type. Forty-nine percent of the backlog, or $13.7 billion, is for vehicles; 25 percent, or $6.9 billion, is for systems; and 13 percent, or $3.5 billion, is for facilities. The backlogs for vehicles, stations, facilities, and guideway have decreased since the last report. The decrease in the backlog for vehicles resulted from vehicle replacements. The percentage of overage bus vehicles declined from 19 to 15 percent of the fleet, and the percentage of overage bus vehicles declined from 37 to 34 percent of the fleet. The station backlog decreased because underground stations were assumed to be rehabilitated only and never replaced. The facility backlog decreased due to a decline in the average facility replacement cost as a result of assigning lower replacement costs to smaller facilities. The only asset for which the estimated backlog increased was systems. The backlog by mode is provided in Exhibit 7-16. Eighty-seven percent of the backlog is estimated to be for heavy rail and bus assets, which is consistent with the strong backlog identified for both vehicles and stations. The backlog for heavy rail is estimated to be $16.2 billion and the backlog for buses is estimated to be $8.1 billion.
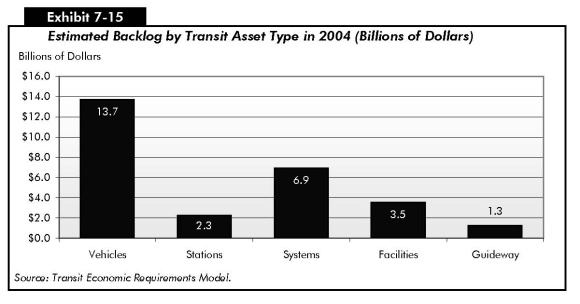
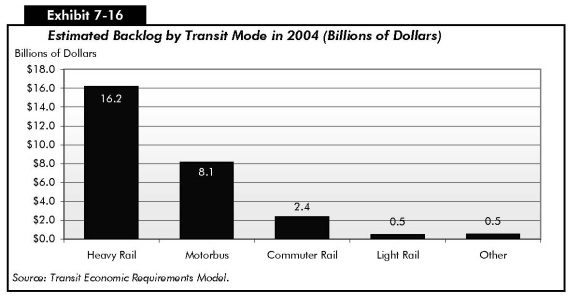
Summary of Revisions Since the 2004 C&P Report and Effects on Investment Estimates
The asset deterioration schedules for stations and systems were revised based on on-site engineering surveys conducted by FTA in 2005 and 2006, respectively. The revised deterioration schedule for stations led to a 1 percent decrease in station investment estimates. Preliminary revision to the systems deterioration schedule has been small, with a marginal effect on rail system investment estimates; on-site surveys of rail systems are continuing in 2006. A new deterioration curve for systems will be developed from the information collected in 2005 and 2006 and presented in the 2008 report.
The benefit-cost test in TERM for performance-enhancing investments was customized to provide a better reflection of the unique cost and ridership experience of each transit agency. The benefit-cost input parameters that are used to evaluate performance-enhancing investments (e.g., operating and maintenance costs, average fare and mode speed) are now specific to each agency mode. Prior to this change, the analysis used national modal averages for these parameters. These changes led to no changes in the Maintain Conditions and Performance scenario and led to a decline of roughly 10 percent in performance-enhancing investments. The congestion delay cost used by TERM was reduced to accord more closely with the 1997 Highway Cost Allocation Study and the level of congestion by population stratum. Prior to this revision, the benefit-cost analysis had assumed a single measure of congestion for all agencies. This change decreased rail investment estimates and increased nonrail investment estimates. Overall, this change led to a roughly 5 percent increase in the amount needed to maintain conditions and performance and a roughly 5 percent decrease in the amount needed to improve conditions and performance.
TERM's asset inventories for 25 of the Nation's large transit systems were updated in 2004 and 2005. These updates led to more comprehensive transit asset coverage. They follow substantial updates made for the last report with data collected by the NTD asset condition reporting modeling and from the New York Metropolitan Transportation Authority. These updates led to a very small decrease in the amount needed to maintain conditions and performance and a 0.2 percent decrease in the amount needed to improve conditions and performance. They also led to a revision in estimated replacement cost of smaller maintenance facilities.
The methodology used to estimate generated assets, i.e., assets for which no data exist in TERM, was revised to be dynamically based on NTD data for route miles, track miles, number of crossings, maintenance facilities, and stations for each agency mode. These revisions led to a small overall increase in investment estimates, primarily for rehabilitation and replacement, and increased FTA's estimate of bus guideway and number of bus and rail maintenance facilities, particularly in smaller urbanized areas.
Annual projected PMT growth was increased from an average annual rate of 1.50 percent to 1.57 percent, based on a survey of 92 agencies (compared with 76 agencies for the 2004 report). This slight increase in the projected demand for transit services exerted a very slight upward pressure on the amounts needed for asset expansion to maintain and improve performance. Projected PMT growth rates have increased slightly for six FTA regions and decreased slightly for four regions since the last survey of PMT forecasts was made for the 2004 report. Projected PMT growth rates varied according to region, ranging from 0.98 to 2.86 percent. The increase in projected PMT had a marginal positive effect on TERM's capital needs estimates.
Rehabilitation and replacement assumptions were revised for guideway and stations. The investment estimates in this report assume that underground tunnels are never replaced and receive annual capital maintenance. Investment estimates in earlier reports assumed that underground tunnels were replaced every 100 years. The investment estimates in this report are based on the assumption that all stations are rehabilitated every 35 years; investment estimates in earlier reports were based on the assumption that subway stations were replaced every 70 years and that all other stations were rehabilitated every 40 years. These revisions resulted from a comparison of TERM's investment estimates with those of NYCT (New York City Transit), which revealed that TERM was overpredicting NYCT's investment by replacing large segments of NYCT tunnels and its subway stations. These revisions had significant downward effects on investment estimates for guideway and stations.
The replacement life condition threshold for guideway was increased. Investment estimates in the current report assume that guideway is replaced when it reaches a condition of 1.75. Investment estimates in earlier reports assumed that guideway would not be replaced until it reached a condition of 1.5. This is the lowest replacement threshold used by TERM and will be subject to further review.