


System Characteristics: Transit
Transit system coverage, capacity, and use in the United States continued to increase between 2002 and 2004. In 2004, there were 640 transit operators serving urbanized areas, of which 600 were public agencies. A public transit provider may be a unit of a regional transportation agency, a State, a county, or a city government or it may be independent. In 2002, the most recent year for which information is available, there were 4,836 providers of special services to older adults and persons with disabilities receiving Federal Transit Administration (FTA) funds; and in 2000, the most recent year for which information is available, there were 1,215 transit operators serving rural areas.
In 2004, transit agencies in urban areas operated 120,659 vehicles (5 percent more than in 2002) of which 92,520 were in areas of more than 1 million people. Rail systems comprised 10,892 miles of track and 2,961 stations. There were 793 bus and rail maintenance facilities and 2,961 stations in urban areas, compared with 769 maintenance facilities and 2,862 stations in 2002. The most recent survey of rural operators in 2000 estimated that 19,185 transit vehicles operated in rural areas. The FTA estimates that in 2002 there were 37,720 special service transit vehicles for older adults and persons with disabilities, of which 16,219 were funded by FTA.
In 2004, transit systems operated 226,402 directional route miles, of which 216,620 were nonrail and 9,782 were rail route miles. Total route miles decreased by 3.8 percent between 2002 and 2004. Nonrail route miles decreased by 4.1 percent and rail route miles increased by 3.1 percent during this period.
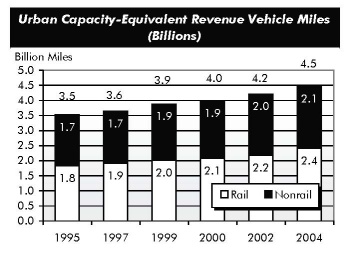
Transit revenue miles adjusted for capacity increased by 3.9 percent between 2002 and 2004. Rail capacity increased by 6.1 percent and nonrail capacity by 1.3 percent. Rail provided 2.4 billion capacity-equivalent miles in 2004, and nonrail provided 2.1 billion miles.
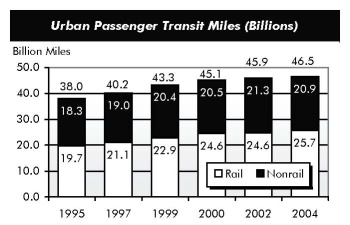
Transit passenger miles traveled (PMT) increased by 1.3 percent between 2002 and 2004, from 45.9 billion to 46.5 billion. PMT traveled on nonrail modes decreased from 21.3 billion in 2002 to 20.9 billion in 2004, or by 2.1 percent. PMT on rail transit modes increased from 24.6 billion in 2002 to 25.7 billion in 2004, or by 4.3 percent.
In 2004, 41 percent of PMT was on motorbus, 31 percent was on heavy rail, 21 percent was on commuter rail, and 3 percent was on light rail. The remaining modes accounted for 4 percent.