Systems Conditions: Highways and Bridges
Poor road surfaces impose costs on the traveling public in the form of increased wear and tear on vehicle suspensions and tires, delays associated with vehicles slowing to avoid potholes, and crashes resulting from unexpected changes in surface conditions. While highway agencies generally consider a variety of pavement distresses in assessing their overall condition, surface roughness most directly affects the ride quality experienced by drivers.
In 2004, 44.2 percent of travel on arterials and collectors for which data are available occurred on pavements with "good" ride quality, up from 39.8 percent in 1995. The percentage of VMT on roads with "acceptable" ride quality (a lower standard that includes roads classified as "good") fell from 86.6 percent to 84.9 percent over the same period of time.

Pavement ride quality is generally better on higher functional class roads and is better in rural areas than in urban areas. For example, approximately 97.8 percent of rural Interstate VMT in 2004 was on pavements with acceptable ride quality, compared with 72.4 percent for urbanized collectors.
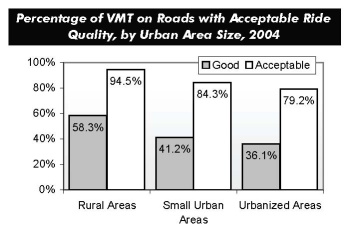
In 2004, 58.3 percent of rural VMT occurred on roads with good ride quality, while 94.5 percent occurred on roads with acceptable ride quality. The comparable percentages for VMT in small urban areas were 41.2 percent good and 84.3 percent acceptable; for VMT in urbanized areas, 36.1 percent was on pavements with good ride quality, while 79.2 percent had acceptable ride quality.

Most bridges are inspected every 2 years and receive ratings based on the condition of various bridge components. Two terms used to summarize bridge deficiencies are "structurally deficient" and "functionally obsolete." Structural deficiencies are characterized by deteriorated conditions of significant bridge elements and reduced load-carrying capacity. Functional obsolescence is a function of the geometrics of the bridge not meeting current design standards. Neither type of deficiency indicates that a bridge is unsafe. Rural bridges tend to have a higher percentage of structural deficiencies, while urban bridges have a higher incidence of functional obsolescence due to rising traffic volumes. The percentage of bridges classified as deficient fell from 27.5 percent in 2002 to 26.7 percent in 2004. Most of this decline was the result of reductions in the percent of structurally deficient bridges.
| Year | 2002 | 2004 | |
|---|---|---|---|
| Rural Bridges | Structurally Deficient | 15.1% | 14.4% |
| Functionally Obsolete | 11.4% | 11.0% | |
| Total Deficiencies | 26.5% | 25.4% | |
| Urban Bridges | Structurally Deficient | 9.2% | 8.8% |
| Functionally Obsolete | 21.9% | 21.6% | |
| Total Deficiencies | 31.2% | 30.4% | |
| Total Bridges | Structurally Deficient | 13.7% | 13.1% |
| Functionally Obsolete | 13.8% | 13.6% | |
| Total Deficiencies | 27.5% | 26.7% |

