


Operational Performance: Highways
Congestion on the Nation's highways imposes significant costs on drivers and society as a whole in the form of added travel time, vehicle operating costs, and emissions. Congestion results when traffic demand approaches or exceeds the available capacity of the highway system. It is clear that traffic demands vary significantly by time of day, day of the week, season of the year, and for special events. However, the available capacity at any given time is also variable, affected by weather, work zones, traffic incidents, and other nonrecurring events. Of the total congestion experienced by Americans, it is estimated that roughly half is "nonrecurring," associated with temporary disruptions in traffic demand and/or in available capacity.
There is no universally accepted definition or measurement of exactly what constitutes a congestion "problem," and this report uses a variety of different metrics to explore different aspects of congestion. The Texas Transportation Institute (TTI) has computed data for the FHWA for several measures, based on data for all 428 urbanized areas in 2004. (Note that the values shown for these same measures in TTI's 2005 Urban Mobility Study are different, since that study was based on a subset of 85 urbanized areas that is weighted more heavily to the most heavily populated areas.)
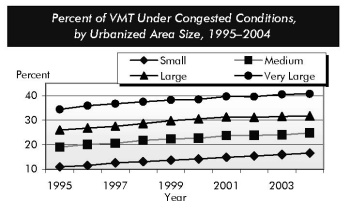
The Average Daily Percent of VMT under Congested Conditions is an indicator of the portion of daily traffic on freeways and other principal arterials in an urbanized area that moves at less than free-flow speeds. This percentage increased from 25.9 percent to 31.6 percent from 1995 to 2004 for the average urbanized area, and rose for each of four subsets based on population size reported by TTI; Small (population less than 500,000) rose from 15.4 percent to 16.6 percent, Medium (population 500,000 to 999,999) rose from 19.0 percent to 24.8 percent, Large (population 1 million to 3 million) rose from 26.0 percent to 31.7 percent, and Very Large (population greater than 3 million) rose from 34.4 percent to 40.7 percent. While the percent of VMT under congested conditions rose from 2002 to 2004, it rose at a lower rate than it had from 1995 to 2002.
The Average Length of Congested Conditions, a measure of the typical duration of congested travel conditions in urbanized areas, stabilized at approximately 6.6 hours per day in 2002 and 2004, after rising from 5.9 hours per day in 1995.
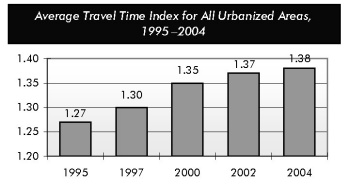
The Travel Time Index measures the amount of additional time required to make a trip during the congested peak travel period, rather than at other times of the day. The average travel time index for all urbanized areas for 2004 was 1.38, indicating that congestion caused travel times to be 38 percent longer. This is up slightly from the 1.37 value reported for 2002; the value for 1995 was 1.27.
In 2004, the average delay experienced by the peak period travelers for all urbanized areas was 45.7 hours, up slightly from 45.4 hours in 2002. The average annual delay per capita (including all residents of a given area, not just peak travelers) rose from 23.8 hours in 2002 to 24.4 hours in 2004.