


Comparison of Spending and Investment Scenario Estimates: Transit
Transit capital expenditures from Federal, State, and local governments totaled $12.6 billion in 2004, below the annual investment amounts estimated by the TERM scenarios for the 20-year period from 2005–2024. The annual capital investment estimated by the Maintain Conditions and Performance scenario is $15.8 billion, 25 percent above actual spending in 2004. The investment estimated by the Improve Conditions and Performance scenario is $21.8 billion, 73 percent above actual 2004 capital spending.
The gap between actual vehicle capital investment and the amount to maintain and improve the conditions of vehicle assets has widened since the last report and the gap between actual nonvehicle asset investment and the amount to maintain and improve the conditions of nonvehicle assets has declined, in part, due to a decrease in the share of capital spending on vehicles from 31 percent in 2002 to 27 percent in 2004, and an increase in the share of capital spending on nonvehicles from 69 to 73 percent.
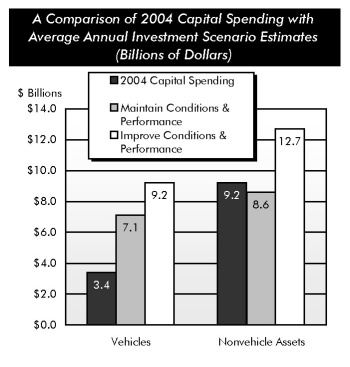
The estimated average annual amount to maintain the conditions and performance of the Nation's transit vehicle assets of $7.1 billion is 109 percent above actual spending of $3.4 billion in 2002. The estimated average annual amount to improve conditions and performance of transit vehicles is $9.2 billion, 171 percent above the 2004 investment.
The average annual amount to maintain the conditions and performance of the Nation's nonvehicle transit infrastructure of $8.6 billion is 7 percent below the $9.2 billion spent in 2004. The average annual amount to improve the conditions and performance of the nonvehicle infrastructure is $12.7 billion, 38 percent above actual spending in 2004.
In addition to continually replacing existing transit assets, the annual investment scenarios estimates include the expansion of existing assets to meet projected demand and improve operational performance. To maintain performance, TERM estimates that an additional 26,000 buses and 5,500 rail vehicles would need to be purchased between 2005 and 2024 to meet a projected ridership growth of 1.57 percent. This would be roughly a 24 percent increase in the 2004 bus fleet size, and a 21 percent increase in the 2004 rail fleet size. To improve performance, TERM estimates that an additional 3,000 rail vehicles would be needed, or about a 12 percent increase in the 2004 rail fleet size.
The gap between the annual investment estimated by the Maintain Conditions and Performance scenario and actual investment is similar to what was reported in the 2004 edition. The gap between the annual investment estimated by the Improve Conditions and Performance scenario and actual investment is about 20 percent lower than reported in the 2004 report due to a decrease in the estimate required to improve conditions and performance. This decline was primarily due to a decrease in investment needed to improve performance resulting from a reduction in the assumed hourly cost of congestion delay.