


Impacts of Investment: Highways and Bridges
Spending by all levels of government on system rehabilitation rose by 58.0 percent between 1997 and 2004, from $23.0 billion to $36.4 billion. This increased investment in roadway resurfacing and reconstruction and bridge rehabilitation and replacement is reflected in the increases in the percent of VMT occurring on pavements with good ride quality and the decreases in bridge deficiencies that are described in Chapter 3.
Investment in system expansion has also increased from 1997 to 2004, but at a much lower rate relative to outlays for system preservation. While the rate of deterioration in various measures of operational performance has decreased, the level of investment has not stopped the overall growth in congestion levels that is described in Chapter 4.
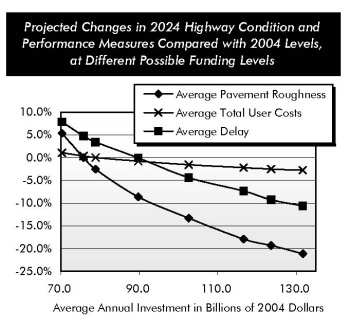
If annual highway capital investment from 2005 to 2024 averages the $131.7 billion (in constant 2004 dollars) level specified by the "Maximum Economic Investment" scenario, and is applied in the manner suggested (devoting a larger share of investment toward capacity expansion to address congestion problems), then average highway user costs would be expected to decline by 2.8 percent per VMT in constant dollar terms. While this percentage appears relatively low, by the year 2024 it would translate into approximately $116 billion in annual user cost savings. (There is a practical limit on the ability of highway investments to cause dramatic reductions in total user costs, since they include the time costs associated with getting from point A to point B in uncongested conditions). Average delay per VMT would decline by 10.6 percent under the "Maximum Economic Investment" scenario. (Delay due to incidents would decline much more sharply, as the level of future investments in operations and intelligent transportation systems assumed in these scenarios would have a greater effect on nonrecurring delay.) Average pavement ride quality would be expected to improve by 21.1 percent relative to 2004 levels.
If all levels of government combined invested at the projected Cost to Maintain level of $78.8 billion, average highway user costs in 2024 would by definition match those in 2004. Average pavement ride quality would improve by 2.5 percent, while delay per VMT would worsen by 3.4 percent.
The amount of travel growth on a highway segment may be affected by the level of investment on that segment. Investments that reduce the economic cost of using the facility will tend to encourage additional use, while increasing congestion on an unimproved roadway can cause travel growth to be lower than it otherwise would be. The travel growth forecasts used in the analysis of highway investment in this report are dynamic, in the sense that they allow feedback between the level of future investment and future VMT growth.
Relative to previous editions, the difference between the projected average annual VMT growth rate in the two scenarios is narrower (1.94 percent versus 1.88 percent), due to the imposition of user charges to cover the increased spending associated with each scenario.