


- Highway Safety
- Overall Fatalities and Injuries
- Fatalities by Functional Class
- Highway Fatalities by Major Crash Type or Contributing Factors
- Roadway Departures
- Intersections
- Pedestrians and Other Nonmotorists
- Speeding
- Alcohol
- Unbelted Occupants
- Crashes by Vehicle Type
- Crashes by Age Group
- Transit Safety
- Comparison
Highway Safety
This section describes the safety of the Nation's highway system. It looks at fatalities and injuries on highway functional systems, across vehicle types, and among different segments of the population. It also examines the causes and costs of fatal crashes.
Three operating administrations within the DOT have responsibility for addressing highway safety. The Federal Highway Administration (FHWA) focuses on infrastructure safety design and operations. The National Highway Traffic Safety Administration (NHTSA) has responsibility for overseeing vehicle safety standards and administering driver behavior programs. The Federal Motor Carrier Safety Administration (FMCSA) has the mission to reduce crashes, injuries, and fatalities involving large trucks and buses.
Statistics in this section are primarily drawn from the Fatality Analysis Reporting System (FARS). The FARS is maintained by NHTSA, which has a cooperative agreement with an agency in each State to provide information on all qualifying crashes in that State. Police accident reports, death certificates, and other documents provide data that are tabulated daily and included in the FARS. The statistics represent a "snapshot in time" during the preparation of this report, which is why they may not precisely correspond to reports completed during the same year. Information was compiled during the summer of 2008.
NHTSA publishes an annual Traffic Safety Facts report that comprehensively describes safety characteristics on the highway transportation network.
Overall Fatalities and Injuries
Exhibit 5-1 describes the considerable improvement in highway safety since Federal legislation first addressed the issue in 1966. That year, the fatality rate was 5.50 per 100 million VMT. By 2006, the fatality rate had declined to 1.41 per 100 million VMT. This sharp decline in the fatality rate occurred even as the number of licensed drivers nearly doubled.
| Year | Fatalities | Resident Population (Thousands) | Fatality Rate per 100,000 Population | Licensed Drivers (Thousands) | Fatality Rate per 100 Million VMT | Injured | Injury Rate per 100,000 Population | Injury Rate per 100 Million VMT |
|---|---|---|---|---|---|---|---|---|
| 1966 | 50,894 | 196,560 | 25.89 | 100,998 | 5.50 | |||
| 1968 | 52,725 | 200,706 | 26.27 | 105,410 | 5.20 | |||
| 1970 | 52,627 | 205,052 | 25.67 | 111,543 | 4.74 | |||
| 1972 | 54,589 | 209,896 | 26.01 | 118,414 | 4.30 | |||
| 1974 | 45,196 | 213,854 | 21.13 | 125,427 | 3.50 | |||
| 1976 | 45,523 | 218,035 | 20.88 | 134,036 | 3.25 | |||
| 1978 | 50,331 | 222,585 | 22.61 | 140,844 | 3.26 | |||
| 1980 | 51,091 | 227,225 | 22.48 | 145,295 | 3.35 | |||
| 1982 | 43,945 | 231,664 | 18.97 | 150,234 | 1.76 | |||
| 1984 | 44,257 | 235,825 | 18.77 | 155,424 | 2.57 | |||
| 1986 | 46,087 | 240,133 | 19.19 | 159,486 | 2.51 | |||
| 1988 | 47,087 | 244,499 | 19.26 | 162,854 | 2.32 | 3,416,000 | 1,397 | 169 |
| 1990 | 44,599 | 249,439 | 17.88 | 167,015 | 2.08 | 3,231,000 | 1,295 | 151 |
| 1992 | 39,250 | 254,995 | 15.39 | 173,125 | 1.75 | 3,070,000 | 1,204 | 137 |
| 1994 | 40,716 | 260,327 | 15.64 | 175,403 | 1.73 | 3,266,000 | 1,255 | 139 |
| 1996 | 42,065 | 265,229 | 15.86 | 179,539 | 1.69 | 3,483,000 | 1,313 | 140 |
| 1998 | 41,501 | 270,248 | 15.36 | 184,980 | 1.58 | 3,192,000 | 1,181 | 121 |
| 2000 | 41,945 | 282,192 | 14.86 | 190,625 | 1.53 | 3,189,000 | 1,130 | 116 |
| 2002 | 43,005 | 288,126 | 14.93 | 194,602 | 1.51 | 2,926,000 | 1,015 | 102 |
| 2004 | 42,836 | 293,638 | 14.59 | 198,889 | 1.44 | 2,788,000 | 950 | 94 |
| 2006 | 42,642 | 299,398 | 14.24 | 202,810 | 1.41 | 2,575,000 | 860 | 85 |
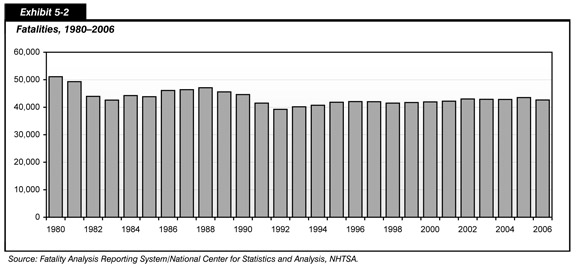
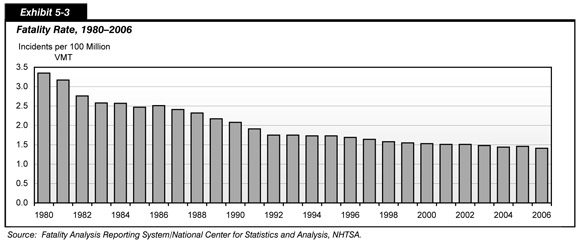
The overall number of traffic deaths also decreased between 1966 and 2006. In 1966, there were 50,894 traffic deaths. Fatalities reached their highest point in 1972 (54,589), then declined sharply following the implementation of a national speed limit, reaching their lowest point in 1992 (39,250). Since 1992, there has been more limited progress in reducing the number of fatalities. The number of fatalities generally increased year-to-year from 1992 to 2006, when 42,642 Americans lost their lives in crashes. Exhibit 5-2 and Exhibit 5-3 compare the number of fatalities with fatality rates between 1980 and 2006.
The overall number of traffic-related injuries also decreased between 1988 and 2006, from 3,416,000 to 2,575,000. Injuries increased between 1992 and 1996, but have steadily declined since then. In 1988, the injury rate was 169 per 100 million VMT; by 2006, the number had dropped to 85 per 100 million VMT.
Fatalities by Functional Class
Exhibit 5-4 and Exhibit 5-5 show the number of fatalities and fatality rates by rural and urban functional system between 1997 and 2006. These exhibits show the distinction between fatalities and fatality rate; fatality rate expresses fatalities in terms of VMT, so an increase in the overall number of fatalities does not necessarily translate into an increase in the fatality rate.
As shown in Exhibit 5-4, the absolute number of fatalities grew slightly between 1997 and 2006, from 42,013 to 42,642 deaths. During this period, the number of fatalities on urban roads grew from 16,829 to 18,359 (about 43 percent of total fatalities). At the same time, the number of fatalities on rural roads decreased from 25,135 to 23,339 (about 57 percent of all fatalities). The fatality rate, however, decreased on both urban and rural roads, due to a significant increase in VMT, as well as to the other crash factors discussed later in this chapter.
| Functional System | 1997 | 2000 | 2002 | 2004 | 2005 | 2006 |
|---|---|---|---|---|---|---|
| Rural Areas (under 5,000 in population) | ||||||
| Interstate | 3,040 | 3,254 | 3,298 | 3,227 | 3,248 | 2,870 |
| Other Principal Arterial | 5,394 | 4,917 | 4,894 | 5,167 | 4,821 | 4,491 |
| Minor Arterial | 4,284 | 4,090 | 4,467 | 5,043 | 4,483 | 4,277 |
| Major Collector | 5,920 | 5,501 | 6,014 | 5,568 | 5,757 | 5,628 |
| Minor Collector | 1,723 | 1,808 | 2,003 | 1,787 | 1,635 | 1,614 |
| Local | 4,450 | 4,414 | 5,059 | 4,162 | 4,443 | 4,219 |
| Unknown Rural | 324 | 854 | 161 | 225 | 200 | 240 |
| Subtotal Rural Areas | 25,135 | 24,838 | 25,896 | 25,179 | 24,587 | 23,339 |
| Urban Areas (5,000 or more in population) | ||||||
| Interstate | 2,292 | 2,419 | 2,482 | 2,602 | 2,734 | 2,619 |
| Other Freeway and Expressway | 1,296 | 1,364 | 1,506 | 1,673 | 1,735 | 1,653 |
| Other Principal Arterial | 5,420 | 4,948 | 5,124 | 4,847 | 5,364 | 5,299 |
| Minor Arterial | 3,523 | 3,211 | 3,218 | 3,573 | 3,836 | 3,720 |
| Collector | 1,163 | 1,001 | 1,151 | 1,385 | 1,426 | 1,478 |
| Local | 3,064 | 2,912 | 3,497 | 3,290 | 3,458 | 3,540 |
| Unknown Urban | 71 | 258 | 35 | 211 | 74 | 50 |
| Subtotal Urban Areas | 16,829 | 16,113 | 17,013 | 17,581 | 18,627 | 18,359 |
| Unknown Rural or Urban | 49 | 994 | 96 | 76 | 296 | 944 |
| Total Highway Fatalities | 42,013 | 41,945 | 43,005 | 42,836 | 43,510 | 42,642 |
Exhibit 5-5 shows the decrease in fatality rate on every urban and rural functional system between 1997 and 2006. Urban Interstate highways were the safest functional system, with a fatality rate of 0.55 per 100 million VMT in 2006. Minor arterials, however, recorded the sharpest decline in fatality rates. The fatality rate for minor arterials in 2006 was 21.7 percent lower than in 1997.
| Functional System | 1997 | 2000 | 2002 | 2004 | 2005 | 2006 |
|---|---|---|---|---|---|---|
| Rural Areas (under 5,000 in population) | ||||||
| Interstate | 1.27 | 1.21 | 1.18 | 1.21 | 1.27 | 1.11 |
| Other Principal Arterial | 2.36 | 1.98 | 1.90 | 2.15 | 2.07 | 1.94 |
| Minor Arterial | 2.62 | 2.38 | 2.53 | 2.99 | 2.74 | 2.63 |
| Major Collector | 2.93 | 2.62 | 2.82 | 2.78 | 2.99 | 2.91 |
| Minor Collector | 3.29 | 3.14 | 3.26 | 2.97 | 2.80 | 2.78 |
| Local | 3.94 | 3.47 | 3.67 | 3.15 | 3.45 | 3.17 |
| Subtotal Rural | 2.52 | 2.29 | 2.30 | 2.36 | 2.38 | 2.25 |
| Urban Areas (5,000 or more in population) | ||||||
| Interstate | 0.63 | 0.61 | 0.61 | 0.57 | 0.58 | 0.55 |
| Other Freeway and Expressway | 0.81 | 0.77 | 0.79 | 0.80 | 0.81 | 0.76 |
| Other Principal Arterial | 0.91 | 0.81 | 0.79 | 0.79 | 0.83 | 0.80 |
| Minor Arterial | 1.80 | 1.53 | 1.51 | 1.33 | 1.44 | 1.41 |
| Collector | 0.89 | 0.74 | 0.81 | 0.85 | 0.84 | 0.85 |
| Local | 1.43 | 1.24 | 1.46 | 1.28 | 1.31 | 1.33 |
| Subtotal Urban | 1.08 | 0.97 | 0.98 | 0.93 | 0.95 | 0.93 |
| Total Highway Fatality Rate | 1.64 | 1.53 | 1.51 | 1.44 | 1.46 | 1.41 |
| What steps are being taken to improve safety on the Nation's rural roads? | |
|
In February 2008, the U.S. Department of Transportation announced a Rural Safety Initiative that targets resources to reduce the number of crashes on the Nation's rural roads. The Rural Safety Initiative has five key areas.
First, the initiative focuses on safe driving. The National Highway Traffic Safety Administration (NHTSA) will fund four demonstration projects in rural communities to either improve safety belt use or increase the deployment of ignition interlocks to combat drunk driving by repeat offenders. NHTSA has published guidelines on sobriety checkpoints, and is developing performance standards to protect occupants during rollover crashes. The Federal Motor Carrier Safety Administration, meanwhile, is working with States to improve the safety of commercial vehicles on rural roadways and include a component on rural commercial vehicle safety in each State's annual Commercial Vehicle Safety Plan.
Second, the initiative aims to create better roads. Among other activities, this Department goal is encouraging States to tap the underutilized High Risk Rural Road program. The Department will also use $9.2 million in FY 2008 funding for the Delta Region Transportation Development Program for innovative safety measures in the Delta region.
Third, the initiative aims to develop smarter roads. The Department will continue to advance critical research that can help States and localities design smarter highways. As an example, the Research and Innovative Technology Administration will target $6 million in Intelligent Transportation Systems (ITS) funding toward rural road safety.
Fourth, the initiative aims to better train emergency responders. In 2008, for instance, NHTSA will initiate a grant program that better clarifies data sent from a cell phone and determines the location of a caller. NHTSA is also developing National Trauma Field Triage Protocols so that emergency personnel can better transport seriously injured patients to trauma centers.
Finally, the Department will improve outreach and partnerships to rural transportation stakeholders.
|
|
The fatality rate decreased by 10.7 percent on rural roads between 1997 and 2006. The fatality rate decreased sharply on urban minor arterials, although rural minor arterials was the one segment of the rural functional system in which the fatality rate rose between 1997 and 2006, from 2.62 to 2.63 deaths per 100 million VMT.
Despite the overall decrease in fatality rate on both urban and rural functional systems, rural roads are far more dangerous than their urban counterparts. The fatality rate for rural functional systems was 141.9 percent higher in 2006 than on urban functional systems, with lower-level local roads having the highest fatality rate of any functional system. There are a number of factors that collectively result in this rural road safety challenge. These may include limited right-of-way, which can result in greater curvature and obstacles close to the roadway, and higher levels of speeding on non-separated roadways.
There were a total of 5,973,000 crashes reported in 2006. Only a small percentage of these crashes, 0.6 percent, were severe enough to result in a fatality, while 70.1 percent of these crashes resulted in property damage only, as shown in Exhibit 5-6.
| Year | Crash Severity | Total Crashes | ||||||
|---|---|---|---|---|---|---|---|---|
| Fatal | Injury | Property Damage Only | ||||||
| Number | Percent | Number | Percent | Number | Percent | Number | Percent | |
| 1997 | 37,324 | 0.6 | 2,149,000 | 32.4 | 4,438,000 | 67.0 | 4,438,000 | 100.0 |
| 1998 | 37,107 | 0.6 | 2,029,000 | 32.0 | 4,269,000 | 67.4 | 6,335,000 | 100.0 |
| 1999 | 37,140 | 0.6 | 2,054,000 | 32.7 | 4,188,000 | 66.7 | 6,279,000 | 100.0 |
| 2000 | 37,526 | 0.6 | 2,070,000 | 32.4 | 4,286,000 | 67.0 | 6,394,000 | 100.0 |
| 2001 | 37,862 | 0.6 | 2,003,000 | 31.7 | 4,282,000 | 67.7 | 6,323,000 | 100.0 |
| 2002 | 38,491 | 0.6 | 1,929,000 | 30.5 | 4,348,000 | 68.8 | 4,349,000 | 100.0 |
| 2003 | 38,477 | 0.6 | 1,925,000 | 30.4 | 4,365,000 | 69.0 | 6,328,000 | 100.0 |
| 2004 | 38,444 | 0.6 | 1,862,000 | 30.1 | 4,281,000 | 69.3 | 6,181,000 | 100.0 |
| 2005 | 39,252 | 0.6 | 1,816,000 | 29.5 | 4,304,000 | 69.9 | 6,159,000 | 100.0 |
| 2006 | 38,588 | 0.6 | 1,746,000 | 29.2 | 4,189,000 | 70.1 | 5,973,000 | 100.0 |
Highway Fatalities by Major Crash Type or Contributing Factors
When a crash occurs, it is generally the result of numerous contributing factors. Combinations of driver, roadway, and vehicle factors all have an impact on the safety of the Nation's highway system.
The FHWA is focused on reducing four types of roadway-related crashes: roadway departures, intersections, pedestrian-related crashes, and speeding. Exhibit 5-7 shows data for these crash types between 1997 and 2006. These categories are not mutually exclusive; the fatalities shown in Exhibit 5-7 can involve a combination of factors—intersection and pedestrian-related, for example—so that some fatalities will appear in more than one category.
| 1997 | 2000 | 2002 | 2004 | 2005 | 2006 | |
|---|---|---|---|---|---|---|
| Roadway Departures | 22,741 | 23,046 | 25,412 | 25,805 | 25,477 | 24,806 |
| Intersection-Related | 9,093 | 8,689 | 9,273 | 9,273 | 9,238 | 8,797 |
| Pedestrian-Related | 5,321 | 4,763 | 4,851 | 4,675 | 4,892 | 4,784 |
| Speeding-Related | 13,188 | 12,552 | 13,799 | 13,291 | 13,583 | 13,543 |
Roadway Departures
In 2006, there were 24,806 fatalities related to a vehicle leaving its lane and crashing. In some cases, the vehicle crossed the centerline and struck another vehicle, hitting it head-on or sideswiping it. In other cases, the vehicle left the roadway and struck one or more man-made or natural objects, such as utility poles, embankments, guardrails, trees, or parked vehicles.
Roadway departures occur because of human factors, roadway design factors, or environmental factors. Human factors include driving while intoxicated, driver fatigue, and drowsiness; and these factors can contribute to roadway departures. It is widely recognized that drunk drivers can create hazardous driving conditions. Surprisingly, a drowsy driver can be as dangerous as a drunk driver. In other cases, drivers are inattentive, careless, or distracted, drifting out of the lane and off the road. Visibility also is an issue. The majority of roadway departure crashes happen at night.
About two-thirds of roadway departure fatalities occur on rural roads. Rural highways are often not as well-lit as urban roadways or could include design factors such as narrow travel lanes, sharp roadway curvatures, or unimproved shoulders. Environmental factors including inclement weather such as fog, snow, smoke, or dust storms can also decrease the visibility of pavement markings or roadway curvature. In these conditions, or a combination of these conditions, run-off-road crashes can increase.
Of the 24,806 roadway departure fatalities that occurred in 2006, about 43.1 percent involved the rollover of a passenger vehicle. As shown in Exhibit 5-8, the total number of passenger vehicle occupant fatalities in rollovers has steadily increased, from 9,527 in 1997 to 10,698 in 2006 (a rise of about 12.3 percent). While the number of occupant fatalities in rollovers among passenger cars decreased slightly, from 4,765 in 1997 to 4,352 in 2006 (a 8.7 percent decrease), the number of occupant fatalities in rollovers among light (sport) utility trucks nearly doubled, growing from 1,489 in 1997 to 2,888 in 2006 (an increase of 93.9 percent). The number of occupant fatalities in rollovers among pickup trucks for the same period increased by 12.7 percent (from 2,479 in 1997 to 2,840 in 2006). Among vans, fatalities related to rollover crashes decreased by 21.3 percent (from 768 in 1997 to 604 in 2006).
| Fatalities | Registered Passenger Vehicles | Fatality Rate per 100,000 Registered Vehicles |
|
|---|---|---|---|
| 1997 | |||
| Passenger Cars | 4,765 | 124,672,920 | 3.82 |
| Light Pickup Trucks | 2,479 | 34,314,455 | 7.22 |
| Light Utility Trucks | 1,489 | 14,531,850 | 10.25 |
| Vans | 768 | 16,159,473 | 4.75 |
| Other Light Trucks | 26 | 2,281,692 | 1.14 |
| Total | 9,527 | 191,960,390 | 4.96 |
| 2006 | |||
| Passenger Cars | 4,352 | 136,866,137 | 3.18 |
| Light Pickup Trucks | 2,840 | 40,678,320 | 6.98 |
| Light Utility Trucks | 2,888 | 37,168,577 | 7.77 |
| Vans | 604 | 19,491,830 | 3.10 |
| Other Light Trucks | 14 | 890,532 | 1.57 |
| Total | 10,698 | 235,095,396 | 4.55 |
| Percent Change | 12.3% | 22.5% | |
Among the vehicles that rolled over, the occupant fatality rates for light (sport) utility trucks were the highest, followed by the rates for light pickup trucks, vans, and passenger cars. In 2006, in fatal crashes where a rollover occurred, the occupant fatality rate per 100,000 registered vehicles for light trucks was 7.77, 6.98 for light pickup trucks, 3.10 for vans, and 3.18 for passenger cars.
Intersections
Of the 42,642 fatalities that occurred in 2006, about 21 percent—8,797—were related to intersections. FARS contains information on the functional system where 8,580 of these fatalities occurred, of which 39.7 percent occurred at rural intersections and 60.3 percent at urban intersections, as shown in Exhibit 5-9.
| Fatalities | ||
|---|---|---|
| Count | Percent of Total | |
| Rural Areas (under 5,000 in population) | ||
| Principal Arterials | 1,007 | 11.7% |
| Minor Arterials | 739 | 8.6% |
| Collectors (Major and Minor) | 1,047 | 12.2% |
| Locals | 614 | 7.2% |
| Subtotal Rural Areas | 3,407 | 39.7% |
| Urban Areas (5,000 or more in population) | ||
| Principal Arterials | 2,367 | 27.6% |
| Minor Arterials | 1,336 | 15.6% |
| Collectors (Major and Minor) | 447 | 5.2% |
| Locals | 1,023 | 11.9% |
| Subtotal Urban Areas | 5,173 | 60.3% |
| Total Highway Fatalities* | 8,580 | 100.0% |
Intersection incidents account for more than 45 percent of all reported crashes and approximately 50 percent of all injuries. Older drivers and pedestrians are particularly at risk at intersections; half of the fatal crashes for drivers aged 80 or older and about one-third of the pedestrian deaths among people aged 70 or older occurred at intersections.
There are over three million intersections in the United States, including both signalized and non-signalized (e.g., those controlled by stop or yield signs) and many factors may contribute to unsafe conditions at these areas. Road designs may be inadequate for current traffic levels or traffic signals may not be optimally programmed. There may also be insufficient law enforcement, prompting some drivers to ignore red lights. Approximately one-third of signalized intersection fatalities involve red-light running.
| How are Federal, State, and local transportation agencies working to improve intersection safety? | |
|
Some engineering improvements can greatly improve intersection safety. Signal visibility is important, and many States and localities are increasing the size of signal displays to increase the line of sight for drivers. Rumble strips and "signal ahead" signs can also make drivers aware of an upcoming intersection. In many places, transportation officials are also modifying traditional intersections or eliminating the need to stop by installing flashing signals or converting intersections to roundabouts.
Education and law enforcement are also very important. Red light cameras are used in many cities, including Baltimore, Chicago, Denver, New York, Phoenix, San Diego, and San Francisco.
|
|
Pedestrians and Other Nonmotorists
Exhibit 5-10 displays nonmotorist fatalities that occurred between 1997 and 2006. For the purposes of this report, the term "nonmotorist" refers to fatalities and crashes that involve pedestrians, pedalcyclists, and other nonmotorists, such as skateboarders and roller skaters.
| 1997 | 1998 | 1999 | 2000 | 2001 | 2002 | 2003 | 2004 | 2005 | 2006 | |
|---|---|---|---|---|---|---|---|---|---|---|
| Pedestrians | 5,321 | 5,228 | 4,939 | 4,763 | 4,901 | 4,851 | 4,774 | 4,675 | 4,892 | 4,784 |
| Pedalcyclists | 814 | 760 | 754 | 693 | 732 | 665 | 629 | 727 | 786 | 773 |
| Other | 153 | 131 | 149 | 141 | 123 | 114 | 140 | 130 | 186 | 183 |
| Total | 6,288 | 6,119 | 5,842 | 5,597 | 5,756 | 5,630 | 5,543 | 5,532 | 5,864 | 5,740 |
The number of nonmotorist fatalities decreased from 6,288 in 1997 to 5,740 in 2006, an 8.7 percent decrease. However, this may be because people are walking less than they used to—not because conditions are safer for pedestrians. The number of pedestrians and pedalcyclists killed has decreased over the past decade, while the number of other nonmotorists killed has increased. Still, in 2006, 83.3 percent of all nonmotorist fatalities were pedestrians. About 13.4 percent were pedalcyclists, and the remaining 3.2 percent were other nonoccupants.
Overall, the fatality rate for pedestrians was 1.6 per 100,000 population in 2006. Most pedestrian crashes occurred in 2006 in urban areas (about 74 percent). They also tend to occur at nonintersection locations (about 79 percent), during normal weather conditions (about 90 percent), and at night (roughly 79 percent).
Of the traffic crashes that resulted in pedestrian fatalities in 2006, 49 percent were alcohol-related; in other words, either the driver or the pedestrian had consumed alcohol. In 6 percent of the crashes that occurred, both driver and pedestrian had a blood alcohol concentration (BAC) of 0.08 or higher.
Speeding
Speeding is one of the most prevalent factors contributing to traffic crashes. In 2006, the National Highway Traffic Safety Administration estimates that 13,543 lives were lost in speeding-related crashes. The estimated annual economic costs of speeding-related crashes exceeded $40.4 billion in 2000. This included $10.3 billion in fatalities, $13.3 billion in injuries, and $3.8 billion in property damage.
Young males are the most likely drivers to be involved in fatal speeding-related crashes. The relative proportion of speeding-related crashes to all crashes decreases with increasing driver age. For example, in 2006, 39 percent of male drivers between the ages of 15 and 20 who were involved in fatal crashes were speeding at the time of the crash, while the comparable figure for male drivers between the ages of 35 and 44 was only 21 percent.
In 2006, 41 percent of the drivers with a BAC of 0.08 or higher involved in fatal crashes were speeding, compared with only 15 percent of drivers in fatal crashes who had not consumed alcohol. Speeding was a factor in 37 percent of fatal crashes in work zones and nearly 60 percent of roadway departure crashes on curves.
Many speeding-related crashes also occur during bad weather. Speeding was a factor in 33 percent of all crashes that occurred on wet roads in 2006. Speeding was a factor in 55 percent of the fatal crashes that occurred when there was snow or slush on the road and in 59 percent of those that occurred on icy roads.
Although much of the public concern about speed-related crashes focuses on high-speed roadways, speeding is a safety concern on all roads. In 2006, about 87 percent of speed-related fatalities occurred on roads that were not Interstate highways.
Alcohol
Alcohol-impaired driving is a serious public safety problem in the United States. In 2006, 17,602 Americans were killed in alcohol-related crashes on the Nation's highways. The National Highway Traffic Safety Administration estimates that alcohol was involved in 41 percent of fatal crashes and 9 percent of all crashes in 2006.
Exhibit 5-11 shows the number of fatalities attributable to alcohol between 1997 and 2006. There has been no consistent trend in the number of alcohol-related fatalities over the past decade. Alcohol-related fatalities declined between 1997 and 1999, increased between 1999 and 2002, declined between 2002 and 2004, and have increased since then.
| 1997 | 1998 | 1999 | 2000 | 2001 | 2002 | 2003 | 2004 | 2005 | 2006 |
|---|---|---|---|---|---|---|---|---|---|
| 16,711 | 16,673 | 16,572 | 17,380 | 17,400 | 17,524 | 17,105 | 16,919 | 17,590 | 17,602 |
In 2006, there were 13,582 fatalities in which either the driver or motorcycle operator was legally intoxicated—in other words, the operator had a BAC of 0.08 or higher. Of these fatalities, 5,319—about 39 percent—were among people between the ages of 21 and 34 years old; this was the largest of the six age groups surveyed by the NHTSA. Between 2005 and 2006, for this age demographic, the number of fatalities involved in crashes where the operator was legally intoxicated grew by about 1 percent. Using this standard, the group aged 16 to 20 was the only other age group to experience an increase in fatalities, where the number of fatalities grew by about 4 percent—from 1,586 to 1,648 deaths. Underage drinking and driving continues to be a major problem, despite years of education and law enforcement programs.
Unbelted Occupants
Safety belt use is one of the most significant factors in determining the severity of a motor vehicle crash. According to NHTSA's National Occupant Protection Use Survey, the national seat belt use rate was 81 percent in 2006. This means that about 55 million people do not use seat belts all of the time when driving or riding in motor vehicles. These results were obtained by observing traffic on roads at selected observation points.
In 2006, 30,521 occupants of passenger vehicles were killed in motor vehicle traffic crashes—72 percent of the 42,642 traffic fatalities reported for the year. Of the 28,141 passenger vehicle occupant fatalities for which restraint use was known, an estimated 15,523 (or 55 percent) were unrestrained.
In 1984, the U.S. Department of Transportation promulgated rules that phased in automatic occupant-protection systems for all automobiles. This rulemaking prompted many States to enact seat belt use laws of varying degrees. To date, 26 States and the District of Columbia have seat belt use laws that provide for primary enforcement, enabling police officers to stop vehicles and write citations whenever they observe violations of the seat belt law. Twenty-three States have laws that specify secondary enforcement (allowing officers to write a citation only after a vehicle is stopped for some other traffic infraction). One State, New Hampshire, has no adult seat belt use law.
Crashes by Vehicle Type
Exhibit 5-12 shows the breakdown of occupant fatalities by vehicle type from 1997 to 2006. The number of occupant fatalities that involved passenger cars decreased from 22,199 in 1997 to 17,800 in 2006, while occupant fatalities involving light and large trucks, motorcycles, and other vehicles all increased during this period.
| Type of Vehicle | 1997 | 2000 | 2002 | 2004 | 2005 | 2006 |
|---|---|---|---|---|---|---|
| Motorists | ||||||
| Passenger Cars | 22,199 | 20,699 | 20,569 | 19,192 | 18,512 | 17,800 |
| Light Trucks | 10,249 | 11,528 | 12,273 | 12,674 | 13,040 | 12,722 |
| Large Trucks | 723 | 754 | 689 | 766 | 804 | 805 |
| Motorcycles | 2,116 | 2,897 | 3,270 | 4,028 | 4,576 | 4,810 |
| Buses | 18 | 22 | 45 | 42 | 58 | 27 |
| Other and Unknown Vehicles | 420 | 448 | 529 | 602 | 656 | 738 |
| Nonmotorists | ||||||
| Pedestrians | 5,321 | 4,763 | 4,851 | 4,675 | 4,892 | 4,784 |
| Pedalcyclists | 814 | 693 | 665 | 727 | 786 | 773 |
| Other and Unknown | 153 | 141 | 114 | 130 | 186 | 183 |
| Total | 42,013 | 41,945 | 43,005 | 42,836 | 43,510 | 42,642 |
The number of occupant fatalities in light trucks increased sharply between 1997 and 2006. Fatalities in these vehicles increased from 10,249 in 1997 to 12,722 in 2006, or an increase of 24.1 percent. There were 856,896 light truck occupants injured in 2006, up from 754,820 in 1997.
The number of occupant fatalities in large trucks increased 11.3 percent, from 723 in 1997 to 805 in 2006. There were 22,815 large truck occupants injured in 2006. However, the number of all other vehicle occupants killed in crashes involving a large truck decreased by 10.8 percent, from 4,223 in 1997 to 3,766 in 2006. Occupants of large trucks are less than 2 percent of all highway fatalities, but others killed in crashes involving large trucks are 10 percent of all highway fatalities.
The most significant increase in fatalities among vehicle types involved those who ride motorcycles. The number of motorcyclists who died in crashes increased 127.3 percent between 1997 and 2006, from 2,116 to 4,810.
Motorcycle crashes are frequently speed-related. Speed is two times more likely to be a factor in fatal motorcycle crashes than in passenger car or light truck crashes. Studies also have shown that alcohol is more likely to be a factor in motorcycle crashes than in passenger car or light truck crashes.
Exhibit 5-13 describes the breakdown of occupant injuries between 1997 and 2006. The number of injuries decreased for passenger cars, buses, light and large trucks during that period, but sharply increased among motorcycle riders. During this same period, the number of motorcyclists injured increased by 59.9 percent, from 52,574 to 87,652.
| Type of Vehicle | 1997 | 2000 | 2002 | 2004 | 2005 | 2006 |
|---|---|---|---|---|---|---|
| Motorists | ||||||
| Passenger Cars | 2,340,612 | 2,051,609 | 1,804,788 | 1,642,549 | 1,573,396 | 1,474,536 |
| Light Trucks | 754,820 | 886,566 | 879,338 | 900,171 | 872,137 | 856,896 |
| Large Trucks | 30,913 | 30,832 | 26,242 | 27,287 | 27,284 | 22,815 |
| Motorcycles | 52,574 | 57,723 | 64,713 | 76,379 | 87,335 | 87,652 |
| Buses | 16,887 | 17,769 | 18,819 | 16,410 | 11,133 | 9,839 |
| Other and Unknown Vehicles | 5,602 | 10,120 | 6,187 | 7,262 | 9,832 | 10,843 |
| Nonmotorists | ||||||
| Pedestrians | 77,000 | 78,000 | 71,000 | 68,000 | 64,000 | 61,000 |
| Pedalcyclists | 58,000 | 51,000 | 48,000 | 41,000 | 45,000 | 44,000 |
| Other and Unknown Vehicles | 11,000 | 5,000 | 7,000 | 9,000 | 8,000 | 7,000 |
| Total | 3,347,408 | 3,188,619 | 2,926,087 | 2,788,058 | 2,698,117 | 2,574,581 |
Crashes by Age Group
Another important way of examining highway crashes is by demographic segment. Exhibit 5-14 shows the breakdown of drivers, by age, involved in fatal crashes in 2006. In recent years, much attention has been focused on the safety of drivers at either extreme of the age spectrum.
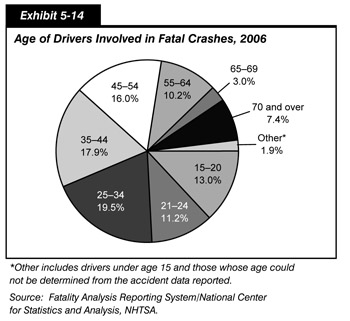
Americans between the ages of 15 and 20 constituted 6.4 percent of the total population of licensed drivers in 2006, but about 13 percent of all those involved in fatal crashes. In 2006, 3,490 drivers 15 to 20 years old were killed in crashes, while an additional 272,000 were injured. Motor vehicle crashes are the leading cause of death for young Americans and, as previously discussed, underage drinking is a major factor.
Meanwhile, the number of older drivers continues to rise. Between 1996 and 2006, the total number of licensed drivers increased by 13 percent, but the number of drivers aged 65 and older grew by 18 percent. Older Americans, however, are among the safest drivers. About 10.4 percent of all fatal crashes involved drivers aged 65 and older. Older drivers tend to be more experienced, and they are also less likely to be intoxicated while driving.
| Why could older drivers be among the safest drivers, as measured by the age of drivers involved in fatal crashes? | |
|
There are many factors. Older drivers tend to have the most experience in operating a vehicle, and they avoid conditions that compromise a vehicle's safety. Older drivers tend to take shorter trips, and many avoid driving during bad weather and at night. In 2006, for example, about 81 percent of traffic fatalities involving older drivers occurred during the daytime. Older drivers involved in fatal crashes also have the lowest proportion of intoxication of all adult drivers. In 2006, only 6 percent of drivers aged 65 and older involved in fatal crashes had a blood alcohol content (BAC) of 0.08 or higher.
|
|
Transit Safety
Transit operators report safety information to the National Transit Database (NTD) for three major categories: incidents, injuries, and fatalities. Safety information presented in this chapter is for directly operated and purchased transportation services. As safety information for both types of services is now presented, the absolute number of reported incidents and injuries has increased
In 2002, the FTA Office of Safety revised the definitions of an "incident" and an "injury." Given that there is no "statistical bridge" across the change in definitions that occurred between 2001 and 2002, this chapter provides only injury and incident data from 2002 onward. Data on injuries and incidents prior to 2002, which are not comparable with the new data, are available in the 2004 C&P Report.
An incident is recorded by a transit agency for a variety of events occurring on transit property or vehicles, involving transit vehicles, or to persons using the transit system. Included among these is any event that results in significant property damage, one or more reported injuries, one or more reported fatalities, or some combination thereof. Since 2002, the definition of "significant property damage" has been total property damage in excess of $7,500; prior to 2002, the definition was property damage in excess of $1,000. This increase in the property damage threshold has greatly reduced the number of reported incidents.
| What sort of events result in a recorded transit incident? | |
|
A transit agency records an incident for any event occurring on transit property, onboard or involving transit vehicles, or to persons using the transit system that results in one of the following:
Additionally, an incident is recorded by a transit agency whenever one of the following security situations occurs on transit property, onboard or involving transit vehicles, or to persons using the transit system:
|
|
In 2002, the definition of an injury was switched from a claims basis to a verifiable basis, leading to a reduction in reported injuries. Since 2002, an injury has been reported only when a person has been immediately transported away from the scene of a transit incident for medical care. Prior to 2002, all injuries for which claims were made were reported by transit agencies to the NTD. Since any event producing a reported injury is also reported as an incident, the definitional change for an injury also reduced the number of reported incidents.
The definition of a fatality was not revised in 2002. A fatality is reported for any death occurring within 30 days of a transit incident which is confirmed to be a result of that incident. Although suicides are reported as transit incidents, they are not included in the data on transit fatalities. Fatality data are provided from 1997 through 2006.
Injuries and fatalities include those suffered by riders, as well as those suffered by pedestrians, bicyclists, and people in other vehicles. Injuries and fatalities may occur while traveling on transit, as well as while boarding, alighting, or waiting for transit vehicles to arrive. An injury or fatality may also occur while not using transit, such as in the cases of being struck by a transit vehicle, or in the case of a collision in a transit station parking lot.
Exhibit 5-15 shows annual fatalities for transit services in both absolute numbers and adjusted according to the number of passenger miles traveled (PMT) in each year for 1997 to 2006. Between 1997 and 2006, total fatalities fluctuated between a high of 260 in 1998 and a low of 213 in 2006. There were 214 fatalities in 2005 and 213 in 2006. When adjusted for passenger use, the fatality rate per PMT has decreased over this time period, falling from 0.66 fatalities per 100 million PMT in 1997, to 0.51 per 100 million PMT in 2005, and to 0.49 fatalities per 100 million PMT in 2006.
| Year | Total | Per 100 Million PMT |
|---|---|---|
| 1997 | 244 | 0.66 |
| 1998 | 260 | 0.67 |
| 1999 | 255 | 0.64 |
| 2000 | 245 | 0.59 |
| 2001 | 236 | 0.55 |
| 2002 | 249 | 0.59 |
| 2003 | 224 | 0.55 |
| 2004 | 217 | 0.52 |
| 2005 | 214 | 0.51 |
| 2006 | 213 | 0.49 |
Exhibit 5-16 provides total incidents and injuries in both absolute terms and per 100 million PMT. Incidents and injuries both increased from 2004 to 2006, falling slightly from 2004 to 2005 before rising again in 2006. Adjusted for passenger use, incidents per 100 million PMT increased and injuries per 100 million PMT decreased during this time period.
| Year | Incidents | Injuries | ||
|---|---|---|---|---|
| Total | Per 100 Million PMT | Total | Per 100 Million PMT | |
| 2004 | 24,031 | 58.00 | 20,439 | 49.33 |
| 2005 | 23,578 | 56.71 | 19,201 | 46.18 |
| 2006 | 25,572 | 59.07 | 20,857 | 48.17 |
Exhibit 5-17 shows fatality rates per 100 million PMT for motor bus, heavy rail, commuter rail, light rail, and demand response, the five largest transit modes in terms of PMT. Together, these modes accounted for approximately 97 percent of total PMT in 2006. (Absolute fatalities are not comparable across modes because of the wide range of passenger miles traveled on each mode and are therefore not provided.) This information is presented in Exhibit 5-18 for all these modes except demand response. Fatalities per 100 million PMT for demand response are excluded from the graph due to their volatility.
| 1997 | 1998 | 1999 | 2000 | 2001 | 2002 | 2003 | 2004 | 2005 | 2006 | |
|---|---|---|---|---|---|---|---|---|---|---|
| Motor Bus | 0.66 | 0.73 | 0.59 | 0.57 | 0.54 | 0.45 | 0.62 | 0.46 | 0.46 | 0.59 |
| Heavy Rail | 0.34 | 0.25 | 0.36 | 0.30 | 0.24 | 0.47 | 0.25 | 0.34 | 0.22 | 0.13 |
| Commuter Rail | 1.07 | 1.01 | 0.94 | 0.74 | 0.87 | 1.03 | 0.70 | 0.80 | 0.90 | 0.73 |
| Light Rail | 0.29 | 1.34 | 1.09 | 1.64 | 1.13 | 0.70 | 0.89 | 1.09 | 1.03 | 0.72 |
| Demand Response | 6.85 | 4.78 | 7.20 | 7.98 | 3.79 | 2.99 | 4.97 | 2.66 | 5.28 | 5.61 |
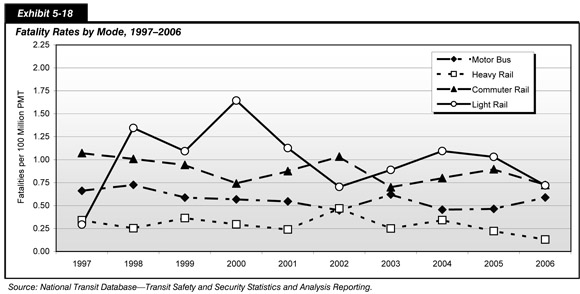
Rail transit vehicles that travel on separate fixed guideways have historically had fewer fatalities relative to use than rail transit vehicles that share their guideway with nontransit vehicles. Motor buses, which travel at slower speeds, have also had a relatively low number of fatalities per 100 million PMT. Between 1997 and 2006, with the exception of 1997, heavy rail and motor bus had the fewest fatalities per 100 million PMT among the five largest modes. In 2006, heavy rail had 0.13 fatalities per 100 million PMT and motor bus had 0.59 fatalities per 100 million PMT; heavy rail fatalities per 100 million PMT were above those for motor bus between 1990 and 1996, but decreased significantly over these years. Commuter rail, which has frequent grade crossings with roads and shares track with freight rail vehicles, had more fatalities per 100 million PMT than heavy rail for each year from 1997 to 2006. Light rail had the highest number of fatalities per 100 million PMT among the rail modes in 7 of the 10 years from 1997 to 2006; light rail guideway is often at grade level and has minimal barriers between streets and sidewalks.
The number of fatalities per 100 million PMT on demand response systems fluctuated considerably between 1997 and 2006, ranging from 2.66 fatalities per 100 million PMT in 2004 to 7.98 in 2000. Demand response accounts for less than 1 percent of PMT; therefore, the underlying absolute number of demand response fatalities is very low, which accounts for the high degree of volatility in these numbers.
Exhibit 5-19 provides data on injuries and incidents per 100 million PMT for transportation services on the five largest modes from 2004 to 2006. In 2006, commuter rail, which provides longer trips than other modes, had 18.84 incidents per 100 million PMT and 16.50 injuries per 100 million PMT. Heavy rail had 42.24 incidents and 32.41 injuries per 100 million PMT, light rail had 61.62 incidents and 35.76 injuries per 100 million PMT, and motor buses had 78.71 incidents and 70.84 injuries per 100 million PMT. Demand response had the highest number of incidents and injuries per 100 million PMT from 2004 to 2006. Incidents on demand response systems increased from 895.24 per 100 million PMT in 2004 to 1298.07 per 100 million PMT in 2006, and injuries increased from 448.50 per 100 million PMT to 729.47 per 100 million PMT.
| 2004 | 2005 | 2006 | |
|---|---|---|---|
| Incidents per 100 Million PMT | |||
| Motor Bus | 77.31 | 74.31 | 78.71 |
| Heavy Rail | 44.57 | 39.79 | 42.24 |
| Commuter Rail | 20.13 | 21.51 | 18.84 |
| Light Rail | 63.15 | 67.37 | 61.62 |
| Demand Response | 895.24 | 1010.24 | 1298.07 |
| Injuries per 100 Million PMT | |||
| Motor Bus | 75.56 | 70.08 | 70.84 |
| Heavy Rail | 32.88 | 26.17 | 32.41 |
| Commuter Rail | 16.84 | 21.05 | 16.50 |
| Light Rail | 41.84 | 36.59 | 35.76 |
| Demand Response | 448.50 | 506.00 | 729.47 |
Exhibit 5-20 shows the number of fatalities per 100 incidents for each of the five largest transit modes from 2004 to 2006. This metric does not represent the percentage of incidents that are fatal, as some incidents result in multiple fatalities. The metric does, however, show the likelihood that fatality will result from an incident. Although commuter rail has a very low number of incidents per PMT, commuter rail incidents are far more likely to result in a fatality than incidents occurring on any other mode. Motor buses, on the other hand, have a high number of incidents per PMT, but a lower chance of having an incident result in a fatality than almost any other mode. While light rail and motor bus have similar numbers of incidents per PMT, an incident on light rail is one and a half to three times more likely to produce a fatality than an incident on a motor bus.
| 2004 | 2005 | 2006 | |
|---|---|---|---|
| Motor Bus | 0.59 | 0.62 | 0.75 |
| Heavy Rail | 0.77 | 0.56 | 0.31 |
| Commuter Rail | 3.98 | 4.16 | 3.85 |
| Light Rail | 1.73 | 1.53 | 1.17 |
| Demand Response | 0.30 | 0.52 | 0.43 |
Comparison
Exhibit 5-21 compares the key highway and transit statistics discussed in this chapter with the values shown in the last version of the C&P report. The first data column contains the values reported in the 2006 C&P Report, which were based on 2004 data. Where the 2004 data have been revised, updated values are shown in the second column. The third column contains comparable values based on 2006 data.
| 2004 Data | 2006 Data | ||
|---|---|---|---|
| 2006 C&P Report | Revised | ||
| Highway Safety | |||
| Number of Fatalities | 42,636 | 42,836 | 42,642 |
| Fatality Rate per 100,000 People | 14.52 | 14.59 | 14.24 |
| Fatality Rate per 100 Million VMT | 1.4 | 1.44 | 1.41 |
| Number of Injuries | 2,788,000 | 2,575,000 | |
| Injury Rate per 100,000 People | 950 | 860 | |
| Injury Rate per 100 Million VMT | 94 | 85 | |
| Transit Safety | |||
| Number of Fatalities | 248 | 217 | 213 |
| Fatalities per 100 Million PMT | 0.55 | 0.52 | 0.49 |
| Number of Injuries | 18,982 | 20,439 | 20,857 |
| Injuries per 100 Million PMT | 42 | 49.33 | 48.17 |
| Number of Incidents | 20,939 | 24,031 | 25,572 |
| Incidents per 100 Million PMT | 46 | 58 | 59.07 |
Highway fatalities decreased by 0.45 percent between 2004 and 2006, from 42,836 to 42,642. Although the number of fatalities has fallen sharply since 1966, the year when Federal legislation first addressed highway safety, there has been more limited progress in reducing the number of fatalities since 1992.
In 2006, the fatality rate per 100,000 people was 14.24, down from the 2004 fatality rate of 14.59. The fatality rate per 100 million vehicle miles traveled (VMT) declined from 1.44 in 2004 to 1.41 in 2006. The number of highway injuries decreased from 2.79 million in 2004 to 2.76 million in 2006. The injury rate per 100,000 people declined from 950 in 2004 to 860 in 2006, and the injury rate per 100 million VMT dropped from 94 in 2004 to 85 in 2006.
| What information is available for highway fatalities and injuries in 2007? | |
|
The information presented in the highway section of this chapter was drawn primarily from the Fatality Analysis Reporting System (FARS), which contains data on fatal traffic crashes in the 50 States, the District of Columbia, and Puerto Rico. Information in the FARS is updated periodically as submitted by the States, the District of Columbia, and Puerto Rico. For this reason, FARS data represent a "snapshot in time." The data for 2006 and previous years reported in this chapter were drawn from FARS in May 2008.
In August 2008, the National Highway Traffic Safety Administration (NHTSA) issued a Traffic Safety Facts summary that assesses key safety data for 2007. This document indicates that in 2007, 41,059 people died on the Nation's highways, a decrease of 3.9 percent from the total number of traffic fatalities in 2006. Also reported is a decrease in the fatality rate, from 1.42 per 100 million VMT in 2006 to 1.37 per 100 million VMT in 2007. In addition, traffic-related injuries declined from 2.58 million in 2006 to 2.49 million in 2007. The Traffic Safety Facts summary can be viewed at http://www-nrd.nhtsa.dot.gov/Pubs/811017.PDF.
|
|
Public transit in the United States has been and continues to be a comparably safe mode of transportation, as evidenced by statistics on incidents, injuries, and fatalities as reported by public transportation agencies for the vehicles they operate directly.
Rail transit vehicles that travel on separate fixed guideways have historically had a lower number of fatalities relative to use than rail transit vehicles that share their guideways with nontransit vehicles. Buses, which travel at slower speeds, have also had low fatality rates per 100 million passenger miles traveled (PMT). Total fatalities fluctuated from 244 in 1997, to 217 in 2004, and 213 in 2006. When adjusted for passenger use, however, the fatality rate per 100 million PMT decreased, falling from 0.66 in 1997, to 0.52 in 2004, to 0.49 in 2006.
Between 2004 and 2006 incidents and injuries both increased, falling from 2004 to 2005 before rising again in 2006. When adjusted for passenger use, incidents per 100 million PMT increased and injuries per 100 million PMT decreased during this time period. In 2006, there were 25,572 incidents and 20,857 injuries on transit compared to 24,031 incidents and 20,439 injuries in 2004. When adjusted for passenger travel, there were 59.07 incidents per 100 million PMT and 48.17 injuries per 100 million PMT on transit in 2006, compared with 58.00 incidents per 100 million PMT and 49.33 injuries per 100 million PMT in 2004.