

- Introduction
- Capital Investment Scenarios
- Highway and Bridge Investment Scenarios
- Supporting Analyses for Highway and Bridge Investment
- Transit Investment Scenarios
- Comparisons Between Report Editions
- Highway and Bridge Investment Scenarios
- The Economic Approach to Transportation Investment Analysis
- Chapter 7: Potential Capital Investment Impacts
- Chapter 8: Selected Capital Investment Scenarios
- Chapter 9: Supplemental Scenario Analysis
- Chapter 10: Sensitivity Analysis
Introduction
Chapters 7 through 10 present and analyze future capital investment scenario estimates for highways, bridges, and transit. These chapters provide general investment benchmarks as a basis for the development and evaluation of transportation policy and program options. The 20-year investment scenario estimates shown in these chapters reflect the total capital investment from all sources that is projected to be required to achieve certain levels of performance. They do not directly address specific public or private revenue sources that might be used to finance the investment under each scenario, nor do they identify how much might be contributed by each level of government.
These four investment-related chapters include the following analyses:
Chapter 7, Potential Capital Investment Impacts, analyzes the projected impacts of alternative levels of future investment on measures of physical condition, operational performance, and other benefits to system users. Each alternative pertains to investment over the 20-year period 2009 to 2028, and is presented both as an annual average level of investment and as the annual rates of increase or decrease in investment that would produce that annual average. Both the level and rate of growth in investment are measured using constant 2008 dollars.
Chapter 8, Selected Capital Investment Scenarios, examines several scenarios distilled from the investment alternatives considered in Chapter 7. Some of the scenarios are oriented around maintaining different aspects of system condition and performance or achieving a specified minimum level of performance, while others link to broader measures of system user benefits. The scenarios included in this chapter are intended to be illustrative and do not represent comprehensive alternative transportation policies; the Department does not endorse any of these scenarios as a target level of investment.
Chapter 9, Supplemental Scenario Analysis, explores some of the implications of the scenarios presented in Chapter 8 and contains some additional policy-oriented analyses addressing issues not covered in Chapters 7 and 8. As part of this analysis, recent condition, performance, and finance trends are compared with projected future needs in order to identify consistencies and inconsistencies between what has occurred in the past and what is projected to occur in the future.
Chapter 10, Sensitivity Analysis, explores the impact that changing some of the key technical assumptions underlying the analyses presented in Chapters 7 and 8 would have on the projections at alternative levels of capital investment. The investment scenario projections in this report are developed using models that evaluate current system condition and operational performance and make 20-year projections based on assumptions about future travel growth and a variety of engineering and economic variables. The accuracy of these projections depends, in large part, on the underlying assumptions used in the analysis. The uncertainty inherent in the estimates is further discussed below.
Unlike Chapters 1 through 6, which largely include highway and transit statistics drawn from other sources, the investment scenario projections presented in these chapters (and the models used to create the projections) were developed exclusively for the C&P report. The procedures for developing the investment scenario estimates have evolved over time to incorporate new research, new data sources, and improved estimation techniques relying on economic principles. The methodologies used to analyze investment for highways, bridges, and transit are discussed in greater detail in Appendices A, B, and C.
The combination of engineering and economic analysis in this part of the report is consistent with the movement of transportation agencies toward asset management, value engineering, and greater consideration of cost effectiveness in decision making. The economic approach to transportation investment is discussed in greater detail at the end of this section.
Capital Investment Scenarios
The 20-year capital investment scenario projections shown in this report reflect complex technical analyses that attempt to predict the impact that capital investment may have on the future conditions and performance of the transportation system. These scenarios are intended to be illustrative, and the U.S. Department of Transportation does not endorse any of them as a target level of investment. Where practical, supplemental information has been included to describe the impacts of other possible investment levels.
This report does not attempt to address issues of cost responsibility. The investment scenarios predict the impact that particular levels of combined Federal, State, local, and private investment might have on the overall conditions and performance of highways, bridges, and transit. While Chapter 6 provides information on what portion of highway investment has come from different revenue sources in the past, the report does not make specific recommendations about how much could or should be contributed by each level of government or the private sector in the future.
Some of the scenarios presented in this report are defined around achieving a particular level of system performance. In considering the future system performance impacts identified for each scenario, it is important to note that they represent what could be achievable assuming a particular level of investment, rather than what would be achieved. The models used in the development of the scenarios focus on engineering impacts and benefits and generally assume that, within a fixed budget constraint, potential capital projects with higher benefits relative to their costs would be carried out before those with lower benefit-cost ratios. In actual practice, other factors can and do affect project selection. Further, models used to generate estimates of investment levels rely on a variety of additional assumptions and their predictive power has never been tested. Therefore, these estimates are for illustrative and comparative purposes only. Other scenarios are defined around funding all potential capital investments with benefit-cost ratios above a specified threshold. It is important to note that simply increasing spending to the levels identified in these scenarios would not in itself guarantee that these funds would actually be expended in a cost-beneficial manner.
Also, some potential capital investments selected by the models, regardless of their economic merits or impact on conditions and performance, may be infeasible for political or other reasons. As a result, the supply of feasible cost-beneficial projects could be lower than the levels estimated by the modeling assumptions of some scenarios.
Highway and Bridge Investment Scenarios
Future investments in highways and bridges are analyzed independently by separate models and techniques for a variety of alternative funding levels in Chapter 7, and the results are combined for the selected investment scenarios presented in Chapter 8. The National Bridge Investment Analysis System (NBIAS) considers investments related to bridge repair, rehabilitation, and replacement. Investments for capacity expansion and the highway resurfacing and reconstruction component of system rehabilitation are modeled by the Highway Economic Requirements System (HERS). While this model was primarily designed to analyze highway segments, HERS also factors in the costs of expanding bridges and other structures when deciding whether to add lanes to a highway segment. The costs reported for the investment scenarios in Chapter 8 also include adjustments made using external procedures described in that chapter, allowing elements of system rehabilitation, system expansion, and system enhancement that are not modeled in NBIAS or HERS to be reflected in the estimates. The investment scenario estimates shown should thus reflect the size of the total highway capital investment program that is projected to be required in order to meet the performance goals specified in the scenarios.
Chapter 8 applies a consistent set of performance criteria in creating parallel scenarios to separately analyze investment needs for all Federal-aid highways, all roads (systemwide), the National Highway System, and the Interstate System. The statistics for Federal-aid highways are presented more prominently in this edition; due to data limitations, these estimates are considered to be more reliable than the comparable systemwide statistics for all roads. The Highway Performance Monitoring System (HPMS) database on which the HERS model relies includes detailed information only on Federal-aid highways; for the scenarios based on all roads, separate estimates must be generated for roads functionally classified as rural minor collectors, rural local, or urban local.
The Sustain Current Spending scenario projects the potential impacts of sustaining capital spending at 2008 base year levels in constant dollar terms over the 20-year period 2009 through 2028. The Maintain Conditions and Performance scenario assumes that combined highway capital investment by all levels of government gradually changes in constant dollar terms over 20 years to the point at which selected performance indicators in 2028 are maintained at their 2008 base year levels. For this edition, these indicators are average speed (as computed by HERS) and the backlog of potential cost-beneficial bridge investments (as computed by NBIAS). It should be noted that the version of this scenario presented in the 2008 C&P report used a different HERS indicator, adjusted average user costs. The impact of this change is discussed in Chapters 9.
The investment levels for the Improve Conditions and Performance scenario are determined by identifying the highest rate of annual spending growth for which potentially cost-beneficial highway and bridge improvements can be identified. This scenario represents an “investment ceiling” above which it would not be cost-beneficial to invest, even if available funding were unlimited. The portion of this scenario directed toward addressing engineering deficiencies on pavements and bridges is described as the State of Good Repair benchmark.
The Intermediate Improvement scenario is included in Chapter 8 in recognition that any investment above the level of the Maintain Conditions and Performance scenario described above should theoretically improve conditions and performance. The HERS portion of this scenario reflects a level of investment at which all potential improvements with a benefit-cost ratio of 1.5 or higher could be funded (in contrast to the Improve Conditions and Performance scenario, which utilizes a minimum benefit-cost ratio of 1.0). The NBIAS portion of this scenario assumes the same annual rate of spending as computed in HERS, which would be sufficient to reduce (but not eliminate) the backlog of potential cost-beneficial bridge investments by 2028.
Supporting Analyses for Highway and Bridge Investment
In addition to supporting the primary Chapter 8 scenarios described above, the investment alternatives presented in Chapter 7 identify the levels of investment associated with maintaining two other performance indicators—average pavement roughness and average delay per vehicle miles traveled (VMT)—and the level of investment at which all potential improvements with a minimum benefit-cost ratio of 1.2 or higher could be funded. The impacts of a gradual decline in constant dollar spending of 1 percent per year are also explored.
Chapter 9 includes a supplemental analysis that focuses on maintaining specific performance indicators for individual highway functional systems. This analysis combines three elements: (1) the level of system expansion expenditures associated with maintaining average delay per VMT, (2) the level of system rehabilitation expenditures associated with maintaining average pavement roughness, and (3) the level of system rehabilitation expenditures associated with maintaining the economic investment backlog for bridges. (In contrast, the Maintain Conditions and Performance scenario described above focuses on maintaining more general indicators for the system as a whole).
Chapter 9 also includes supplemental analyses discussing the potential impacts of alternative deployment rates for Intelligent Transportation Systems (ITS) and operations strategies, as well as alternative bridge management strategies. The potential impacts of alternative financing mechanisms, including congestion pricing, on future travel demand and systemwide performance are explored as well. Chapter 10 includes analyses of the potential impacts of alternative future VMT growth rates.
These supporting analyses provide both insights into the implications of the primary scenarios presented in Chapter 8 and the tools needed for readers to construct their own alternative scenarios using different assumptions.
Transit Investment Scenarios
The transit section of Chapter 7 evaluates the impact of varying levels of capital investment on various measures of condition and performance, while the transit section of Chapter 8 provides a more in-depth analysis of specific investment scenarios.
The Sustain Current Spending scenario projects the potential impacts of sustaining preservation and expansion spending at 2008 base year levels in constant dollar terms over the 20-year period of 2009 through 2028. The scenario applies benefit-cost analysis to prioritize investments within this constrained budget target.
The State of Good Repair benchmark projects the level of investment needed to bring all assets to a state of good repair over the next 20 years, defined as asset condition ratings of 2.5 or higher on a 5-point scale. This scenario is focused solely on the preservation of existing assets and does not apply a benefit-cost screen.
The Low Growth scenario adds a system expansion component on top of the system preservation needs associated with the State of Good Repair benchmark. The goal of this scenario is to preserve existing assets and expand the transit asset base to support projected ridership growth over 20 years as forecast by metropolitan planning organizations (MPOs). The High Growth scenario incorporates a more extensive expansion of the existing transit asset base to support a higher annual rate of growth consistent with that experienced between 1999 and 2008. Both of these scenarios incorporate a benefit-cost test for evaluating potential investments.
It should be noted that the transit scenarios presented in this edition are significantly different than those presented in the 2008 C&P report. These differences are discussed in Chapter 9.
Comparisons Between Report Editions
In making comparisons between the capital investment scenarios presented in different editions of the C&P report, several considerations should be taken into account:
- Scenario definitions have been modified over time. (As noted above, the definitions of several transit scenarios and one of the highway scenarios have been modified since the 2008 C&P report).
- The analytical tools and data used in generating the scenarios have been refined and improved over time.
- The base year of the analysis advances two years between successive editions of this biennial report. Over this period many real-world factors change that can affect the investment scenario estimates. Among these factors are construction costs and other prices, conditions and performance of the highway and transit systems, expansion of the system asset base, and changes in technology (such as improvements in motor vehicle fuel economy). While this issue is relevant to all scenarios, it is particularly significant for scenarios aimed at maintaining base year conditions.
Selected comparisons of the capital investment scenarios from this report with those from previous editions are presented in Chapter 9. (Comparable analyses were presented in Chapter 8 of the 2008 C&P report). Chapter 9 also includes analyses that look back at the scenarios presented in selected previous editions to see how their projections of future conditions and performance have lined up with what has actually occurred over time, taking into account factors such as changes in capital spending and travel growth.
The Economic Approach to Transportation Investment Analysis
The methods and assumptions used to analyze future highway, bridge, and transit investment scenarios are continuously evolving. Since the beginning of the highway report series in 1968, innovations in analytical methods, new empirical evidence, and changes in transportation planning objectives have combined to encourage the development and application of improved data and analytical techniques. Estimates of future highway investment requirements, as reported in the 1968 National Highway Needs Report to Congress, began as a combined “wish list” of State highway “needs.” As the focus of national highway investment changed from system expansion to management of the existing system during the 1970s, national engineering standards were defined and applied to identify system deficiencies, and the investments necessary to remedy these deficiencies were estimated. By the end of the decade, a comprehensive database, the HPMS, had been developed to monitor highway system conditions and performance nationwide.
By the early 1980s, a sophisticated simulation model, the HPMS Analytical Process (HPMS-AP), was available to evaluate the impact of alternative investment strategies on system conditions and performance. The procedures used in the HPMS-AP were based on engineering principles. Engineering standards were applied to determine which system attributes were considered deficient, and improvement option packages were developed using standard engineering practices to potentially correct given deficiencies, but without consideration of comparative economic benefits and costs.
In 1988, the Federal Highway Administration embarked on a long-term research and development effort to produce an alternative simulation procedure combining engineering principles with economic analysis, culminating with the development of the HERS. The HERS model was first utilized to develop one of the two highway investment scenarios presented in the 1995 C&P Report. In subsequent reports, HERS has been used to develop all of the highway investment scenarios.
Executive Order 12893, “Principles for Federal Infrastructure Investments,” issued on January 26, 1994, directs that Federal infrastructure investments be selected on the basis of a systematic analysis of expected benefits and costs. This order provided additional momentum for the shift toward developing analytical tools that incorporate economic analysis into the evaluation of investment requirements.
In the 1997 C&P Report, the Federal Transit Administration introduced TERM, which was used to develop both of the transit investment scenarios. TERM incorporates benefit-cost analysis into its determination of transit investment levels.
The 2002 C&P Report introduced the NBIAS, incorporating economic analysis into bridge investment modeling for the first time.
Economic Focus Versus Engineering Focus
The economic approach to transportation investment relies fundamentally upon an analysis and comparison of the benefits and costs of potential investments. By providing benefits whose value exceeds their costs, projects that offer “net benefits” have the potential to increase societal welfare and are thus considered to be “good” or “economic” investments from a public welfare perspective. In a benefit-cost ratio, the cost of an investment in transportation infrastructure (the denominator) is conventionally measured by the capital expenditures required to carry out the project. The benefits of transportation capital investments are generally characterized as reductions in costs borne by transportation agencies (such as for maintenance), users of the transportation system (such as savings in travel time and vehicle operating costs), and others who are affected by the operation of the transportation system (such as those with health impacts or property damage costs).
Traditional engineering-based analytical tools focus mainly on estimating transportation agency costs and the value of resources required to maintain or improve the condition and performance of infrastructure. This type of analytical approach can provide valuable information about the cost effectiveness of transportation system investments from the public agency perspective, including the optimal pattern of investment to minimize life-cycle costs. However, this approach does not fully consider the potential benefits to users of transportation services from maintaining or improving the condition and performance of transportation infrastructure.
By incorporating the value of services that transportation infrastructure provides to its users, the HERS, TERM, and NBIAS models each have a broader focus than traditional engineering-based models. They also attempt to take into account some of the impacts that transportation activity has on non-users and recognize how investments in transportation infrastructure can alter the costs of these impacts. By expanding the scope of benefits considered in their analyses, these models are able to yield an improved understanding of existing and future investment needs for the Nation’s surface transportation system.
Using this economics-based approach to analyze potential transportation investment is likely to result in different decisions about the catalog of desirable improvements than would be made using a purely engineering-based approach. For example, if a highway segment, bridge, or transit system is greatly underutilized, benefit-cost analysis might suggest that it would not be worthwhile to fully preserve its condition or to address its engineering deficiencies. Conversely, a model based on economic analysis might recommend additional investments to expand capacity or improve travel conditions above and beyond the levels dictated by an analysis that simply minimized engineering life-cycle costs, if doing so would provide sufficient benefits to the users of the system.
The economics-based approach also provides a more sophisticated method for prioritizing potential improvement options when funding is constrained. By identifying investment opportunities according to the net benefits they offer, economic analysis helps to provide guidance in directing limited transportation capital investment resources toward the types of system improvements that can together provide the largest benefits to transportation system users. Such an approach, which is applied in HERS, is illustrated in Exhibit II-1. Projects are ranked in order by their benefit-cost ratios and are then successively implemented until the funding constraint is reached. Projects that would produce lesser net benefits would be deferred for reconsideration in the future.
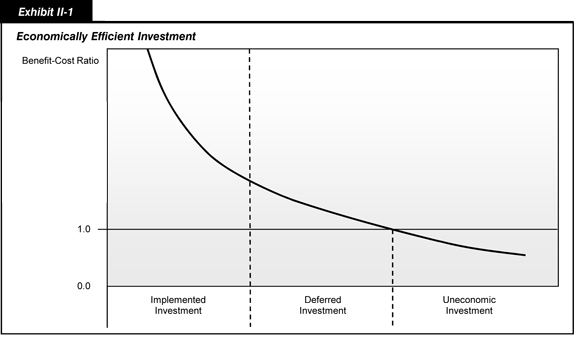
One implication of prioritizing potential projects in this manner is that the marginal and average benefit-cost ratios associated with a program of improvements will decline as the overall level of investment rises. As the relative returns on potential highway, bridge, and transit investments decline, it becomes more likely that competing potential public or private sector investments will yield more net benefits to society.
Theoretically, sufficient funding could be made available to implement all projects passing the benefit-cost test. Projects that do not meet this threshold (because they do not offer positive net benefits and thus cannot increase total net benefits provided by transportation system infrastructure) should not be selected or implemented, even if unlimited funding were available.
It should be noted that some benefits of transportation investments can be difficult to measure, including those pertaining to livability and sustainability.
Financing Mechanisms and Investment Analysis
As discussed in Chapter 6, highway user revenues (including fuel taxes, motor-vehicle fees, and tolls) are the primary source of funding for highway-related expenditures in the United States. This is particularly true for expenditures funded by the Federal government, which are predominantly drawn from user charges and are devoted primarily to capital outlay; but it is also a significant factor for State and local government expenditures. Private sector investment in highways is also dependent on revenue streams (primarily tolls) from users of the privately financed facilities. By raising the out-of-pocket costs of highway travel to users, highway user charges tend to reduce the demand for use of the system, and thereby reduce the amount of investment that would be required to achieve a given level of condition and performance, or to exhaust all cost-beneficial investments. The potential reductions in investment levels are naturally greater for user charges designed to limit demand for the particular uses of the system that are main drivers of investment needs. For investment in system expansion, the main driver is peak-period congestion, which could potentially be reduced through peak-period congestion charges. For investment in highway rehabilitation, a principal driver is pavement damage from heavy trucks, which could potentially be reduced by differentiated charges on heavy truck VMT. The HERS model has been adapted to support analysis of the link between broad types of alternative financing mechanisms and projected future investment/performance relationships. Chapter 9 includes a set of supplemental analyses that assume that any increases in highway and bridge capital investment above 2008 levels would be funded from user charges imposed on either a per-mile basis (such as a fixed-rate toll) or a per-gallon basis (such as the motor-fuel tax). The general effect of such charges is to reduce future VMT and reduce the projected level of investment needed to achieve a particular performance objective.
The sources of funding for transit-related expenditures have traditionally been more diverse than those for highways because passenger fares, fuel taxes, sales taxes, and other public funding mechanisms all play a significant role in financing transit. Consequently, the linkages between financing mechanisms and future investment/performance relationships discussed above for highways are less critical from the transit perspective and are not directly modeled in the transit investment analysis presented in this report. The analysis of potential bridge investment relationships also do not directly consider such linkages.
Congestion Pricing
When highway users make decisions about whether, when, and where to travel, they consider both the implicit costs (such as travel time and safety risk) and explicit, out-of-pocket costs (such as fuel costs and tolls) of the trip. Under normal operating conditions, their use of the road will not have an appreciable effect on the costs faced by other users. As traffic volumes begin to approach the carrying capacity of the road, however, traffic congestion and delays begin to set in; travel times for all users begin to rise, with each additional vehicle making the situation progressively worse. However, individual travelers are not likely to take into account the delays and additional costs that their use of the facility imposes on other travelers, focusing instead only on the costs that they bear themselves. Economists refer to this divergence between the costs an individual user bears and the total added costs each additional user imposes as a congestion externality. Ignoring this externality is likely to result in an inefficiently high level of use of congested facilities, resulting in a loss of some of their potential benefits to users.
If one ignores the costs of implementing and operating a system of congestion charges, then the optimal congestion charges—those that would maximize net societal benefits—would be calculated for each mile of travel on congested facilities to precisely equal the cost of the delay that mile of travel imposes on society. By “internalizing” the congestion externality, such charges would induce adjustments to travel patterns, including re-scheduling of trips away from the peak, that would reduce (but not necessarily eliminate) congestion delay. Although these adjustments would entail costs to society—for example, commuters who alter their work schedule to avoid traveling during the peak period may suffer such inconveniences as disruptions to child-care arrangements and preferred sleep/wake times—when congestion charges are set optimally, these costs are less than the benefits from reduced delay. The same is true if one takes account of the costs of implementing and operating a congestion pricing system; however, since these costs increase with the target level of precision, the optimal congestion charge for a particular mile of travel may now approximate, rather than precisely equal, the delay cost that mile of travel imposes on society. (If the costs of implementation and operation are sufficiently high in a given location, that may reduce the optimal congestion charge for that location to zero).
The HERS model has been adapted to provide quantitative estimates of the impact that more efficient pricing could have on future highway investment/performance relationships. The analytical procedures assume congestion pricing would be implemented universally on all congested roads, but do not incorporate the costs of implementing and operating this system. The rates set for individual facilities are based on the marginal cost that each user of the facility imposes on all others during the peak travel period.
Chapter 9 includes a set of supplemental analyses projecting the potential impacts of adopting universal congestion pricing. Some of these analyses are linked to the analyses described in the “Financing Mechanisms and Investment Analysis” section above and assume that congestion pricing revenues would be available to support any additional investment needed for a particular highway investment scenario and would be supplemented by additional fixed rate user charges if necessary. To the extent that the revenues from variable rate user charges would exceed the amount needed to support a given highway investment scenario, the excess revenues were assumed to be rebated to users in the form of reductions in existing fixed rate user charges. It should be noted, however, that the actual disposition of congestion pricing revenues would be at the discretion of the entity that imposes the charges, and that such revenues could instead be used to support additional investment in transit systems to accommodate travelers who might opt to change transportation modes in response to the adoption of congestion pricing, or for a variety of other transportation or nontransportation purposes.
The analysis of congestion pricing presented in this report focus mainly on their potential impacts on future investment/performance relationships, particularly in regard to the amount of combined public and private investment that might be needed to achieve particular outcomes in terms of future system performance. This report does not address social equity concerns about congestion pricing. This report also does not explore the mechanics of computing or assessing economically optimal rates on a real-time basis. However, significant advances in recent years in tolling technology have reduced both the operating costs of toll collection and the delays experienced by users from stopping or slowing down at collection points. Other advances have made it possible to charge different toll rates during different time periods, in some cases varying the price dynamically with real-time traffic conditions. While some of these technologies require extensive roadway infrastructure (and would thus likely be deployed only on high-volume, limited access roads), other in-vehicle technologies using global positioning system devices are being developed that could make it possible to assess fees on virtually any roadway. The HERS methodology for estimating the impacts of congestion pricing is presented in greater detail in Appendix A. The current approach has some technical limitations and does not fully address the network effects associated with drivers diverting to other roads. Consequently, this report does not include any analyses of the potential impacts of partial implementation of congestion pricing on selected facilities.
While most transit routes have excess capacity (measured either in terms of passengers per vehicle or vehicles per route mile), some heavily used lines in major metropolitan areas do approach their passenger-carrying capacities during peak travel hours, with commensurate deterioration in the quality of service. As with highways, some of this overcrowding relates to the underpricing of transit service during rush hours. These overcrowded transit lines are often in corridors with heavily congested highway service, making a joint solution to the pricing problems on both highways and transit not only more important to consider, but also more complicated to analyze, devise, and implement.
Multimodal Analysis
The HERS, TERM, and NBIAS all use a consistent approach for determining the value of travel time and the value of reducing transportation injuries and fatalities, which are key variables in any economic analysis of transportation investment. While HERS, TERM, and NBIAS all use benefit-cost analysis, their methods for implementing this analysis are very different. The highway, transit, and bridge models each rely on separate databases, making use of the specific data available for each mode of the transportation system and addressing issues unique to that mode.
These three models have not yet evolved to the point where direct multimodal analysis would be possible. For example, HERS assumes that, when lanes are added to a highway, highway user costs will initially fall, resulting in additional highway travel. Some of the increased use of the expanded facility would result from newly generated travel, while some would be the result of travel shifting from transit to highways. However, HERS is unable to distinguish between these different sources of additional highway travel. At present, there is no direct way to analyze the impact that a given level of highway investment in a particular location would have on the transit investment in that vicinity (or vice versa). Opportunities for future development of HERS, TERM, and NBIAS, including efforts to allow feedback between the models, are discussed in Appendix D.
Uncertainty in Transportation Investment Modeling
The three investment analysis models used in this report are deterministic rather than probabilistic, meaning that they provide a single projected value of total investment for a given scenario rather than a range of likely values. As a result, it is possible to make only general statements about the limitations of these projections, based on the characteristics of the process used to develop them, rather than giving specific information about confidence intervals.
As in any modeling process, simplifying assumptions have been adopted to make analysis practical and to meet the limitations of available data. While potential highway improvements are evaluated based on benefit-cost analysis, not all external costs (such as noise pollution) or external benefits (including certain net favorable impacts of highway improvements on productivity and competition in the economy) that may be considered in the actual selection process for individual projects are reflected in the investment models. Across a broad program of investment projects, such external effects may fully or partially cancel each other out; but, to the extent that they do not, the “true” level of investment required to achieve a particular goal may be either higher or lower than those predicted by the model. Some projects that HERS, TERM, or NBIAS view as economically justifiable may not be after more careful scrutiny, while other projects that the models would reject might actually be justifiable if these other factors were considered.
While it is not possible to present precise confidence ranges for the estimates found in this report, it is possible to examine the sensitivity of the estimates to changes in some of the key parameters underlying the models. Such analyses are presented in Chapter 10 and include discussions of alternative discount rates, alternative valuations of time saved and lives saved, alternative assumptions about fuel prices and average fuel economy, and alternative assumptions about future travel demand and its sensitivity to changes in the price of traveling. Chapter 10 also includes a discussion of the theoretical implications of each of these key input variables and their implications in conducting benefit-cost analysis.