- Highway Finance
- Transit Finance
Highway Finance
This chapter provides data and analysis of finance trends for highways and transit across all levels of government. The revenue sources that support investments in highways and bridges are outlined first, followed by a presentation of total highway expenditures and then highway capital outlays only. A separate section of the chapter presents finance trends for transit systems.
In February 2009, the American Recovery and Reinvestment Act (Recovery Act) provided additional funds for transportation and other programs. Transportation received over $48 billion for expenditures in highways, transit, rail, aviation, and other transportation modes. The Department’s broad recovery goals reflect those of the Recovery Act, primarily (1) creating and preserving jobs and promoting economic recovery and (2) investing in infrastructure that has long-term economic benefits. The effects of the additional funds will be evident in the revenue and expenditure levels and trends presented; these effects are referenced and explained where relevant.
Revenue Sources for Highways
The revenue generated from all levels for government for highways in 2010 was $221.0 billion, as shown in Exhibit 6-1. Of the total revenue, the Federal government contributed $59.0 billion, State governments contributed $109.0 billion and Local governments contributed $53.1 billion.
| Source | Highway Revenue, Billions of Dollars | Percent | |||
|---|---|---|---|---|---|
| Federal | State | Local | Total | ||
| User Charges1 | |||||
| Motor-Fuel Taxes | $26.1 | $30.3 | $1.0 | $57.4 | 26.0% |
| Motor-Vehicle Taxes and Fees | $2.6 | $22.8 | $1.5 | $26.9 | 12.2% |
| Tolls | $0.0 | $7.9 | $1.7 | $9.6 | 4.3% |
| Subtotal | $28.7 | $61.0 | $4.1 | $93.8 | 42.5% |
| Other | |||||
| Property Taxes and Assessments | $0.0 | $0.0 | $9.4 | $9.4 | 4.3% |
| General Fund Appropriations2 | $29.6 | $7.2 | $21.8 | $58.6 | 26.5% |
| Other Taxes and Fees | $0.6 | $6.6 | $4.9 | $12.2 | 5.5% |
| Investment Income and Other Receipts | $0.0 | $8.2 | $5.6 | $13.9 | 6.3% |
| Bond Issue Proceeds | $0.0 | $25.9 | $7.1 | $33.0 | 14.9% |
| Subtotal | $30.2 | $48.0 | $48.9 | $127.1 | 57.5% |
| Total Revenues | $59.0 | $109.0 | $53.1 | $221.0 | 100.0% |
| Funds Drawn From (or Placed in) Reserves3 | ($11.9) | ($3.7) | ($0.1) | ($15.7) | -7.1% |
| Total Expenditures Funded During 2010 | $47.1 | $105.3 | $52.9 | $205.3 | 92.9% |
2 The $29.6 billion shown for Federal reflects $14.7 billion transferred from the General Fund to the Highway Trust Fund in 2010, as well as the expenditure in 2010 of $11.9 billion of the funding authorized for use on highways by the Recovery Act. The remainder supported expenditures by the FHWA and other Federal agencies that were not paid for from the Highway Trust Fund.
3 The $11.9 billion figure shown for Federal reflects the increase in the balance of the Highway Account of the Highway Trust Fund from approximately $8.9 billion at the beginning of the year to approximately $20.7 billion at the end of the year. Without the $14.7 billion transfer of general funds to the Highway Account, this balance would have declined. It should be noted that while the increase in the Highway Account balance in 2010 and the amount of Recovery Act funds expended for highways during 2010 both round to $11.9 billion, this is entirely coincidental. Recovery Act funding was authorized from the General Fund, and has no direct impact on the Highway Trust Fund.
These revenues were raised from user charges and a number of other sources (other taxes, investment income and debt financing). Federal, State and local governments provide a different mix of revenue sources. A significant share of Federal and State revenues are from user charges. Most of the local revenues are from other sources, particularly General Fund Appropriations.
As shown in Exhibit 6-1, all levels of government combined spent $205.3 billion for highways in 2010. The net difference of $15.7 billion between the total revenues generated during the year and the expenditures during the year increased the reserves available for use in future years. For example, the $11.9 billion difference between total Federal revenues and expenditures represents the increase in the cash balance of the Highway Account of the Highway Trust Fund (HTF) in 2010. While cash balances for some States and localities rose during the year, others fell. Collectively, cash balances in dedicated highway accounts at the State level rose by $3.7 billion, while highway accounts at the local level grew by $0.1 billion.
The total proceeds to the Highway Account of the HTF from dedicated excise taxes and other receipts have fallen below annual expenditures for several years. Transfers of Federal General Fund to the Highway Account were made in 2008, 2009 and 2010 to keep the account solvent. Public Law 111-147 transferred $14.7 billion from the General Fund to the Highway Account of the HTF in 2010. In the absence of this transfer, the balance of the Highway Account would have declined rather than increased.
The $29.6 billion identified as Federal General Fund Appropriations in Exhibit 6-1 includes these $14.7 billion of transferred funds as well as the 2010 expenditure of $11.9 billion authorized under the Recovery Act. The remaining $3.0 billion represents highway-related expenditures of a variety of Federal agencies for activities that are not supported by the Federal Highway Trust Fund, including certain programs of the FHWA (such as a portion of the Emergency Relief Program) and the National Highway Traffic Safety Administration, some direct expenditures by other Federal agencies for roads that they own (see Chapter 12 for a discussion of transportation on Federal lands), and payments to States and local governments under some programs managed by other agencies for which road improvements are an eligible activity. As a result of the unusually high reliance on general funds to support highways at the Federal level in 2010, user charges accounted for less than half of the Federal revenue for highways. User charges accounted for a higher share of State revenues (55.8 percent), consisting of motor fuel taxes ($30.3 billion), motor vehicle taxes and fees ($22.8 billion) and tolls ($7.9 billion). Of the other sources, bond proceeds provided the largest revenue for the States ($25.9 billion).
|
American Recovery and Reinvestment Act In February 2009, the American Recovery and Reinvestment Act authorized $48.1 billion for programs administered by the Department of Transportation. The goal was to stimulate the economy by supporting jobs in the construction sector and to invest in critical transportation infrastructure. Of this total, $27.5 billion was appropriated for FHWA. In addition, highway and bridge projects were eligible to compete for Office of the Secretary of Transportation’s Supplemental Discretionary Grant for a National Surface Transportation System program, later referred to as the TIGER I program. Most of the obligation authority for the highway infrastructure investment funds was distributed to the States by the Federal-aid allocation formula. States were required to obligate these funds to specific projects by the end of September 2010 to avoid losing them. The expenditure of these funds is occurring gradually as States are reimbursed by the FHWA for their expenditures over the life of these projects as the work is completed, which is consistent with how the regular Federal-aid highway program operates. The statistics presented in this Chapter reflect expenditures on a cash basis rather than obligations, so the Recovery Act may continue to have an impact on the reported highway revenues and expenditures for several years. The period over which cash expenditures are incurred for an individual project depends on the length of time it takes to complete the work, which can vary by project type. During 2010, $11.9 billion of Recovery Act funds were expended for highway-related activities. |
| Could the Recovery Act project selection process be affecting the spending rates for the regular Federal-aid Highway Program? | |
|
States were under tight deadlines to obligate Recovery Act funds by September 30, 2010, and their progress in obligating these funds was closely monitored by FHWA; less emphasis was placed on the obligation of regular Federal-aid program funds, provided that regular deadlines were met. In addition, States were not required to contribute matching funds for projects funded from the Recovery Act, providing an additional incentive to use these funds before the regular Federal-aid highway program funds. The financial data presented in this report are presented on a cash basis; to the extent that delays in obligating funds for a given project within a given fiscal year affected the start date for that project, this could influence the timing of the cash expenditures associated with that project.
Much of the Recovery Act funding was directed to projects that could be implemented relatively quickly in order to maximize their short-term impacts on employment. This reduced the pool of such potential projects under consideration by States for funding from their regular Federal-aid highway program, which could have affected the relative mix of projects selected. To the extent that some States obligated their Federal-aid highway program funds to projects of longer duration than usual, this would have tended to slow down the average Federal cash spending rate, since cash reimbursements are made to States only after work has been completed. To the extent that such a phenomenon has occurred it could have dampened the initial impacts of Recovery Act funding, but increased the duration of these impacts. |
|
Many States do not permit local governments to impose motor-fuel or motor-vehicle taxes; if allowed they cap them at relatively low levels. Therefore, at the local government level, only $4.1 billion (7.8 percent) of highway funding was provided by user charges in 2010. General fund appropriations contributed $21.8 billion (41.1 percent) toward total local highway revenues, while property taxes generated $9.4 billion (17.7 percent).
The “Investment Income and Other Receipts” category in Exhibit 6-1 includes development fees and special district assessments. Other private sector investment in highways would also be reflected in this category, to the extent that such investment is captured in State and local accounting systems.
|
Private Sector Financing Financing for highways comes from both the public and private sectors. The private sector has increasingly played a role in the delivery of highway infrastructure, but the vast majority of funding is still provided by the public sector. The financial statistics presented in this chapter are predominantly drawn from State reports based on State and local accounting systems. Figures in these systems can include some private sector investment; where it does, these amounts are generally classified as “other receipts.” For additional information on private sector investment in highways, see https://www.fhwa.dot.gov/ipd/p3/. |
| How long has it been since excise tax revenue deposited into the Highway Account exceeded expenditures? | |
|
The last time that annual net receipts credited to the Highway Account of the HTF exceeded annual expenditures from the Highway Account was in 2000. As shown in Exhibit 6-3, for each year since 2000, total annual receipts to the Highway Account from excise taxes and other income (such as interest income and motor carrier safety fines and penalties) have been lower than the annual expenditures from the Highway Account (including amounts transferred to the Transit Account).
To help maintain a positive cash balance in the HTF, three transfers from the General Fund to the HTF were legislatively mandated in FY 2008, FY 2009, and FY 2010. From FY 2007 to FY 2010 gross excise tax receipts from gasoline, diesel and special motor fuels, tires, trucks and trailers, and the heavy vehicle use tax all declined. In 2011, the receipts increased for the first time since 2007. The outlays also increased, retaining the gap between tax revenue deposited in the HTF and the expenditures. 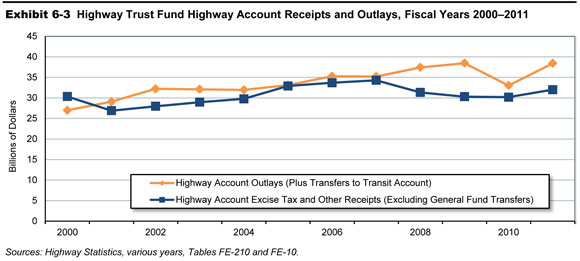
|
|
Revenue Trends
Since the passage of the Federal-Aid Highway Act of 1956 and the establishment of the HTF, user charges such as motor-fuel and motor-vehicle tax receipts have consistently provided the majority of the combined revenues raised for highway and bridge programs by all levels of government.
Exhibit 6-4 shows the trends in revenue for all governments for the period 2000 to 2010. Total revenues have increased on average by 5.4 percent per year between 2000 and 2010. The annual growth in revenue from motor fuel and vehicle taxes was only 1.1 percent per year. General Fund appropriation and Bond issue proceeds each increased by over eleven percent per year. The increase in the General Fund appropriations was particularly strong in 2008 and 2010, when transfers were made from the General Fund to keep the HTF solvent, following many years of cash outlays exceeding cash receipts and running down the reserve balance.
The graph in Exhibit 6-4 illustrates the percentage of revenue from different sources to the total revenue each year for the period 2000 to 2010. The percentage of revenue from user charges, particularly motor fuel and vehicle taxes, has declined over time, whereas the General Fund appropriations and bond proceeds have increased.
Motor fuel tax revenues are sensitive to changes in VMT and fuel efficiency. The growth in VMT over the decade from 2000 to 2010 has averaged 0.8 percent per year in contrast to the previous 10 years, when VMT increased by 2.9 percent per year. In 2008 and 2009, VMT declined each year; 2010 VMT is lower than the 2007 level. Motor fuel efficiency has also increased over the period from 2000 to 2010; from an average of 16.9 miles traveled per gallon of fuel consumed to 17.4 miles traveled per gallon of fuel consumed (Highway Statistics, Table VM-1). Some States compensated for declines in user revenues by increasing fuel tax rates and other motor vehicle taxes. The weighted average State gasoline motor fuel tax increased from 19.96 cents per gallon in 2000 to 21.82 cents per gallon in 2010. Similarly, the diesel motor fuel tax rate increased from 19.96 cents per gallon to 22.36 cents per gallon (Highway Statistics, Table MF-205). The increases in tax rates were more evident after 2005. The decline in user revenues was offset by increasing revenues from other sources. Transfers from the General Fund helped to sustain the HTF at the level necessary to support the federal spending levels specified in the SAFETEA-LU. Bond issue proceeds increased from $20.9 billion in 2008 to $33.0 billion in 2010, a 58 percent increase in two years.
| Source | Highway Revenue, Billions of Dollars | Annual Rate of Change 2010/2000 | |||||
|---|---|---|---|---|---|---|---|
| 2000 | 2002 | 2004 | 2006 | 2008 | 2010 | ||
| Motor-Fuel and Motor-Vehicle Taxes | $75.6 | $73.1 | $76.4 | $85.4 | $84.7 | $84.3 | 1.1% |
| Tolls | $5.7 | $6.6 | $6.6 | $8.3 | $9.1 | $9.6 | 5.3% |
| Property Taxes and Assessments | $6.1 | $6.5 | $7.5 | $9.0 | $9.0 | $9.4 | 4.4% |
| General Fund Appropriations | $19.3 | $20.3 | $23.6 | $28.3 | $40.0 | $58.6 | 11.8% |
| Other Taxes and Fees | $5.7 | $7.5 | $7.9 | $10.1 | $12.2 | $12.2 | 7.8% |
| Investment Income & Other Receipts | $7.3 | $8.1 | $7.6 | $9.7 | $16.6 | $13.9 | 6.6% |
| Bond Issue Proceeds | $11.3 | $12.7 | $15.8 | $18.3 | $20.9 | $33.0 | 11.3% |
| Total Revenues | $131.1 | $134.8 | $145.3 | $169.0 | $192.6 | $221.0 | 5.4% |
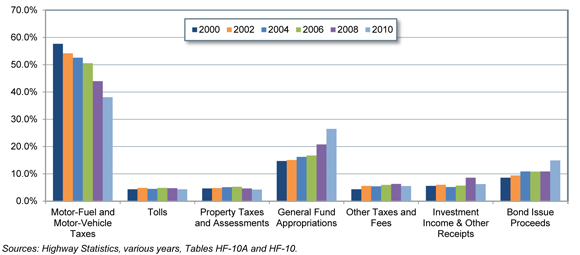
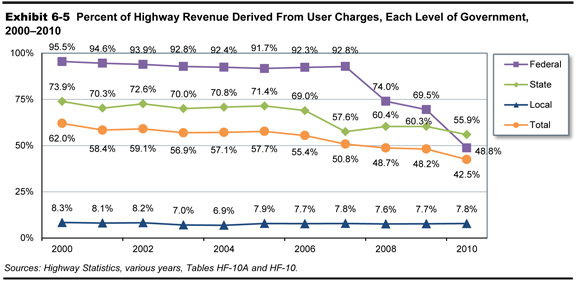
Exhibit 6-5 shows the change in the share of highway revenue derived from user charges by the level of government. The share has declined for all levels of government combined from 2000 to 2010, but the decline has been more significant for the Federal user charges, from 95.5 percent to 48.8 percent. As noted earlier, the declines since 2007 can be attributed in part from General Fund transfers to the HTF, as well as general funds provided through the Recovery Act. State user revenue share has declined to 42.5 percent from 62.0 percent. User charges have also declined as a share of local government revenue.
Highway Expenditures
Highway expenditures by all levels of government combined totaled $205.3 billion in 2010, as seen in Exhibits 6-1 and 6-5. Exhibit 6-6 breaks down the Federal, State and Local expenditures by type. The rows “Funding Sources for Capital Outlay” and “Funding Sources for Total Expenditures” indicate the level of government that provided the funding for those expenditures. These expenditures represent cash outlays, not authorizations or obligations of funds. (The terms “expenditures”, “spending” and “outlays” are used interchangeably in this report.)
While the Federal government funded $47.1 billion of highway expenditures in 2010, direct Federal spending on capital outlay, maintenance, administration and research amounted to only $3.6 billion (1.8 percent of all highway expenditures). The remaining $43.5 billion was in the form of transfers to State and local governments.
State governments combined $42.1 billion of Federal funds, $81.9 billion of State funds and $3.1 billion of local funds to support direct expenditures of $127.1 billion (61.9 percent of all highway expenditures). Local governments directly spent $1.4 billion of Federal funds, $23.4 billion of State funds and $49.8 billion of local funds on highways, totaling $74.6 billion (36.3 percent of all highway expenditures).
Types of Highway Expenditures
As shown in Exhibit 6-6, in 2010 all levels of government spent $100.0 billion (48.8 percent) of highway expenditures on capital outlay. Additional information on types of capital outlay and the distribution of capital outlay by type of highway facility is presented later in this chapter. Combined spending on maintenance and traffic services of $48.8 billion represented 23.7 percent on total highway expenditures.
The majority of Federal funding for highways goes for capital outlay rather than noncapital expenditures, which are funded primarily by State and local governments. The Federal government funded 44.3 percent of capital outlay in 2008, but only 22.9 percent of total highway expenditures.
In terms of direct highway expenditures by expending agency, State expenditures represent a majority of total spending for most expenditure types. The exceptions are the “maintenance” and “highway patrol and safety categories” identified in Exhibit 6-6. Local governments spent $20.1 billion on maintenance in 2010, which is 60.2 percent of total maintenance spending by all levels of government combined. Local governments also spent $9.4 billion on highway patrol and safety expenditures, representing 52.0 percent of combined spending on these activities by all levels of government.
| Highway Expenditures (Billions of Dollars) | Percent | ||||
|---|---|---|---|---|---|
| Federal | State | Local | Total | ||
| Expenditures by Type | |||||
| Capital Outlay | $0.8 | $72.6 | $26.8 | $100.2 | 48.8% |
| Noncapital Expenditures | |||||
| Maintenance | $0.3 | $13.0 | $20.1 | $33.4 | 16.2% |
| Highway and Traffic Services | $0.0 | $9.0 | $6.5 | $15.4 | 7.5% |
| Administration | $2.4 | $8.8 | $4.9 | $16.2 | 7.9% |
| Highway Patrol and Safety | $0.0 | $8.7 | $9.4 | $18.1 | 8.8% |
| Interest on Debt | $0.0 | $7.0 | $2.9 | $9.8 | 4.8% |
| Subtotal | $2.7 | $46.4 | $43.7 | $92.9 | 45.2% |
| Total, Current Expenditures | $3.6 | $119.0 | $70.5 | $193.0 | 94.0% |
| Bond Retirement | $0.0 | $8.1 | $4.1 | $12.3 | 6.0% |
| Total, All Expenditures | $3.6 | $127.1 | $74.6 | $205.3 | 100.0% |
| Funding Sources for Capital Outlay | |||||
| Funded by Federal Government* | $0.8 | $42.1 | $1.4 | $44.4 | 44.3% |
| Funded by State or Local Govts* | $0.0 | $30.4 | $25.4 | $55.8 | 55.7% |
| Total | $0.8 | $72.5 | $26.8 | $100.2 | 100.0% |
| Funding Sources for Total Expenditures | |||||
| Funded by Federal Government* | $3.6 | $42.1 | $1.4 | $47.1 | 22.9% |
| Funded by State Governments* | $0.0 | $81.9 | $23.4 | $105.3 | 51.3% |
| Funded by Local Governments* | $0.0 | $3.1 | $49.8 | $52.9 | 25.8% |
| Total | $3.6 | $127.1 | $74.6 | $205.3 | 100.0% |
Historical Expenditure and Funding Trends
Exhibit 6-7 breaks out expenditures by type since 2000. The largest percentage increases related to debt service, as bond retirement expenditures grew at an average annual rate of 9.2 percent from 2000 to 2010, while interest on debt grew an average annual rate of 7.9 percent. Total highway expenditures grew by 5.3 percent per year over this period in nominal dollar terms, while capital outlay rose at an average annual rate of 5.0 percent, capital expenditures becoming a smaller share of total expenditures.
| Highway Expenditures, Billions of Dollars | Annual Rate of Change 2010/2000 | ||||||
|---|---|---|---|---|---|---|---|
| 2000 | 2002 | 2004 | 2006 | 2008 | 2010 | ||
| Expenditure Type | |||||||
| Capital Outlay | $61.3 | $68.2 | $70.3 | $80.2 | $90.4 | $100.2 | 5.0% |
| Maintenance and Traffic Services | $30.6 | $33.2 | $36.3 | $40.8 | $45.9 | $48.8 | 4.8% |
| Administration | $10.0 | $10.7 | $12.7 | $13.1 | $17.8 | $16.2 | 4.9% |
| Highway Patrol and Safety | $11.0 | $11.7 | $14.3 | $14.7 | $17.3 | $18.1 | 5.1% |
| Interest on Debt | $4.6 | $5.4 | $5.8 | $6.6 | $8.5 | $9.8 | 7.9% |
| Total, Current Expenditures | $117.6 | $129.1 | $139.5 | $155.5 | $180.0 | $193.0 | 5.1% |
| Bond Retirement | $5.1 | $6.8 | $8.0 | $8.1 | $8.6 | $12.3 | 9.2% |
| Total, All Expenditures | $122.7 | $135.9 | $147.5 | $163.5 | $188.5 | $205.3 | 5.3% |
|
Highway Expenditure Terminology The classification of the revenue and expenditure items in this report is based on definitions contained in A Guide to Reporting Highway Statistics, the instructional manual for States providing financial data for the Highway Statistics publication.
|
Exhibit 6-8 shows that Federal funding for highways grew more quickly from 2000 to 2010 than did State or local funding. The portion of total highway expenditures rose from 22.4 percent to 22.9 percent over this period, while the Federally funded share of highway capital outlay rose from 42.6 percent to 44.3 percent. As noted earlier in this chapter, the Federal expenditure figures for 2010 include $11.9 billion funded by the Recovery Act. As Federally funded highway expenditures grew by only $7.3 billion from 2008 to 2010 (from $39.8 billion to $47.1 billion), this indicates that cash-basis expenditures funded from other Federal sources declined over this 2-year period.
Despite budgetary pressures relating to the recent recession, State funding for highways increased from $96.6 billion in 2008 to $105.3 billion in 2010. Local government funding also increased slightly during this period, from $52.2 billion in 2008 to $52.9 billion in 2010.
| Highway Funding, Billions of Dollars | Annual Rate of Change 2010/2000 | ||||||
|---|---|---|---|---|---|---|---|
| 2000 | 2002 | 2004 | 2006 | 2008 | 2010 | ||
| Capital Outlay | |||||||
| Funded by Federal Government | $26.1 | $31.5 | $30.8 | $34.6 | $37.6 | $44.4 | 5.4% |
| Funded by State or Local Govt's | $35.2 | $36.7 | $39.5 | $45.6 | $52.8 | $55.8 | 4.7% |
| Total | $61.3 | $68.2 | $70.3 | $80.2 | $90.4 | $100.2 | 5.0% |
| Federal Share | 42.6% | 46.1% | 43.8% | 43.1% | 41.6% | 44.3% | |
| Total Expenditures | |||||||
| Funded by Federal Government | $27.5 | $32.8 | $33.1 | $36.3 | $39.8 | $47.1 | 5.5% |
| Funded by State Governments | $62.7 | $69.0 | $72.8 | $77.4 | $96.6 | $105.3 | 5.3% |
| Funded by Local Governments | $32.6 | $34.1 | $41.6 | $49.8 | $52.2 | $52.9 | 5.0% |
| Total | $122.7 | $135.9 | $147.5 | $163.5 | $188.5 | $205.3 | 5.3% |
| Federal Share | 22.4% | 24.1% | 22.4% | 22.2% | 21.1% | 22.9% | |
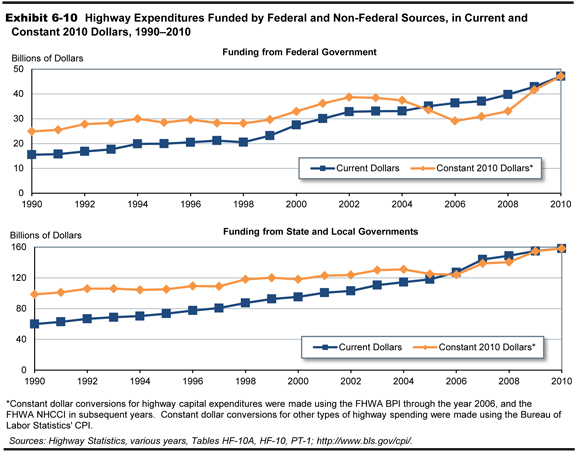
Constant Dollar Expenditures
Exhibits 6-9 and 6-10 display time series data on highway expenditures in both current (nominal) and constant (real) 2010 dollars. While there have been periods of decrease in constant dollars for both highway capital expenditures and total highway expenditures, both reached an all-time high in 2010.
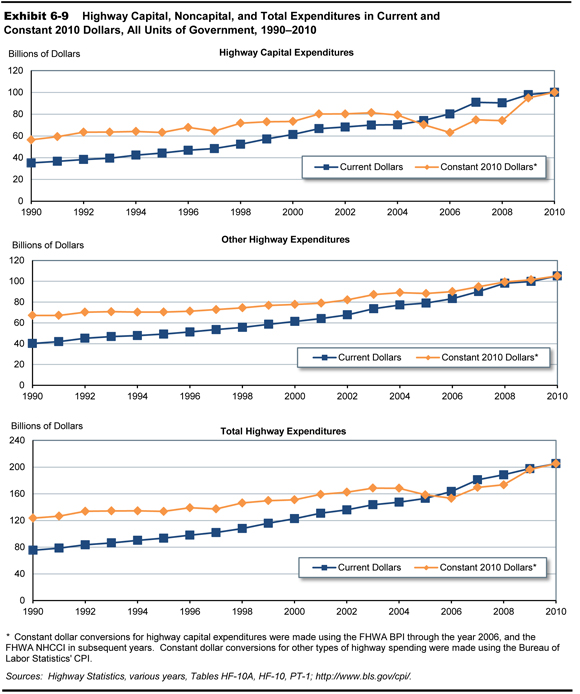
For the 20-year period from 1990 to 2010, highway capital spending increased at an average annual rate of 2.9 percent in constant dollar terms, slightly above the 2.6 percent annual constant dollar growth rate for total highway expenditures. Constant dollar spending grew more quickly over the 10-year period from 2000 to 2010, rising 3.2 percent annually for capital expenditures and 3.1 percent annually for total highway expenditures.
From 1990 to 2010, Federally funded highway expenditures increased at an average annual rate of 3.2 percent in constant dollar terms; State and local constant dollar expenditures grew more slowly, rising by 2.4 percent per year on average. For the 10-year period from 2000 to 2010, Federally funded constant dollar highway expenditures rose 3.6 percent per year, compared to a 3.0 percent average annual increase for State and local governments.
| What highway inflation indices are used in this report? | |
|
There are significant differences in the types of inputs of materials and labor that are associated with different types of highway expenditures; for example, on a dollar-per-dollar basis, highway maintenance activities are generally more labor intensive than highway construction activities. This report uses different indices for converting nominal dollar highway spending to constant dollars for capital and noncapital expenditures. For constant dollar conversions for highway capital expenditures, the Federal Highway Administration (FHWA) Composite Bid Price Index (BPI) is used through the year 2006, the last year for which this index was produced. Capital expenditure conversions for subsequent years rely on a new index, the FHWA National Highway Construction Cost Index (NHCCI). Constant dollar conversions for other types of highway expenditures are based on the Bureau of Labor Statistics’ Consumer Price Index (CPI).
Exhibit 6-11 illustrates the trends in cost indices used in the report, converted to a common base year of 2003 (the first year of the NHCCI). Over the 20-year period from 1990 to 2010, the CPI increased by 66.8 percent; in contrast, the combination of the BPI and NHCCI rose by 60.5 percent. Industry-specific indices such as the BPI and NHCCI tend to be more volatile than the CPI, which reflects general trends within the overall economy. This volatility was demonstrated in the period between 2004 and 2006 as sharp increases in the prices of materials such as steel, asphalt, and cement caused the BPI to increase by 43.3 percent, compared with a 6.7 percent increase in the CPI. Since 2006, the NHCCI has decreased by 21.3 percent, so that the purchasing power of each dollar spent in 2010 is significantly higher. This enabled many States to fund more projects under the Recovery Act than they had initially expected. 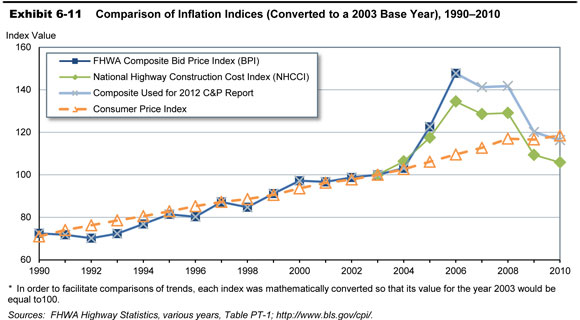
|
|
Highway Capital Outlay
States provide the FHWA with detailed data on what they spend on arterials and collectors, classifying capital outlay on each functional system into 17 improvement types. Direct State expenditures on arterials and collectors totaled $63.0 billion in 2010, drawing upon a combination of State revenues, transfers from the Federal government, and transfers from local governments. Exhibit 6-12 illustrates the distribution of these expenditures by improvement type, and how these improvement types have been allocated among three broad categories: system rehabilitation, system expansion, and system enhancement. These broad categories are also used in Chapter 7 to discuss the different components of future capital investment scenarios. Exhibit 6-12 presents an estimated distribution of total highway capital outlay by all levels of government on all roads. Of the $100.2 billion in total highway capital outlay, an estimated $60.0 billion was used for system rehabilitation, $27.4 billion went for system expansion, and $12.8 billion was used for system enhancement. These estimates are derived based primarily on State expenditure patterns on arterials and collectors, along with limited data from other sources.
| How are “system rehabilitation,” “system expansion,” and “system enhancement” defined in this report? | |
|
System rehabilitation consists of capital improvements on existing roads and bridges that are intended to preserve the existing pavement and bridge infrastructure. These activities include reconstruction, resurfacing, pavement restoration or rehabilitation, widening of narrow lanes or shoulders, bridge replacement, and bridge rehabilitation. Also included is the portion of widening (lane addition) projects estimated to be related to reconstructing or improving existing lanes. System rehabilitation does not include routine maintenance costs.
System expansion includes construction of new roads and new bridges and addition of new lanes to existing roads. This includes all “New Construction,” “New Bridge,” “Major Widening,” and most of the costs associated with “Reconstruction-Added Capacity,” except for the portion of these expenditures estimated to be related to improving the existing lanes of a facility. System enhancement includes safety enhancements, traffic operations improvements such as the installation of intelligent transportation systems, and environmental enhancements. |
|
| Type of Expenditure | Distribution of Capital Outlay, Billions of Dollars | Total Outlay | |||
|---|---|---|---|---|---|
| System Rehabilitation | System Expansion New Roads and Bridges |
System Expansion Existing Roads |
System Enhancements | ||
| Direct State Expenditures on Arterials and Collectors | |||||
| Right-of-Way | $1.5 | $2.2 | $3.7 | ||
| Engineering | $4.7 | $0.7 | $1.1 | $0.7 | $7.2 |
| New Construction | $4.8 | $4.8 | |||
| Relocation | $1.0 | $1.0 | |||
| Reconstruction—Added Capacity | $1.7 | $4.0 | $5.7 | ||
| Reconstruction—No Added Capacity | $3.3 | $3.3 | |||
| Major Widening | $3.1 | $3.1 | |||
| Minor Widening | $1.3 | $1.3 | |||
| Restoration and Rehabilitation | $17.1 | $17.1 | |||
| Resurfacing | $0.0 | $0.0 | |||
| New Bridge | $0.5 | $0.5 | |||
| Bridge Replacement | $5.5 | $5.5 | |||
| Major Bridge Rehabilitation | $3.0 | $3.0 | |||
| Minor Bridge Work | $2.1 | $2.1 | |||
| Safety | $2.1 | $2.1 | |||
| Traffic Management/Engineering | $0.9 | $0.9 | |||
| Environmental and Other | $1.8 | $1.8 | |||
| Total, State Arterials and Collectors | $38.7 | $7.5 | $11.4 | $5.4 | $63.0 |
| Total, Arterials and Collectors, All Jurisdictions (estimated)* | |||||
| Highways and Other | $33.8 | $8.8 | $13.9 | $7.0 | $63.6 |
| Bridges | $13.1 | $0.7 | $13.8 | ||
| Total, Arterials and Collectors | $46.9 | $9.5 | $13.9 | $7.0 | $77.4 |
| Total Capital Outlay on All Systems (estimated)* | |||||
| Highways and Other | $42.9 | $11.5 | $15.0 | $12.8 | $82.2 |
| Bridges | $17.1 | $0.9 | $18.0 | ||
| Total, All Systems | $60.0 | $12.4 | $15.0 | $12.8 | $100.2 |
| Percent of Total | 59.9% | 12.4% | 15.0% | 12.8% | 100.0% |
Exhibit 6-13 shows the distribution of capital expenditures by type and functional system. $31.4 billion was invested on rural arterials and collectors in 2010, with 65.1 percent directed towards system rehabilitation and 27.4 percent towards expansion; the remainder was directed toward system enhancement. Capital outlays on urban arterials and collectors were $46.0 billion, of which 57.7 percent went for system rehabilitation and 32.2 percent went for system expansion.
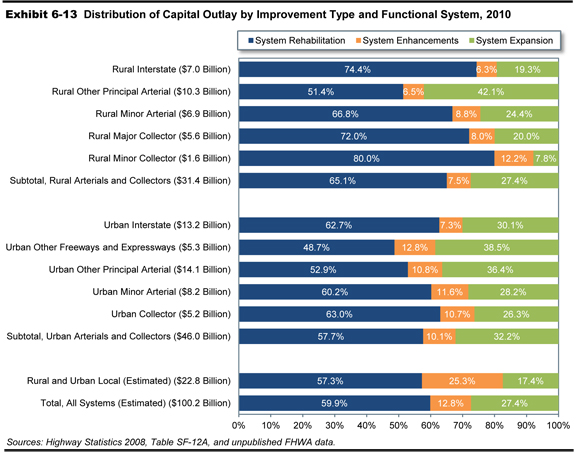
Exhibit 6-14, shows trends in capital outlays by improvement type from 2000 to 2010. Each year, a majority of capital outlays were directed towards system rehabilitation reflecting the need to preserve the aging system. However, system preservation’s share of total capital spending rose dramatically between 2008 and 2010, rising from 51.1 percent to 59.9 percent. System rehabilitation expenditures increased from $46.2 billion to $60.0 billion, an increase of almost 30 percent over the 2 years. This dramatic increase was partly driven by the Recovery Act. One of the goals of the Recovery Act was to support jobs through construction expenditures, providing an incentive for the selection of projects that could be initiated and completed relatively quickly. This led many States to direct a larger portion of their Recovery Act funding toward pavement improvement projects than they usually do from regular Federal-aid funds in a typical year. (For example, in 2008, States obligated 42.3 percent to the types of projects that would be classified as “System Rehabilitation-Highway” in this report. However, the share of Recovery Act funding obligated for such projects in 2009 and 2010 was 58.3 percent. This was however, partially offset by a lower share of Recovery Act funding being obligated to the “System Rehabilitation-Bridges” category.)
| Improvement Type | Capital Outlay, Billions of Dollars | Annual Rate of Change 2010/2000 | |||||
|---|---|---|---|---|---|---|---|
| 2000 | 2002 | 2004 | 2006 | 2008 | 2010 | ||
| System Rehabilitation | |||||||
| Highway | $25.0 | $25.5 | $26.7 | $31.0 | $33.5 | $42.9 | 5.5% |
| Bridge | $7.3 | $10.7 | $9.6 | $10.3 | $12.7 | $17.1 | 8.9% |
| Subtotal | $32.3 | $36.2 | $36.3 | $41.3 | $46.2 | $60.0 | 6.4% |
| System Expansion | |||||||
| Additions to Existing Roadways | $11.4 | $11.9 | $12.1 | $14.0 | $15.7 | $15.0 | 2.8% |
| New Routes | $10.5 | $11.4 | $12.6 | $15.2 | $16.1 | $11.5 | 0.9% |
| headers="hn2"New Bridges | $1.1 | $1.1 | $1.4 | $1.2 | $1.5 | $0.9 | -2.0% |
| Subtotal | $23.0 | $24.4 | $26.1 | $30.4 | $33.3 | $27.4 | 1.8% |
| System Enhancements | $6.1 | $7.6 | $7.8 | $8.5 | $10.9 | $12.8 | 7.7% |
| Total | $61.3 | $68.2 | $70.3 | $80.2 | $90.4 | $100.2 | 5.0% |
| Percent of Total Capital Outlay | |||||||
| System Rehabilitation | 52.7% | 53.1% | 51.7% | 51.5% | 51.1% | 59.9% | |
| System Expansion | 37.4% | 35.8% | 37.1% | 37.9% | 36.9% | 27.4% | |
| System Enhancements | 9.9% | 11.1% | 11.2% | 10.6% | 12.0% | 12.8% | |
Over the 10-year period from 2000 to 2010, system rehabilitation expenditures grew at an average annual rate of 6.4 percent. System expansion expenditures have increased at a slower average annual rate of 1.8 percent, resulting in a decline in share of total capital outlays from 37.4 percent in 2000 to 27.4 percent in 2010. System enhancement expenditures have grown more quickly, rising from 9.9 percent of total capital outlays in 2000 to 12.8 percent in 2010.
| How have constant dollar expenditures for different capital improvement types grown in recent years? | |
|
As noted earlier in this section, total capital outlay by all levels of government grew at an average annual rate of 3.2 percent from 2000 to 2010 in constant dollar terms. Constant dollar system rehabilitation expenditures rose by 4.5 percent per year over this period, while system expansion expenditures showed little annual change. Expenditures for system enhancements grew by 5.8 percent per year in constant dollar terms from 2000 to 2010.
|
|
| Was the share of recovery funds spent on system rehabilitation higher than the share of 2008 system rehabilitation expenditures? | |
|
The spending pattern of the Recovery Act funds has been different from the year 2008 spending. Exhibit 6-15 presents the 2008 FHWA obligations and Recovery Act obligations and expenditures through December 2010. Rehabilitation expenditures account for more than 50 percent of the obligations for both periods, but under the Recovery Act, the share has increased to above 60 percent in obligations and well over 70 percent in the funds expended through December 2010.
The Recovery Act had specific requirements regarding the time by which the funds had to be obligated. The objectives of the Act were to ensure that funds were quickly invested to support construction jobs lost due to the economic recession. To encourage the States and other funding recipients to select projects quickly, they were required to obligate 50 percent of the Recovery Act funds (excluding sub-allocations to local entities) within 120 days of apportionment or lose funding to other States that were successful in meeting this deadline. All recipients were required to obligate 100 percent of their funds by the end of September 2010 or lose what was remaining. States were requested to select projects that were ready. This resulted in choosing projects that required minimum level of planning and approval. This favored the selection of rehabilitation and replacement projects. The share of Recovery Act expenditures for system rehabilitation is higher than the share of Recovery Act funds obligated for that purpose (74.7 per cent compared to 67.6 per cent) because rehabilitation and resurfacing projects are likely to incur expenditures sooner than other types of projects. Resurfacing and pavement rehabilitation typically require less advance planning and can be completed in a shorter timeframe. Alternatively, expansion projects require more planning and coordination and may include purchase of right of way, and project construction may range from a few months to multiple years. 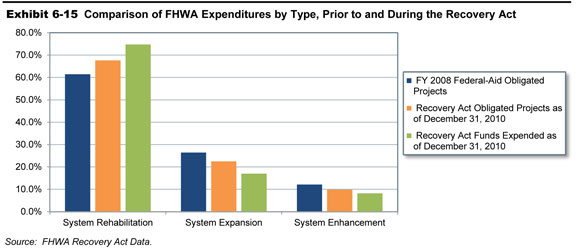
|
|
Capital Outlays on Federal-Aid Highways
As discussed in Chapter 2, the term “Federal-aid Highways” refers to roads that are generally eligible for Federal funding, and excludes roads that are functionally classified as rural minor, rural local or urban local. Exhibit 6-16 shows that total capital outlays on Federal-aid highways increased at an average annual rate of 4.6 percent from 2000 to 2010, rising to $75.8 billion in 2010.
Capital outlays on system rehabilitation increased from $35.5 billion in 2008 to $45.6 billion in 2010, an increase greater than the increase in total capital outlays on the Federal-aid system. The share of system rehabilitation increased from 50.7 percent in 2008 to 60.2 percent in 2010.
| Improvement Type | Capital Outlay, Billions of Dollars | Annual Rate of Change 2010/2000 | |||||
|---|---|---|---|---|---|---|---|
| 2000 | 2002 | 2004 | 2006 | 2008 | 2010 | ||
| System Rehabilitation | |||||||
| Highway | $19.3 | $19.6 | $19.4 | $22.9 | $26.1 | $33.1 | 5.5% |
| Bridge | $5.5 | $8.3 | $7.2 | $7.7 | $9.3 | $12.5 | 8.6% |
| Subtotal | $24.8 | $27.9 | $26.6 | $30.6 | $35.5 | $45.6 | 6.3% |
| System Expansion | |||||||
| Additions to Existing Roadways | $10.4 | $11.0 | $11.6 | $12.9 | $14.3 | $13.8 | 2.9% |
| New Routes | $8.4 | $9.1 | $9.8 | $12.0 | $12.8 | $8.8 | 0.4% |
| New Bridges | $0.9 | $0.9 | $1.2 | $0.9 | $1.0 | $0.7 | -2.5% |
| Subtotal | $19.7 | $21.0 | $22.6 | $25.9 | $28.1 | $23.3 | 1.7% |
| System Enhancements | $3.8 | $4.8 | $5.0 | $5.5 | $6.4 | $6.8 | 6.1% |
| Total | $48.3 | $53.7 | $54.2 | $61.9 | $70.0 | $75.8 | 4.6% |
| Percent of Total Capital Outlay | |||||||
| System Rehabilitation | 51.4% | 52.0% | 49.1% | 49.3% | 50.7% | 60.2% | |
| System Expansion | 40.8% | 39.1% | 41.6% | 41.9% | 40.1% | 30.8% | |
| System Enhancements | 7.8% | 8.9% | 9.3% | 8.8% | 9.2% | 9.0% | |
Capital Outlays on the National Highway System
The National Highway System (NHS) includes roads important to the Nation’s economy, defense and mobility, as described in chapter 2. Exhibit 6-17 shows that $44.4 billion of capital investments were made on the NHS in 2010, having grown at an average annual rate of 4.0 percent since 2000.
On the NHS, the shift within capital expenditures towards system rehabilitation is even more significant than for all highways and the Federal-aid system. NHS system rehabilitation expenditures increased from $20.4 billion to $27.3 billion, increasing its share of total capital spending from 48.5 percent in 2008 to 61.5 percent in 2010.
| Improvement Type | Capital Outlay, Billions of Dollars | Annual Rate of Change 2010/2000 | |||||
|---|---|---|---|---|---|---|---|
| 2000 | 2002 | 2004 | 2006 | 2008 | 2010 | ||
| System Rehabilitation | |||||||
| Highway | $11.1 | $10.6 | $9.5 | $12.3 | $14.9 | $19.9 | 6.0% |
| Bridge | $3.1 | $4.5 | $4.0 | $4.3 | $5.4 | $7.4 | 9.3% |
| Subtotal | $14.2 | $15.1 | $13.5 | $16.6 | $20.4 | $27.3 | 6.8% |
| System Expansion | |||||||
| Additions to Existing Roadways | $6.4 | $7.1 | $7.1 | $8.1 | $9.2 | $8.6 | 3.1% |
| New Routes | $6.6 | $6.7 | $6.8 | $8.9 | $8.6 | $4.7 | -3.3% |
| New Bridges | $0.8 | $0.6 | $0.9 | $0.7 | $0.6 | $0.3 | -7.9% |
| Subtotal | $13.7 | $14.5 | $14.8 | $17.7 | $18.3 | $13.7 | 0.0% |
| System Enhancements | $2.0 | $2.8 | $2.8 | $2.8 | $3.3 | $3.4 | 5.6% |
| Total | $29.9 | $32.4 | $31.1 | $37.2 | $42.0 | $44.4 | 4.0% |
| Percent of Total Capital Outlay | |||||||
| System Rehabilitation | 47.5% | 46.7% | 43.5% | 44.7% | 48.5% | 61.5% | |
| System Expansion | 46.0% | 44.7% | 47.6% | 47.7% | 43.7% | 30.9% | |
| System Enhancements | 6.6% | 8.7% | 8.9% | 7.6% | 7.8% | 7.6% | |
|
Capital Outlay on the Enhanced NHS MAP-21 redefines the NHS to include principal arterial mileage not previously included, as well as connectors to the added principal arterials. In 2010, capital outlay on the NHS totaled $44.4 billion, while capital outlay on principal arterials not on the NHS totaled $8.4 billion. Adding the two produces an estimated capital outlay figure of $53.9 billion. |
Capital Outlays on the Interstate System
The Interstate system supports the movement of goods and people across the country. Exhibit 6-18 shows that the total capital outlay expenditures for 2010 were $20.2 billion, an increase of only $0.2 billion from 2008, a very low growth compared to the historic growth rates. System rehabilitation expenditures increased from $10.8 billion in 2008 to $13.5 billion in 2010, and the system expansion expenditures decreased from $7.8 billion to $5.3 billion, resulting in a system rehabilitation share of 66.7 percent and system expansion of 26.3 percent in 2010.
| Improvement Type | Capital Outlay, Billions of Dollars | Annual Rate of Change 2010/2000 | |||||
|---|---|---|---|---|---|---|---|
| 2000 | 2002 | 2004 | 2006 | 2008 | 2010 | ||
| System Rehabilitation | |||||||
| Highway | $5.8 | $5.5 | $4.7 | $5.8 | $7.5 | $9.4 | 4.9% |
| Bridge | $1.6 | $2.4 | $2.3 | $2.5 | $3.3 | $4.1 | 9.9% |
| Subtotal | $7.4 | $8.0 | $7.0 | $8.3 | $10.8 | $13.5 | 6.2% |
| System Expansion | |||||||
| Additions to Existing Roadways | $2.5 | $3.2 | $2.9 | $3.2 | $4.5 | $3.5 | 3.6% |
| New Routes | $2.6 | $2.5 | $2.5 | $3.5 | $3.0 | $1.7 | -4.3% |
| New Bridges | $0.4 | $0.2 | $0.2 | $0.3 | $0.3 | $0.1 | -9.4% |
| Subtotal | $5.5 | $5.9 | $5.6 | $7.1 | $7.8 | $5.3 | -0.3% |
| System Enhancements | $0.9 | $1.4 | $1.1 | $1.2 | $1.4 | $1.4 | 4.2% |
| Total | $13.8 | $15.3 | $13.7 | $16.5 | $20.0 | $20.2 | 3.9% |
| Percent of Total Capital Outlay | |||||||
| System Rehabilitation | 53.7% | 52.1% | 50.8% | 49.9% | 53.9% | 66.7% | |
| System Expansion | 39.6% | 38.5% | 40.9% | 42.6% | 38.9% | 26.3% | |
| System Enhancements | 6.7% | 9.4% | 8.3% | 7.4% | 7.1% | 6.9% | |
Innovative Finance
In recent years, State and Local transportation agencies have adopted new ways of financing and delivering transportation projects. In the face of stagnating public revenues and demanding fiscal requirements, many jurisdictions are utilizing innovative options such as public-private partnerships, Federal credit assistance, and other debt financing tools. These strategies may enable financially strapped public agencies to deliver costly and complex infrastructure projects much earlier than would be possible through traditional mechanisms.
Public-Private Partnerships
Public-Private Partnerships (P3s) are contractual agreements formed between a public agency and a private entity that allow for greater private sector participation in the delivery and financing of transportation projects. Typically, this participation involves the private sector taking on additional project risks, such as design, finance, long-term operation, maintenance, or traffic revenue. P3s are undertaken for a variety of purposes, including monetizing the value of existing assets, developing new transportation facilities, or rehabilitating or expanding existing facilities. While P3s may offer certain advantages, such as increased financing capacity and reducing up-front costs, the public sector still must identify a source of revenue for the project to provide a return to the private partner’s investment, and must ensure that the goals and interests of the public are adequately secured.
Additional information on P3s is available at https://www.fhwa.dot.gov/ipd/p3/.
|
Public-Private Partnership Project: IH-635 Managed Lanes (LBJ Express) The LBJ Express Project will relieve congestion north of Dallas on 13 miles of IH-635 (LBJ Freeway) from just west of IH-35E to just east of US-75, and south on IH-35E from I-635 to Loop 12. The project will involve:
The project is being built under a public-private partnership (Comprehensive Development Agreement) executed in September 2009 between the Texas Department of Transportation and LBJ Infrastructure Group, which will operate and maintain the facility for 52 years. Construction began in early 2011 and is expected to be complete by December 2015. The total cost of the project is $2.6 billion. |
Federal Credit Assistance
Federal credit assistance for highway improvements can take one of two forms: loans, where project sponsors borrow Federal highway funds directly from a State DOT or the Federal government; and credit enhancements, where a State DOT or the Federal government makes Federal funds available on a contingent (or standby) basis. Credit enhancement helps reduce risk to investors and thus allows project sponsors to borrow at lower interest rates. Loans can provide the capital necessary to proceed with a project, and reduce the amount of capital borrowed from other sources, and may also serve a credit enhancement function by reducing the risk borne by other investors. Federal tools currently available to project sponsors include the Transportation Infrastructure and Finance Innovation Act (TIFIA) program, State Infrastructure Bank (SIB) programs, and Section 129 loans.
The TIFIA Credit Program provides Federal credit assistance in the form of direct loans, loan guarantees, and standby lines of credit to finance surface transportation projects of national and regional significance. A TIFIA project must pledge repayment in whole or in part with dedicated revenue sources such as tolls, user fees, special assessments (taxes), or other non-Federal sources. SIBs are State-run revolving funds that provide loans, credit enhancements, and other forms of non-grant assistance to surface transportation projects. SIBs can be capitalized with regularly apportioned Federal-aid funds. Section 129 loans allow States to lend apportioned Federal-aid highway funds to toll and non-toll projects generating dedicated revenue streams.
Additional information on credit assistance tools is available at https://www.fhwa.dot.gov/ipd/finance/tools_programs/federal_credit_assistance/
|
Federal Credit Assistance Project – Port of Miami Tunnel The Port of Miami Tunnel will improve access to and from the Port of Miami, serving as a dedicated roadway connector linking the port (located on an island in Biscayne Bay) with the MacArthur Causeway and I-395 on the mainland. Currently, the Port is linked to the mainland only by the Port Bridge. The project includes a tunnel under the Main Channel (the shipping channel between Dodge and Watson Islands), roadway work on Dodge Island and Watson Island/MacArthur Causeway, and widening the MacArthur Causeway Bridge. Twin tubes, each 3,900 feet long and 41 feet in diameter, will reach a depth of 120 feet below the water. The project is being developed and operated as a public-private partnership with Miami Access Tunnel, LLC (MAT). Under the concession agreement, the Florida DOT will provide MAT with milestone payments during the construction period (2010–2014) and a final acceptance payment upon construction completion in 2014. This will be followed by 30 years of availability payments during the operating period. Deductions will be made from this amount if MAT's operation of the facility does not meet prescribed performance standards. The State has agreed to pay for approximately 50 percent of the capital costs (design and construction) and all operations and maintenance, while the remaining 50 percent of the capital costs will be provided by Miami-Dade County and the City of Miami. Financing for this $1.1 billion project includes a $341 million TIFIA loan secured by a pledge of the availability payments due to the concessionaire. The TIFIA loan was executed in October 2009. |
Debt Financing Tools
Some transportation projects are so large that their cost exceeds available current grant funding and tax receipts or would consume so much of these current funding sources as to delay many other planned projects. For this reason, State and local governments often look to finance large projects through borrowing, which provides an immediate influx of cash to fund project construction costs. The borrower then retires the debt by making principal and interest payments over time. Tax-exempt municipal bonds, backed by future government revenues, are the most common method of borrowing by government agencies for transportation projects.
Three innovative debt instrument tools—Grant Anticipation Revenue Vehicles (GARVEEs), Private Activity Bonds (PABs), and Build America Bonds (BABs)—provide further borrowing opportunities. A GARVEE is a debt financing instrument—such as a bond, note, certificate, mortgage, lease, or other debt financing technique—that has a pledge of future Federal-aid funding. PABs are debt instruments issued by State or local governments on behalf of a private entity for highway and freight transfer projects, allowing a private project sponsor to benefit from the lower financing costs of tax-exempt municipal bonds. BABs, which were authorized by the American Recovery and Reinvestment Act (Recovery Act), are taxable bonds that are eligible for an interest rate subsidy paid directly from the U.S. Treasury. The Recovery Act allowed States and local governments to issue BABs through December 2010.
Additional information on Federal debt financing tools is available at https://www.fhwa.dot.gov/ipd/finance/tools_programs/federal_debt_financing/.
|
Debt Financing Tool Project: Maine’s Veterans Memorial Bridge Maine’s third Grant Anticipation Revenue Vehicles (GARVEE) sale took place in November 2010 in the amount of $50 million in Taxable Build America Bonds issued by the Maine Municipal Bond Bank. A portion of the proceeds is being used to partially fund the construction of the replacement of the Veterans Memorial Bridge over the Fore River between the Cities of Portland and South Portland. The bridge is nearing 60 years of age and is designed to be a gateway to Maine's largest city. |
Transit Finance
Transit funding comes from two major sources: public funds allocated by Federal, State, and local governments, and system-generated revenues earned from the provision of transit services. As shown in Exhibit 6-19, the total amount available for transit financing in 2010 was $54.3 billion. Federal funding for transit includes fuel taxes dedicated to transit from the Mass Transit Account (MTA) of the Highway Trust Fund (HTF), as well as undedicated taxes allocated from Federal general fund appropriations. State and local governments also provide funding for transit from their General Fund appropriations, as well as from fuel, income, sales, property, and other unspecified taxes, specific percentages of which may be dedicated to transit. These percentages vary considerably among taxing jurisdictions and by type of tax. Other public funds from sources such as toll revenues and general transportation funds may also be used to fund transit. System-generated revenues are composed principally of passenger fares, although additional revenues are also earned by transit systems from advertising and concessions, park-and-ride lots, investment income, and rental of excess property and equipment.
| (Millions of Dollars) | Percent | ||||
|---|---|---|---|---|---|
| Federal | State | Local | Total | ||
| Public Funds | 10,364.1 | 11,788.4 | 18,021.1 | 40,173.6 | 73.9% |
| General Fund | 2,072.8 | 3,041.0 | 3,955.3 | 9,069.1 | 16.7% |
| Fuel Tax | 8,291.3 | 587.0 | 183.4 | 9,061.7 | 16.7% |
| Income Tax | 478.7 | 78.6 | 557.3 | 1.0% | |
| Sales Tax | 3,140.6 | 4,556.9 | 7,697.5 | 14.2% | |
| Property Tax | 27.4 | 418.1 | 445.4 | 0.8% | |
| Other Dedicated Taxes | 2,328.0 | 294.1 | 2,622.1 | 4.8% | |
| Other Public Funds | 2,185.7 | 8,534.8 | 10,720.5 | 19.7% | |
| System-Generated Revenue | 14,156.2 | 26.1% | |||
| Passenger Fares | 12,126.3 | 22.3% | |||
| Other Revenue | 2,029.9 | 3.7% | |||
| Total All Sources | 54,329.8 | 100.0% | |||
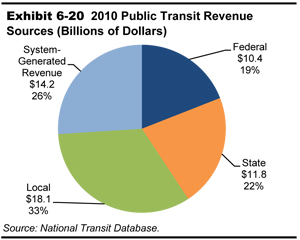
Level and Composition of Transit Funding
Exhibit 6-20 breaks down the sources of total transit funding. In 2010, public funds of $40.2 billion were available for transit and accounted for 73.9 percent of total transit funding. Of this amount, Federal funding was $10.4 billion, accounting for 25.8 percent of total public funding and for 19.1 percent of all funding from both public and nonpublic sources. State funding was $11.8 billion, accounting for 29.3 percent of total public funds and 21.7 percent of all funding. Local jurisdictions provided the bulk of transit funds, $18 billion in 2010, or 44.9 percent of total public funds and 33.2 percent of all funding. System-generated revenues were $14.2 billion, 26.1 percent of all funding. During the Recovery Act years of 2009, 2010, and 2011, transit agencies reported annual expenditures averaging $17.0 billion. The infusion of $5.3 billion in Recovery Act funds during that period allowed the industry to maintain investment levels near the record 2008 funding level of $17.1 billion.
| What type of dedicated funding does public transit receive from Federal highway-user fees? | |
|
In 1983, the MTA was established within the HTF. It is funded by 2.86 cents of Federal highway-user fees on gasohol, diesel and kerosene fuel, and other special fuels (benzol, benzene, and naphtha). Since 1997, the Federal fuel tax on a gallon of gasoline has been 18.4 cents and the tax on a gallon of diesel has been 24.4 cents.
The MTA also receives 2.13 cents of the user fee on liquefied petroleum gas (LPG) and 1.86 cents of the user fee on liquefied natural gas (LNG). The MTA does not receive any of the nonfuel revenues (such as heavy vehicle use taxes) that accrue to the HTF. Since the passage of the Safe, Accountable, Flexible, Efficient Transportation Equity Act: A Legacy for Users (SAFETEA-LU), only the Formula and Bus Grants Program is funded from the MTA. Prior to SAFETEA-LU, MTA funded other FTA programs. |
|
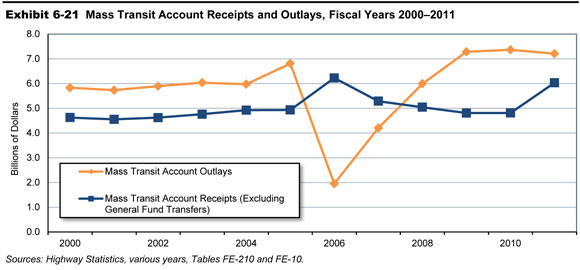
| How long has it been since excise tax revenue deposited into the MTA exceeded expenditures? | |
|
The last time that annual net receipts credited to the MTA of the HTF exceeded annual expenditures from the Highway Account was in 2007. As shown in Exhibit 6-21, for 10 of the 12 years since 2000, total annual receipts to the MTA from excise taxes and other income (including amounts transferred from the Highway Account) have been lower than the annual expenditures from the MTA.
|
|
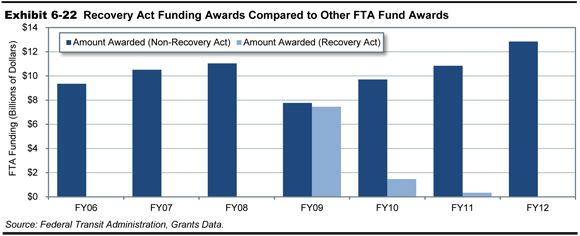
Federal Funding
Federal funding for transit comes from two sources: the general revenues of the U.S. government and revenues generated from fuel taxes credited to the HTF’s MTA. General revenue sources include income taxes, corporate taxes, tariffs, fees, and other government income not required by statute to be accounted for in a separate fund. The MTA, a trust fund for capital projects in transit, is generally the largest source of Federal funding for transit, though it was overtaken by American Recovery and Reinvestment Act (Recovery Act) funds from the general account in 2009. Exhibit 6-22 shows how Recovery Act funds were awarded in 2009, 2010, and 2011 in comparison to other Federal funding that comes from both the MTA and the General Fund. Of the funds authorized for transit grants in FTA’s 2010 budget, 79.0 percent were derived from the MTA. Funding from the MTA in nominal dollars increased from $0.5 billion in 1983 to $8.3 billion in 2010.
The Department of Homeland Security (DHS) provides funding for projects aimed at improving transit security. In 2010, DHS provided a total of $253 million to transit service providers.
Since 1973, Federal surface transportation authorization statutes have contained flexible funding provisions that enable transfers from certain highway funds to transit programs and vice versa. Transfers are subject to State and regional/local discretion, and priorities are established through statewide transportation planning processes. All States within the United States participate in the flexible funding program except Arkansas, Delaware, Hawaii, Nebraska, North Dakota, South Dakota, and Wyoming. U.S. territories, including American Samoa, Guam, North Mariana Islands, Puerto Rico, and the Virgin Islands do not participate. Flexible funding transferred from highways to transit fluctuates from year to year and is drawn from several different sources.
The Surface Transportation Program is also the source of Federal Highway Administration (FHWA) funds that are “flexed” to FTA to pay for transit projects. Funding is at 80 percent of Federal share and may be used for all capital and maintenance projects eligible for funds under current Federal Transit Administration (FTA) programs, and may not be used for operating assistance. FHWA has requested that they be administered by FTA.
| What are Flex Funds? | |
|
In FY 2008, $1.4 billion in flexible funds/transfers from Federal highway programs were available to FTA for obligation. Of that total, $957.3 million (67.0 percent) was transferred in FY 2008; the remaining available $472.5 million (33.0 percent) was the un-obligated carryover or recovery of prior year transfers. Thirty-nine states transferred flexible funds during FY 2008 and obligations totaled $1.1 billion. Once transferred, these funds take on the characteristics of the program in which they are received and are included in the figures reported across various programs. Obligations in FY 2008 were:
Since the program’s initiation in FY 1992, a total of $15.0 billion has been transferred from FHWA for transit projects. FHWA funds can be used for transit projects without being “flexed” to FTA, so this number may understate the total use of highway funds for transit projects. |
|
FHWA’s Congestion Mitigation and Air Quality (CMAQ) Improvement Program funds are another source of flexed funds used to support transit projects in air quality nonattainment areas. A CMAQ project must contribute to the attainment of the national ambient air quality standards by reducing air pollutant emissions from transportation sources. Public transportation projects can be funded through CMAQ, including some provisions for transit operating assistance.
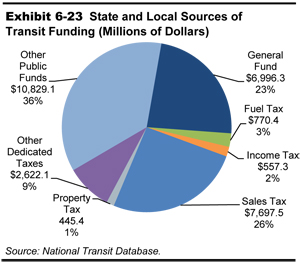
State and Local Funding
General funds and other dedicated public funds (vehicle licensing and registration fees, communications access fees, surcharges and taxes, lottery and casino receipts, and the proceeds from property and asset sales) are important sources of funding for transit at both the State and local levels. State and local funding sources for transit are shown in Exhibit 6-23. Taxes, including fuel, sales, income, property and other dedicated taxes, provide 41 percent of total public funds for State and local sources. General Funds provide 23 percent of transit funding with Other Public Funds providing the remaining 36 percent.
System-Generated Funds
In 2010, system-generated funds were $14.2 billion and provided 26 percent of total transit funding. Passenger fares contributed $12.1 billion, accounting for 22.3 percent of total transit funds. These passenger fare figures do not include payments by State entities to transit systems that offset reduced transit fares for certain segments of the population, such as students and the elderly. These payments are included in the “other revenue” category.
Exhibit 6-24 shows average fares and costs, on a per-mile basis, for the Nation’s 10 largest transit agencies since 2000. After adjusting for inflation (constant dollars) there has been a 10 percent increase in fares per mile over this period while the average cost per mile has increased by 19 percent. This has resulted in an 8.0 percent decrease in the “fare recovery ratio,” which is the percentage of operating costs covered by passenger fares. The 2010 fare recovery ratio for these ten agencies was 36.9 percent. Because these are all rail agencies, and rail systems tend to have lower operating costs per passenger mile, this is a higher fare recovery ratio than would be found for most bus or demand response operations. In many cases, municipalities operating these systems have determined that it is more cost effective for them to provide free service as fare collection is expensive and fares for these operations are generally kept low.
| Top 10 Systems* | 2000 | 2001 | 2002 | 2003 | 2004 | 2005 | 2006 | 2007 | 2008 | 2009 | 2010 | % Increase 2000– 2010 | % Increase Average Annual |
|---|---|---|---|---|---|---|---|---|---|---|---|---|---|
| Average Fare per Mile | $3.61 | $3.61 | $3.44 | $3.37 | $3.50 | $3.53 | $3.64 | $3.69 | $3.82 | $3.82 | $3.99 | 10% | 1.0% |
| Average Cost per Mile | $9.05 | $9.21 | $9.13 | $9.21 | $9.34 | $9.53 | $9.70 | $10.10 | $10.28 | $10.50 | $10.82 | 19% | 1.8% |
| Average Recovery Ratio | 39.9% | 39.2% | 37.7% | 36.6% | 37.5% | 37.0% | 37.5% | 36.5% | 37.2% | 36.4% | 36.9% | -8% | -0.8% |
Trends in Funding
Between 2000 and 2010, public funding for transit increased at an average annual rate of 4.3 percent, Federal funding increased at an average annual rate of 4.4 percent, and State and local funding grew at an average annual rate of 4.3 percent after adjusting for inflation (constant dollars). These data are presented in Exhibit 6-25.
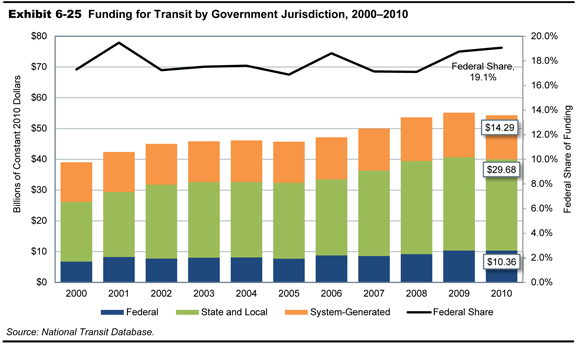
Federal funding for transit, as a percentage of total funding for transit from Federal, State, and local sources combined, reached a peak of 42.9 percent in the late 1970s, and declined to near its present value by the early 1990s as State and local funding increased. Exhibit 6-25 shows that, since 2000, the Federal government has provided between 16.9 and 19.5 percent of total funding for transit (including system-generated funds); in 2010, it provided 19.1 percent of these funds.
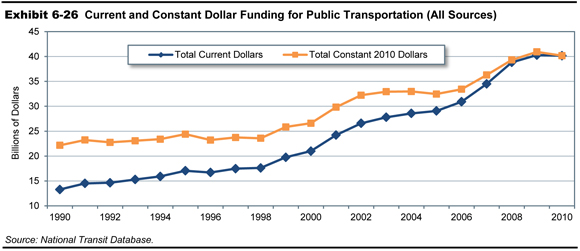
Funding in Current and Constant Dollars
Public funding for transit in current and constant dollar terms since 1990 is presented in Exhibit 6-26. Total public funding for transit was $40.2 billion in 2010. After adjusting for inflation (constant dollars), this was 2.2 percent higher than in 2008. Between 2008 and 2010 Federal funding increased from nearly $9.0 billion to $10.4 billion (15.3 percent) in current dollars. In constant dollars this represents a 13.9 percent increase. From 2008 to 2010, in current dollars, State and local funding stayed the same at $29.8 billion. In constant dollars this represents a 1.4 percent decrease in funding.
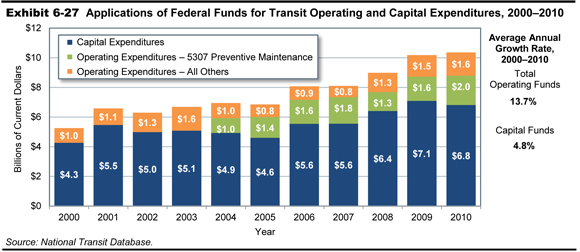
While Federal funds directed to capital expenditures have increased 4.8 percent from 2000 to 2010, funds applied to operating expenditures have increased 13.7 percent during the same period (current dollars). As indicated in Exhibit 6-27, $3.6 billion was applied to operating expenditures and $6.8 billion was applied to capital expenditures in 2010. More than half of the operating expenditures were for preventive maintenance, which is reimbursed as a capital expense under FTA’s 5307 grant program.
Capital Funding and Expenditures
Funding for capital investments by transit operators in the United States comes primarily from public sources. A relatively small amount of private sector funds for capital investment in transit projects are generated through innovative finance programs.
Capital investments include the design and construction of new transit systems, extensions of existing systems (“New Starts”), and the modernization or replacement of existing assets. Capital investment expenditures can be for the acquisition, renovation, and repair of rolling stock (i.e., buses, railcars, locomotives, and service vehicles) or fixed assets (which include fixed guideway systems, terminals, and stations, as well as maintenance and administrative facilities).
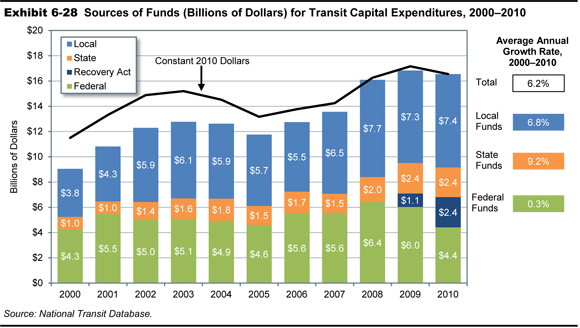
As shown in Exhibit 6-28, in 2010, total public transit agency expenditures for capital investment were $16.6 billion. This accounted for 41.3 percent of total available funds. Federal funds were $4.4 billion in 2010, 26.6 percent of total transit agency capital expenditures. State funds provided 14.2 percent and local funds provided 44.6 percent of total transit funding. Recovery Act funds provided the remaining 14.5 percent of revenues for agency capital expenditures.
Substantial amounts of Recovery Act funding were made available in 2009 and 2010, years in which use of non-Recovery Act Federal funds for capital investment went down. Total Federal expenditures were only slightly higher than in previous years, so it appears that Recovery Act funds displaced regular FTA grant funds in 2009 and 2010. This is not surprising given the strict 2-year obligation limit specified for Recovery Act funds. They would have to be used first due to their shorter availability period. As transit agencies have limited staff to process grants, and limited “shovel-ready” projects available for funding, expenditure of non-Recovery Act FTA grant funds was delayed so Recovery Act funds could be processed quickly.
As shown in Exhibit 6-29, rail modes require a higher percentage of total transit capital investment than bus modes because of the higher cost of building fixed guideways and rail stations, and because bus systems typically do not pay to build or maintain the roads on which they run. In 2010, $11.9 billion, or 72 percent of total transit capital expenditures, were invested in rail modes of transportation, compared with $4.6 billion, or 28 percent of the total, which was invested in nonrail modes. This investment distribution has been consistent over the last decade.
Fluctuations in the levels of capital investment in different types of transit assets reflect normal rehabilitation and replacement cycles, as well as new investment. Capital investment expenditures have only been reported to the National Transit Database (NTD) at the level of detail in Exhibit 6-29 since 2002.
Total guideway investment was $6.2 billion in 2010, and total investment in systems was $1.1 billion. Guideway includes at-grade rail, elevated and subway structures, tunnels, bridges, track and power systems for all rail modes, and paved highway lanes dedicated to buses. Investment in systems by transit operators includes groups of devices or objects forming a network, most notably for train control, signaling, and communications.
| Type | Rail Capital Expenditures, Millions of Dollars | Total Rail | |||
|---|---|---|---|---|---|
| Commuter Rail | Heavy Rail | Light Rail | Other Rail1 | ||
| Guideway | $1,812 | $2,005 | $2,273 | $5.5 | $6,096 |
| Rolling Stock | $403 | $877 | $327 | $3.4 | $1,611 |
| Systems | $118 | $591 | $139 | $7.7 | $855 |
| Maintenance Facilities | $159 | $84 | $92 | $1.2 | $337 |
| Stations | $427 | $1,572 | $341 | $1.7 | $2,342 |
| Fare Revenue Collection Equipment | $14 | $41 | $27 | $0 | $82 |
| Administrative Buildings | $5 | $30 | $7.9 | $0.3 | $43 |
| Other Vehicles | $14 | $28 | $6.1 | $0.1 | $49 |
| Other Capital Expenditures2 | $74 | $419 | $21 | $0.6 | $514 |
| Total | $3,026 | $5,646 | $3,234 | $20 | $11,927 |
| Percent of Total | 18.3% | 34.1% | 19.5% | 0.1% | 72.0% |
| Type | Nonrail Capital Expenditures, Millions of Dollars | Total Nonrail | |||
|---|---|---|---|---|---|
| Fixed Route Bus | Demand Response | Ferryboat | Vanpool | ||
| Guideway | $136 | $0 | $0 | $0 | $136 |
| Rolling Stock | $2,374 | $222 | $128 | $12 | $2,736 |
| Systems | $239 | $22 | $0.20 | $0.07 | $261 |
| Maintenance Facilities | $534 | $26 | $9.8 | $0.01 | $569 |
| Stations | $379 | $0.9 | $45.2 | $0.01 | $425 |
| Fare Revenue Collection Equipment | $88 | $3.9 | $0.24 | $0 | $92 |
| Administrative Buildings | $184 | $14 | $7.2 | $0.16 | $206 |
| Other Vehicles | $35 | $1.2 | $0 | $0.02 | $36 |
| Other Capital Expenditures2 | $156 | $7.0 | $11.9 | $0.32 | $176 |
| Total | $4,125 | $297 | $203 | $12 | $4,637 |
| Percent of Total | 24.9% | 1.8% | 1.2% | 0.1% | 28.0% |
| Type | Total Expenditures, Millions of Dollars for Rail and Nonrail Modes |
Percent of Total | ||
|---|---|---|---|---|
| Guideway | $6,232 | 37.6% | ||
| Rolling Stock | $4,347 | 26.2% | ||
| Systems | $1,117 | 6.7% | ||
| Maintenance Facilities | $906 | 5.5% | ||
| Stations | $2,766 | 16.7% | ||
| Fare Revenue Collection Equipment | $174 | 1.1% | ||
| Administrative Buildings | $249 | 1.5% | ||
| Other Vehicles | $85 | 0.5% | ||
| Other Capital Expenditures2 | $689 | 4.2% | ||
| Total | $16,564 | 100.0% | ||
2 Capital expenditures not elsewhere included. These expenditures include furniture and equipment that are not an integral part of buildings and structures; they also include shelters, signs, and passenger amenities (e.g., benches) not in passenger stations.
Note: Fixed Route Bus includes Motor Bus and Trolleybus.
Total investment in rolling stock in 2010 was $4.3 billion, total investment in stations was $2.8 billion, and total investment in maintenance facilities was $0.9 billion. Rolling stock includes the bodies and chassis of transit vehicles and their attached fixtures and appliances, but does not include fare collection equipment and revenue vehicle movement control equipment such as radios. Stations include station buildings, platforms, shelters, parking and other forms of access, and crime prevention and security equipment at stations. Facilities include the purchase, construction, and rehabilitation of administrative and maintenance facilities. Facilities also include investment in building structures, climate control, parking, yard track, vehicle and facilities maintenance equipment, furniture, office equipment, and computer systems.
| What are “New Starts?” | |
|
FTA provides dedicated funding for the construction of new fixed guideway systems through a competitive program known as “New Starts”. Title 49 USC Section 5309 provides for the allocation of funds for the design and construction of new transit systems and extensions to current systems (“New Starts”), among other purposes. To receive FTA capital investment funds for a New Starts project, the proposed project must emerge from the metropolitan and/or statewide planning process. A rigorous series of planning and project development requirements must be completed in order for a project to qualify for this funding. FTA evaluates proposed projects on the basis of financial criteria and project justification criteria as prescribed by statute. Initial planning efforts are not funded through the Section 5309 program, but may be funded through Section 5303, Metropolitan Planning; Section 5339, Alternatives Analysis; or Section 5307, Urbanized Area Formula Grants programs.
Under current law, Federal funding may account for up to 80 percent of a New Starts funding requirement. Generally, the Federal share of such projects now averages about 50 percent of the total project cost. However, not all new fixed guideway projects are constructed through the New Starts Program. |
|
Other capital includes capital costs associated with general administration facilities, furniture, equipment that is not an integral part of buildings and structures, data processing equipment (including computers and peripheral devices whose sole use is in data processing operations), and shelters located at on-street bus stops.
Operating Expenditures
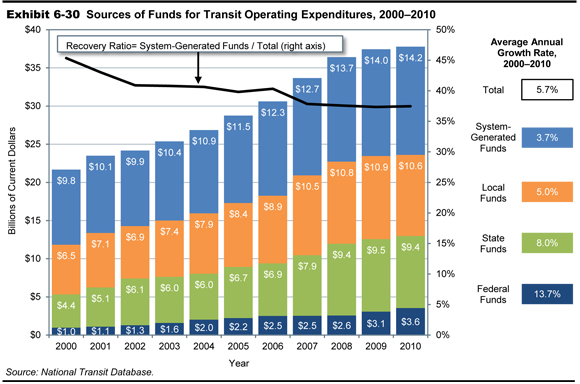
Transit operating expenditures include wages, salaries, fuel, spare parts, preventive maintenance, support services, and certain leases used in providing transit service. As indicated in Exhibit 6-30, $37.8 billion was available for operating expenses in 2010, the Federal share of which has increased from the 2008 level of 7.1 percent to 9.4 percent. The share generated from system revenues remained relatively stable from 37.6 percent in 2008 to 37.5 percent in 2010. The State share decreased slightly from 25.8 percent in 2008 to 24.9 percent in 2010. The local share of operating expenditures decreased slightly from 29.5 percent in 2008 to 28.2 percent in 2010.
| What happens after the census? | |
|
TEA-21 mandated that Federal funding to transit systems in urbanized areas with populations over 200,000 be used only for capital expenses and preventive maintenance, and not for operating expenses. Formula grant funds to urbanized areas with populations of less than 200,000 were still allowed to be used for operating expenses. As a result of the 2000 census, 56 areas were reclassified as urbanized areas with populations of more than 200,000. (These reclassifications were announced by the Census Department in May 2002.) Transit agencies operating in these areas were slated to lose their eligibility to use Federal formula funding to finance transit operations starting in FY 2003. The Transit Operating Flexibility Act of 2002 amended Section 5307 of 49 USC to allow transit systems that were in these areas to continue to use their formula funds for operating expenses as well as for capital expenses in FY 2003, despite their change in status. This change was extended by the Surface Transportation Extension Act of 2003. Under SAFETEA-LU these transit agencies may continue to use formula funds for operating expenses in FY 2005 at 100 percent of their FY 2002 apportionment, in FY 2006 at 50 percent of their FY 2002 apportionment, and in FY 2007 at 25 percent of their FY 2002 apportionment. The impact of the 2010 census did not take place until the 2013 apportionment. Legislative responses to these reclassifications have not yet been considered.
|
|
Operating Expenditures by Transit Mode
As shown in Exhibit 6-31, total transit operating expenditures were $35.1 billion in 2010. These expenditures increased at an average annual rate of 5.8 percent between 2000 and 2010 (in current-year dollars). Light rail and demand response modes have experienced the largest percentage increase in operating expenditures during this period. This is due to relatively greater investment in new light rail and demand response capacity over the past 10 years.
| Year | Expenditures, Millions of Current Dollars | ||||||
|---|---|---|---|---|---|---|---|
| Motor Bus | Heavy Rail | Commuter Rail | Light Rail | Demand Response | Other | Total | |
| 2000 | $11,026 | $3,931 | $2,679 | $592 | $1,225 | $549 | $20,003 |
| 2001 | $11,814 | $4,180 | $2,854 | $676 | $1,410 | $595 | $21,529 |
| 2002 | $12,586 | $4,267 | $2,995 | $778 | $1,636 | $643 | $22,905 |
| 2003 | $13,316 | $4,446 | $3,173 | $754 | $1,779 | $718 | $24,185 |
| 2004 | $13,790 | $4,734 | $3,436 | $826 | $1,902 | $739 | $25,427 |
| 2005 | $14,666 | $5,145 | $3,657 | $978 | $2,071 | $721 | $27,238 |
| 2006 | $15,796 | $5,287 | $3,765 | $1,070 | $2,286 | $820 | $29,025 |
| 2007 | $16,812 | $5,888 | $4,001 | $1,163 | $2,539 | $901 | $31,304 |
| 2008 | $17,963 | $6,129 | $4,294 | $1,259 | $2,861 | $975 | $33,479 |
| 2009 | $18,313 | $6,311 | $4,538 | $1,393 | $3,053 | $1,030 | $34,638 |
| 2010 | $18,399 | $6,370 | $4,595 | $1,499 | $3,171 | $1,037 | $35,071 |
| Percent of Total | |||||||
| 2000 | 55.1% | 19.7% | 13.4% | 3.0% | 6.1% | 2.7% | 100.0% |
| 2010 | 52.5% | 18.2% | 13.1% | 4.3% | 9.0% | 3.0% | 100.0% |
Operating Expenditures by Type of Cost
In 2010, $18.6 billion—or 53.1 percent of total transit operating expenditures—went toward vehicle operations. Smaller amounts were expended on maintenance and administration; these expenses, which have virtually been the same for the last several years, are broken down across cost categories in Exhibit 6-32.
| Mode | Distribution of Expenditures, Millions of Dollars | ||||
|---|---|---|---|---|---|
| Vehicle Operations | Vehicle Maintenance |
Nonvehicle Maintenance |
General Administration |
Total | |
| Motor Bus | $10,788 | $3,717 | $773 | $3,121 | $18,399 |
| Heavy Rail | $2,789 | $1,113 | $1,577 | $890 | $6,370 |
| Commuter Rail | $1,860 | $1,161 | $822 | $752 | $4,595 |
| Light Rail | $612 | $308 | $262 | $317 | $1,499 |
| Demand Response | $2,016 | $409 | $85 | $661 | $3,171 |
| Other | $561 | $170 | $80 | $226 | $1,037 |
| Total | $18,625 | $6,878 | $3,600 | $5,968 | $35,071 |
| Percent of All Modes | 53.1% | 19.6% | 10.3% | 17.0% | 100.0% |
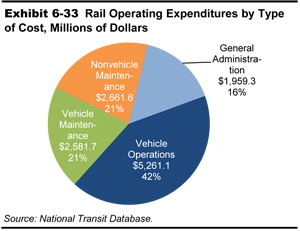
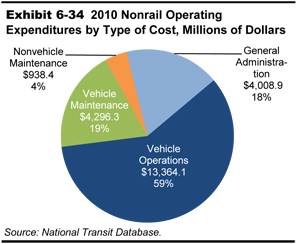
Exhibits 6-33 and 6-34 illustrate how road and rail operations have inherently different cost structures because, in most cases, roads are not paid for by the transit provider, but tracks are. A significantly higher percentage of expenditures for rail modes of transportation are classified as nonvehicle maintenance, corresponding to the repair and maintenance costs of fixed guideway systems.
Operating Expenditures per Vehicle Revenue Mile
Operating expenditures per vehicle revenue mile (VRM) is one measure of financial or cost efficiency. It shows the expense of operating a transit vehicle in revenue service. As shown in Exhibit 6-35, operating expenditures per VRM for all transit modes combined was $8.95 in 2010; the average annual increase in operating expenditures per VRM for all modes combined between 2000 and 2010 was 1.3 percent in constant dollars.
| Year | Motor Bus1 | Heavy Rail | Commuter Rail | Light Rail | Demand Response | Other2 | Total |
|---|---|---|---|---|---|---|---|
| 2000 | $7.84 | $8.52 | $13.55 | $14.43 | $3.40 | $6.33 | $7.83 |
| 2001 | $7.94 | $8.66 | $13.81 | $15.58 | $3.52 | $6.62 | $7.94 |
| 2002 | $8.13 | $8.52 | $13.92 | $15.64 | $3.75 | $6.73 | $8.05 |
| 2003 | $8.36 | $8.58 | $14.30 | $14.46 | $3.86 | $7.52 | $8.21 |
| 2004 | $8.43 | $8.73 | $14.72 | $14.27 | $3.90 | $5.99 | $8.25 |
| 2005 | $8.68 | $9.14 | $14.72 | $16.06 | $3.90 | $5.20 | $8.43 |
| 2006 | $8.92 | $8.99 | $14.15 | $15.81 | $4.07 | $5.53 | $7.88 |
| 2007 | $9.12 | $9.66 | $14.12 | $14.79 | $4.12 | $5.41 | $8.70 |
| 2008 | $9.40 | $9.57 | $14.22 | $14.92 | $4.26 | $5.01 | $8.80 |
| 2009 | $9.39 | $9.55 | $14.67 | $15.82 | $4.26 | $4.58 | $8.77 |
| 2010 | $9.60 | $9.84 | $14.60 | $16.36 | $4.42 | $4.49 | $8.95 |
| Average Annual Rate of Change | |||||||
| 2010/2000 | 2.0% | 1.4% | 0.8% | 1.3% | 2.7% | -3.4% | 1.3% |
2 Automated guideway, Alaska railroad, cable car, ferryboat, inclined plane, monorail, Público, trolleybus, and vanpool.
As shown in Exhibit 6-36, analysis of NTD reports for urbanized areas with greater than 1 million in population shows that the growth in operating expenses is led by the cost of fringe benefits, which have been going up at a rate of 3.8 percent per year above inflation (constant dollars) since 2000. By comparison, average salaries at these 10 agencies grew at an inflation-adjusted rate of only 0.4 percent per year in that period. FTA does not collect data on the different components of fringe benefits, but increases in the cost of medical insurance drive growth rates in fringe benefits across the economy and likely drive the growth in this category.
| Cost Component | Average Cost per Mile, Constant Dollars | % Increase 2000– 2010 | % Increase Average Annual | ||||||||||
|---|---|---|---|---|---|---|---|---|---|---|---|---|---|
| 2000 | 2001 | 2002 | 2003 | 2004 | 2005 | 2006 | 2007 | 2008 | 2009 | 2010 | |||
| Salaries | $3.49 | $3.48 | $3.58 | $3.62 | $3.56 | $3.51 | $3.56 | $3.58 | $3.61 | $3.62 | $3.63 | 4% | 0.4% |
| Fringe Benefits | $2.12 | $2.17 | $2.31 | $2.49 | $2.62 | $2.69 | $2.69 | $2.85 | $2.81 | $2.93 | $3.07 | 45% | 3.8% |
| Labor Cost | $5.61 | $5.65 | $5.89 | $6.11 | $6.18 | $6.20 | $6.25 | $6.44 | $6.42 | $6.55 | $6.69 | 19% | 1.8% |
| Total | $11.21 | $11.29 | $11.78 | $12.21 | $12.36 | $12.41 | $12.50 | $12.88 | $12.84 | $13.10 | $13.39 | 19% | 1.8% |
Operating expenditures per capacity-equivalent VRM is a better measure of comparing cost efficiency among modes than operating expenditures per VRM because it adjusts for passenger-carrying capacities. As demonstrated by the data in Exhibit 6-37, rail systems are more cost efficient in providing service than nonrail systems, once investment in rail infrastructure has been completed. Based on operating costs alone, heavy rail is the most efficient at providing transit service, and demand response systems are the least efficient. Annual changes in operating expense per capacity-equivalent VRM are not comparable across modes because average capacities for all vehicle types are adjusted separately each year based on reported fleet averages.
| Year | Motor Bus | Heavy Rail | Commuter Rail | Light Rail | Demand Response | Other | Total |
|---|---|---|---|---|---|---|---|
| 2000 | $7.84 | $3.61 | $5.81 | $5.73 | $18.86 | $9.66 | $6.46 |
| 2001 | $7.94 | $3.67 | $5.93 | $6.18 | $19.56 | $10.45 | $6.42 |
| 2002 | $8.13 | $3.61 | $5.98 | $6.21 | $20.85 | $10.16 | $6.40 |
| 2003 | $8.36 | $3.46 | $5.61 | $5.38 | $21.43 | $11.30 | $6.48 |
| 2004 | $8.43 | $3.52 | $5.78 | $5.31 | $22.95 | $10.48 | $6.54 |
| 2005 | $8.68 | $3.68 | $4.80 | $5.83 | $23.51 | $9.66 | $6.70 |
| 2006 | $8.92 | $3.62 | $4.62 | $5.74 | $24.49 | $10.69 | $6.79 |
| 2007 | $9.12 | $3.91 | $4.64 | $5.44 | $24.59 | $10.49 | $6.76 |
| 2008 | $9.40 | $3.87 | $4.67 | $5.49 | $25.39 | $13.22 | $6.93 |
| 2009 | $9.39 | $4.54 | $5.33 | $6.32 | $25.80 | $11.47 | $7.50 |
| 2010 | $9.60 | $3.98 | $5.34 | $5.95 | $25.48 | $11.16 | $7.24 |
| Compound Annual Growth Rate | |||||||
| 2010/2000 | 2.0% | 1.0% | -0.8% | 0.4% | 3.1% | 1.5% | 1.1% |
Operating Expenditures per Passenger Mile
Operating expense per passenger mile is an indicator of the cost effectiveness of providing a transit service. It shows the relationship between service inputs as expressed by operating expenses and service consumption as expressed by passenger miles traveled. Operating expenditures per passenger mile for all transit modes combined increased at an average annual rate of 1.8 percent between 2000 and 2010 (from $0.56 to $0.67). These data are shown in Exhibit 6-38.
| Year | Motor Bus | Heavy Rail | Commuter Rail | Light Rail | Demand Response | Other* | Total |
|---|---|---|---|---|---|---|---|
| 2000 | $0.73 | $0.36 | $0.36 | $0.55 | $2.61 | $0.61 | $0.56 |
| 2001 | $0.74 | $0.36 | $0.37 | $0.58 | $2.76 | $0.63 | $0.57 |
| 2002 | $0.78 | $0.38 | $0.38 | $0.65 | $3.03 | $0.66 | $0.60 |
| 2003 | $0.81 | $0.39 | $0.39 | $0.65 | $3.05 | $0.66 | $0.63 |
| 2004 | $0.84 | $0.38 | $0.40 | $0.64 | $3.11 | $0.61 | $0.63 |
| 2005 | $0.84 | $0.40 | $0.43 | $0.64 | $3.13 | $0.59 | $0.64 |
| 2006 | $0.84 | $0.39 | $0.39 | $0.62 | $3.27 | $0.62 | $0.63 |
| 2007 | $0.86 | $0.38 | $0.38 | $0.63 | $3.42 | $0.63 | $0.63 |
| 2008 | $0.87 | $0.37 | $0.40 | $0.62 | $3.47 | $0.58 | $0.64 |
| 2009 | $0.88 | $0.38 | $0.41 | $0.64 | $3.50 | $0.58 | $0.65 |
| 2010 | $0.89 | $0.39 | $0.43 | $0.69 | $3.63 | $0.57 | $0.67 |
| Compounded Annual Growth Rate | |||||||
| 2010/2000 | 2.0% | 0.9% | 1.8% | 2.2% | 3.3% | -0.8% | 1.8% |
Farebox Recovery Ratios
The farebox recovery ratio represents farebox revenues as a percentage of total transit operating costs. It measures users’ contributions to the variable cost of providing transit services and is influenced by the number of riders, fare structure, and rider profile. Low regular fares, the high availability and use of discounted fares, and high transfer rates tend to result in lower farebox recovery ratios. Farebox recovery ratios for 2004 to 2010 are provided in Exhibit 6-39. The average farebox recovery ratio over this period for all transit modes combined was 34.6 percent; heavy rail had the highest average farebox recovery ratio at 59.9 percent. Farebox recovery ratios for total costs are not provided because capital investment costs are not spread evenly across years. Rail modes have farebox recovery ratios for total costs that are significantly lower than for operating costs alone because of these modes’ high level of capital costs.
| Year | Motor Bus | Heavy Rail | Commuter Rail | Light Rail | Demand Response | Other2 | Total |
|---|---|---|---|---|---|---|---|
| 20041 | 27.9% | 61.3% | 47.0% | 26.2% | 9.6% | 36.2% | 35.5% |
| 20051 | 27.6% | 58.4% | 47.2% | 25.4% | 9.5% | 12.6% | 34.8% |
| 20061 | 26.6% | 60.9% | 49.4% | 27.4% | 9.3% | 34.3% | 34.8% |
| 2007 | 26.6% | 56.8% | 49.5% | 26.6% | 8.2% | 35.3% | 34.0% |
| 2008 | 26.3% | 59.4% | 50.3% | 29.3% | 7.5% | 32.7% | 34.1% |
| 2009 | 26.7% | 60.2% | 47.9% | 28.0% | 7.8% | 34.9% | 34.2% |
| 2010 | 26.7% | 62.3% | 48.5% | 27.5% | 7.9% | 37.0% | 34.7% |
| Average | 26.9% | 59.9% | 48.5% | 27.2% | 8.5% | 31.9% | 34.6% |
2 Automated guideway, Alaska railroad, cable car, ferryboat, inclined plane, jitney, monorail, Público, trolleybus, aerial tramway, and vanpool.
Rural Transit
Since 1978, the Federal government has contributed to the funding of transit in rural areas (i.e., areas with populations of less than 50,000). These rural areas are estimated to account for approximately 36 percent of the U.S. population and 38 percent of the transit-dependent population.
Funding for rural transit is currently provided through 49 U.S.C. Section 5311, the Rural Formula Grant Program. Rural transit funding was increased substantially with passage of TEA-21 and continued to increase under SAFETEA-LU. Federal funding for rural transit was $240 million in the last year of TEA-21, FY 2004, and reached $465 million in FY 2009 under SAFETEA-LU. States may transfer additional funds to rural transit from highway projects or formula transit funds for small urbanized areas.
As shown in Exhibit 6-40, 28 percent of rural transit authorities’ operating budgets come from Federal funds. State and local governments cover 45 percent of their rural transit operating budgets through a combination of dedicated State and local taxes, appropriations from State general revenues, and allocations from other city and county funds. Contract revenue, defined as reimbursement from a private entity (profit or nonprofit) for the provision of transit service, accounts for 19 percent of rural transit operating budgets. Fares accounted for only 8 percent, close to the average farebox recovery rate for demand response service (which constitutes most of rural transit). In 2010, the total value of rural transit operating budgets reported to the NTD was $1.25 billion.