U.S. Department of Transportation
Federal Highway Administration
1200 New Jersey Avenue, SE
Washington, DC 20590
202-366-4000
| DATA POINTS FOR COMPARISON OF RURAL VOLUME AND LOADINGS ON INTERSTATE | ||
|---|---|---|
| 1970 | 0 | 0 |
| 12.4 | 10.6 | |
| 24.5 | 25.1 | |
| 35 | 45.4 | |
| 33.2 | 67.6 | |
| 1975 | 41.3 | 81 |
| 49 | 98.1 | |
| 59.1 | 121.5 | |
| 71.6 | 163.5 | |
| 70 | 185.1 | |
| 1980 | 71.4 | 213.1 |
| 76.4 | 216.9 | |
| 80.6 | 226.6 | |
| 84.1 | 223.3 | |
| 88.9 | 241.7 | |
| 1985 | 95.3 | 273.6 |
| 101.9 | 301.2 | |
| 115.1 | 321.6 | |
| 128.9 | 334.1 | |
| 141.4 | 355.7 | |
| 1990 | 153 | 362.9 |
| 159.7 | 370.9 | |
| 161 | 393.4 | |
| 164.2 | 422.7 | |
| 172.8 | 438.1 | |
| 1995 | 182.7 | 490 |
| 193.4 | 518.1 | |
| 203.9 | 531.9 | |
| 217.4 | 550.5 | |
| 229.3 | 580.2 | |
| 240.4 | 603.2 | |
| 246.9 | 604.8 | |
| 2002 | 254.7 | 621 |
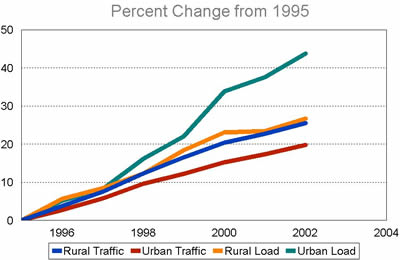
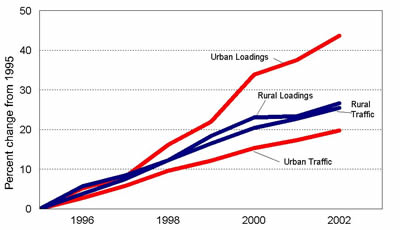
| DATA POINTS FOR RURAL / URBAN CHART | ||||
|---|---|---|---|---|
| 1995 | 0 | 0 | 0 | 0 |
| 1996 | 3.8 | 2.8 | 5.7 | 5.2 |
| 1997 | 7.5 | 5.8 | 8.5 | 8.2 |
| 1998 | 12.3 | 9.6 | 12.3 | 16.2 |
| 1999 | 16.5 | 12.2 | 18.4 | 22 |
| 2000 | 20.4 | 15.3 | 23.1 | 33.8 |
| 2001 | 22.7 | 17.3 | 23.4 | 37.5 |
| 2002 | 25.5 | 19.8 | 26.7 | 43.7 |
This table is also available for download in the following formats:
To view PDF files, you need the Acrobat® Reader®.

