U.S. Department of Transportation
Federal Highway Administration
1200 New Jersey Avenue, SE
Washington, DC 20590
202-366-4000


Skip to content
Facebook iconYouTube iconTwitter iconFlickr iconLinkedInInstagram

Policy and Governmental Affairs

FHWA Home / Policy & Governmental Affairs / Highway Statistics 2004 - FHWA

Highway Statistics 2004 - FHWA

Highway Statistics 2004 - SYSTEM TRAVEL DENSITY TRENDS - Chart
Highway Statistics 2004 OHPI > Highway Statistics > 2004 > Roadway Extent > Density Trends

SYSTEM TRAVEL DENSITY TRENDS 1/

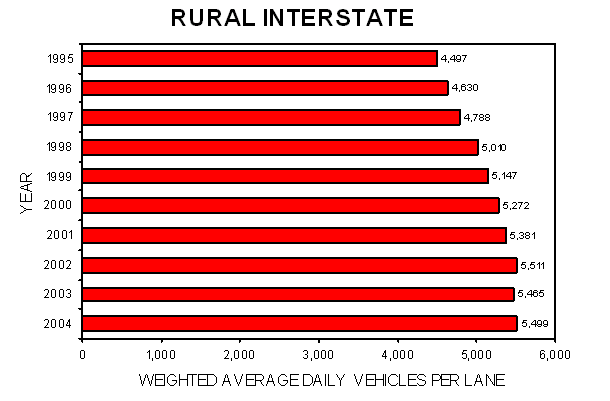
Year - Average Daily Vehicles Per Lane: 1995 - 4,497; 1996 - 4,630; 1997 - 4,788; 1998 - 5,010; 1999 - 5,147; 2000 - 5,272; 2001 - 5,381; 2002 - 5,511; 2003 - 5,465; 2004 - 5,499.

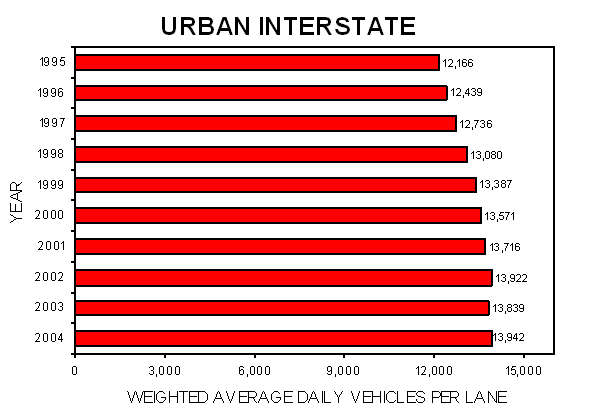
Year - Average Daily Vehicles Per Lane: 1995 - 12,166; 1996 - 12,439; 1997 - 12,736; 1998 - 13,080; 1999 - 13,387; 2000 - 13,571; 2001 - 13,716; 2002 - 13,922; 2003 - 13,839; 2004 - 13,942.

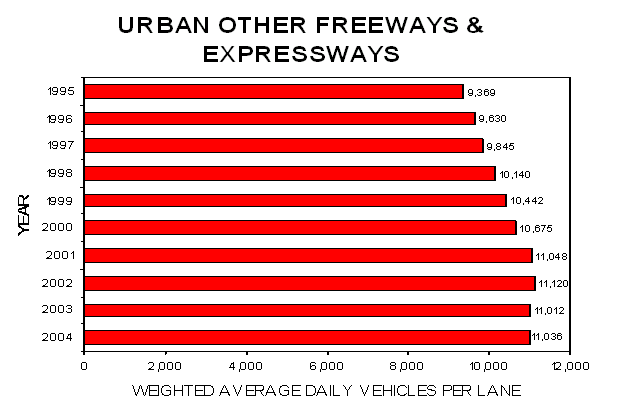
Year - Average Daily Vehicles Per Lane: 1995 - 9,369; 1996 - 9,630; 1997 - 9,845; 1998 - 10,140; 1999 - 10,442; 2000 - 10,675; 2001 - 11,048; 2002 - 11,120; 2003 - 11,012; 2004 - 11,036.

1/ Note that the method used to calculate these data has changed; a weighted average based on length is now used to calculate average daily vehicles per lane.


This table is also available for download in the following formats:

To view PDF files, you need the Acrobat® Reader®.

Page last modified on November 7, 2014
Federal Highway Administration | 1200 New Jersey Avenue, SE | Washington, DC 20590 | 202-366-4000