Policies to Reduce Greenhouse Gas Emissions Associated with Freight Movements
Cristiano Façanha, ICF International
Jeff Ang-Olson, ICF International
Introduction
This paper summarizes policies to support a reduction in greenhouse gas (GHG) emissions from freight movements. This paper starts with a brief description of the current freight activity in the United States and its associated effects on GHG emissions. The suggested policies to support a reduction in freight GHG emissions are divided into seven categories: (1) carbon taxes and other pricing mechanisms, (2) improvements in trucking fleet fuel efficiency, (3) improvements in railroad fuel efficiency, (4) improvements in fuel efficiency of other modes, (5) alternative fuels, (6) mode shift, and (7) congestion mitigation. This paper concludes with a brief analysis of the combined effects of these policies.
Freight Fuel Consumption and Greenhouse Gas Emissions – Current Activity
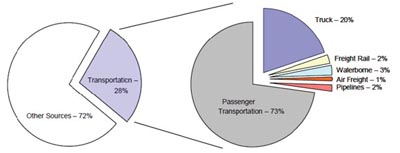
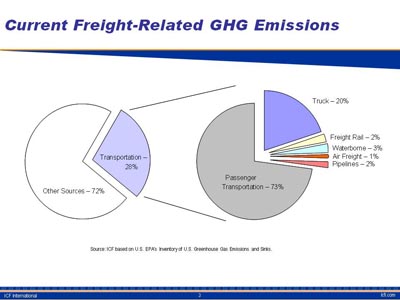
GHG emissions from freight transportation are tied closely to freight energy use. Both are growing because energy efficiency improvements in the freight sector have not kept pace with growth in demand. The transportation sector in total is responsible for 28% of all U.S. GHGs, as reported in the U.S. Environmental Protection Agency's (EPA) Inventory of U.S. Greenhouse Gas Emissions and Sinks (Figure 1). Within the transportation sector, freight movement accounts for 27% of transportation GHG emissions, with the majority of emissions generated by trucking.
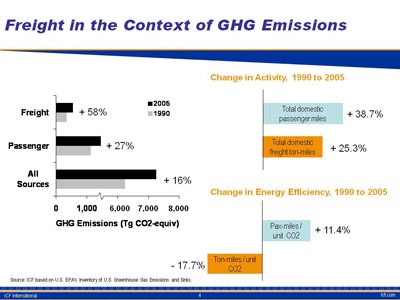
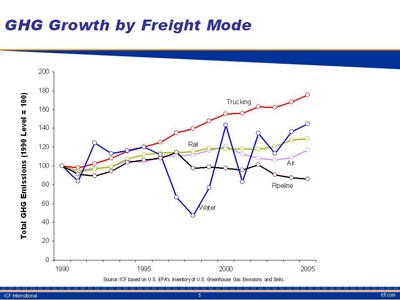
Energy use and GHG emissions from freight transportation have grown at roughly twice the rate of passenger transportation emissions over the last 15 years. The causes are robust growth in freight demand coupled with an overall decline in energy efficiency within the freight sector. With the exception of pipelines, GHG emissions from all freight modes have increased over the last 15 years (Figure 2). Freight-truck GHG emissions increased by 69% from 1990 to 2005 and accounted for almost 90% of the increase in freight GHGs. Freight-rail emissions increased by 29% during this period and air freight emissions increased by 15%.
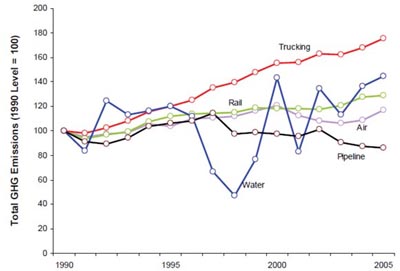
The rapid growth in freight GHGs and the overall decline in freight energy efficiency reflect a growing reliance on freight modes – particularly truck and air – that provide faster, more reliable service but have higher energy intensity. The notable exception to freight's growing energy intensity can be seen in rail shipments. Rail ton-miles grew by 62% between 1990 and 2005, exceeding the growth rate for truck and air cargo, but rail energy efficiency also has improved.
In contrast, freight-truck energy efficiency declined between 1990 and 2005. The reasons for this drop are not well understood, but are likely related to market demand for more powerful engines, requirements for advanced emission control devices that also may have compromised fuel efficiency, a decline in operational efficiency, and the elimination of mandatory highway speed limits. However, the recent spike in diesel prices has focused attention on truck fuel efficiency and is likely to slow or even reverse this trend. Between 2000 and 2005, freight-truck energy efficiency was essentially flat.
Looking ahead, freight-transportation energy use and GHG emissions are expected to grow modestly over the next three decades, led again by the trucking sector. Total domestic freight transportation GHG emissions are projected to increase 74% by 2035, an increase of about 1.8% annually. Trucking will still account for the vast majority of domestic freight GHG emissions.
Current environmental regulations will significantly reduce truck and locomotive particulate and NOx emissions, but do little to reduce GHG emissions. Curtailing GHG emissions will be a major challenge for the freight transportation industry. Improved engine efficiency and alternative fuels will be the most important contribution within the freight transportation sector to a more sustainable climate policy and energy security but addressing highway congestion and achieving modal shifts also will be important to reducing freight energy consumption and emissions.
Policies to Reduce GHG Emissions from Freight Movements
Government regulation and complementary support for research and development as well as deployment can help advance technologies and strategies that reduce freight transportation fuel use and emissions. Key elements would involve:
- Imposing carbon taxes or similar fuel pricing signals
- Improving trucking fleet fuel efficiency
- Improving rail fuel efficiency
- Improving fuel efficiency of other modes
- Expanding use of alternative fuels
- Encouraging mode shifts to more fuel-efficient modes
- Mitigating congestion.
1. Imposing carbon taxes or similar fuel pricing signals
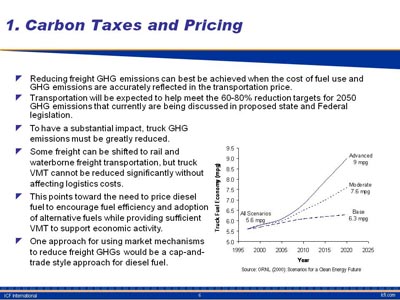
Reducing freight transportation fuel use and GHG emissions can best be achieved when the cost of fuel use and GHG emissions are accurately reflected in the price of freight transportation shipments and passed along to manufacturers, retailers, and final consumers who purchase freight transportation.
Transportation will be expected to help meet the 60% to 80% reduction targets for 2050 GHG emissions that currently are being discussed in proposed state and federal legislation. To have a substantial impact, truck GHG emissions must be greatly reduced. Some freight can be shifted to rail and waterborne freight transportation, but truck vehicle miles traveled (VMT) cannot be reduced significantly without affecting logistics costs for businesses and industries and driving up the cost of goods and services for consumers. This points toward the need to price diesel fuel – the primary fuel for truck and rail engines – to encourage fuel efficiency and adoption of alternative fuels while providing sufficient vehicle-miles of travel to support economic activity.
One approach for using market mechanisms to reduce freight GHGs would be a cap-and-trade-style approach for diesel fuel. Most of the GHG cap-and-trade bills introduced in the 2007-2008 Congress included transportation among the capped sectors through an upstream cap on the CO2 content of petroleum fuels, implemented at the refinery.
Oak Ridge National Laboratory has developed several scenario forecasts of truck fuel economy using the National Energy Modeling System (NEMS). The “advanced” scenario assumes that there is a national sense of urgency to improve efficiency and reduce carbon emissions, and that some increase in direct costs of fuel and carbon emissions (up to $50 per truck) could be passed to customers to meet energy and environmental goals. Under this scenario, long-haul combination truck fuel economy would rise from approximately 5.6 mpg today to 9 mpg by 2020.
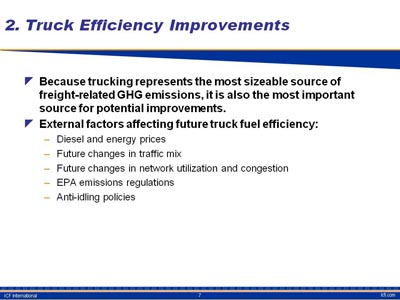
2. Improving trucking fleet fuel efficiency
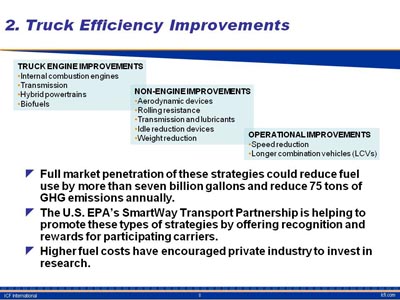
Currently, a variety of strategies are available to improve the fuel efficiency of trucking operations, including tractor and trailer aerodynamic improvements, use of single-wide tires, automatic tire inflation systems, options to reduce extended truck idling, and driver training programs. Full market penetration of these strategies could reduce fuel use by more than seven billion gallons and eliminate 75 tons of GHG emissions annually. The U.S. EPA's SmartWay Transport Partnership is helping to promote these types of strategies by offering recognition and rewards for participating carriers.
High fuel prices and consumer demand for “green” products already are encouraging companies to adopt fuel savings strategies on their own. Wal-Mart, for example, has set a goal of doubling the fuel economy of its truck fleet by 2015, and already has achieved a 25% fleet-wide improvement as of 2008.
New and emerging technologies can potentially lead to greater fuel efficiency gains. Hybrid-electric powertrains are one of the most promising technological developments for trucks. Current hybrid technology is most appealing for stop-and-go driving typical of parcel delivery operations; both FedEx and UPS are now using some hybrid trucks for city deliveries. According to a report prepared for the National Commission on Energy Policy, hybridization of trucks in truck-size classes 3 to 5 can increase fuel economy by 71% in city driving. Several reports suggest that hybrid engines will not be cost effective for typical intercity combination trucks; however, some truck operators and engine manufacturers are researching and testing hybrid powertrains in heavy-duty combination trucks. Wal-Mart and ArvinMeritor currently are developing a hybrid version of the International ProStar class-8 tractor, powered by a Cummins engine. Eaton and PACCAR, the maker of Kenworth and Peterbilt trucks, have announced plans to develop a hybrid heavy-duty truck and bring it to market by 2009. Volvo also has developed a hybrid with a reported 35% improvement in fuel economy.
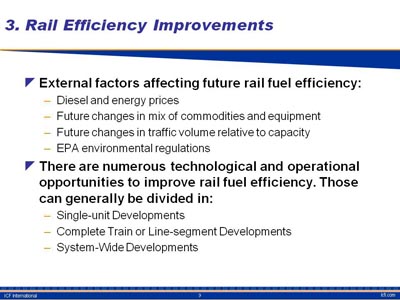
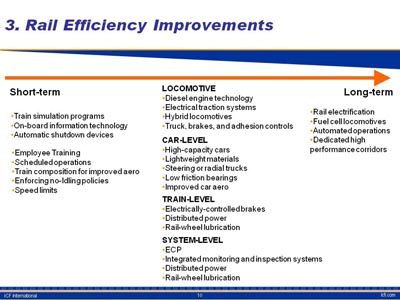
3. Improving rail fuel efficiency
There are a number of technology opportunities to improve rail efficiency. New locomotive designs are likely to reduce fuel use by capturing wasted energy and using more efficient fuel sources. Hybrid-electric and Generator-Set (“Genset”) switcher locomotives already are in use in many locations. Union Pacific, for example, has more than 150 Genset locomotives working in California and Texas. Advanced hybrid-electric and fuel-cell locomotives are in the research and development stage.
Locomotive information technology can reduce fuel use by optimizing train operation. Onboard computers can monitor engine performance and other characteristics (e.g., train tonnage, grade, speed) to optimize engine speeds, brake use, and fuel consumption. Electronically controlled pneumatic brakes save fuel by eliminating unnecessary braking and acceleration. When combined with satellite navigation, onboard computers can determine optimum speeds to ensure an on-time arrival, while maximizing fuel efficiency.
Another promising development is “positive train control,” which allows central dispatchers to control train operations in order to optimize network behavior. Current efforts to develop positive train control are focused on developing interoperable communication protocols, with limited systems currently in the research and development stage. The long-term fuel and emission reduction benefits of these technologies are uncertain. A goal is to match the fuel economy benefits of the last 30 years, which saw a doubling of U.S. railroad ton-miles per gallon. If this trajectory were to continue (equivalent to a 2.4% annual improvement in fuel efficiency), it would reduce diesel fuel consumption in 2035 by 3.6 billion gallons and eliminate 39 million metric tons of GHG emissions in that year.
4. Improving fuel efficiency of other modes
R&D efforts have explored the potential for improvements in ship fuel efficiency. Design improvements could be achieved through optimizing the hull shape, air lubrication, selection of appropriate propeller, diesel-electric propulsion (e.g., pop propulsion), and use of alternative fuels. Combined, these strategies could improve the fuel efficiency of new ships by up to 30%. Maintenance strategies or retrofit in existing ships also could improve fuel efficiency by about 20%. Other technological improvements include ship power improvements (through alternative types of energy), and alternative non-toxic coatings and active removal systems to remove marine organisms from the ships' hull (to smooth the hull's surface). Operational strategies also can improve fuel performance by adjusting ship routes to avoid poor weather conditions and improving port operations to reduce hotelling times.
Although aviation accounts for a small share of freight GHG emissions, energy efficiency gains can still be achieved through more fuel efficient engines, design innovations in the aircraft body, use of lighter materials, and improvements in airport operations. All of these strategies are being explored by the airlines and aircraft manufacturers in an effort to reduce aviation fuel costs. But, as with other modes, there may be opportunities for government to accelerate their development and deployment.
5. Expanding use of alternative fuels
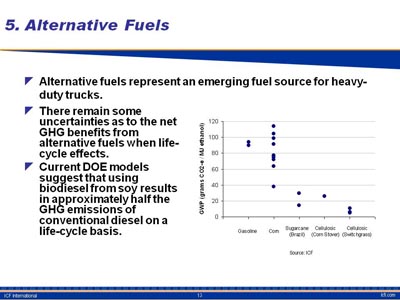
Alternative fuels such as biodiesel represent an emerging fuel source for heavy-duty trucks. Some states, especially in the Midwest, have mandated the blending of small fractions of biodiesel in all diesel sold. In other cases, individual truck operators are using B5 (5% biodiesel and 95% diesel) or B20 (20% biodiesel and 80% diesel). Some uncertainties remain as to the net GHG benefits from alternative fuels when life-cycle effects (land-use changes, production, distribution, and use) are taken into account. Current Department of Energy models suggest that using biodiesel from soy results in approximately half the GHG emissions of conventional diesel on a life-cycle basis.
6. Encouraging mode shifts to more fuel-efficient modes
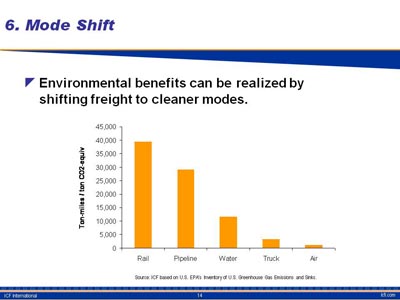
Environmental benefits can be realized by shifting freight to cleaner modes. In general, rail and water transportation are associated with lower emissions (on a ton-mile basis) than truck transportation, although these benefits depend on details such as the length of haul and the use of drayage trucks to access intermodal facilities. Emission rates for new trucks will drop significantly in the coming years, which may offset the environmental advantages of rail in some instances.
7. Mitigating congestion
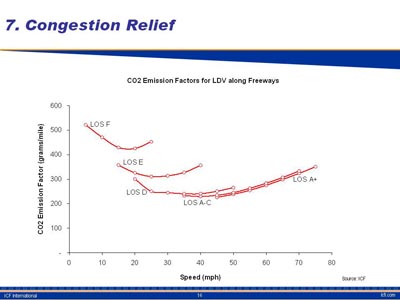
Congestion can affect freight fuel consumption to the extent that it requires vehicles to accelerate and decelerate more often to adapt to network traffic levels. Because fuel consumption is significantly higher in acceleration mode than while traveling at constant speed, fuel consumption typically is higher in congested scenarios.
There has not been much published research to date on the effects of congestion on fuel consumption nationwide. The 2007 Urban Mobility Study makes an attempt to do so, but it does not single out the effects of congestion on freight movements. An assessment of freight bottlenecks on highways has estimated delay incurred by heavy-duty trucks2. Internal ICF estimates indicate that about 135 million gallons of fuel are spent annually by heavy-duty trucks on congested roads, which translates into roughly 1.4 million metric tons of CO2. Because congestion degrades the fuel performance of heavy-duty trucks more heavily than light-duty vehicles, it is important to have a better understanding of congestion effects on freight movements.
Combined Effects of Policies
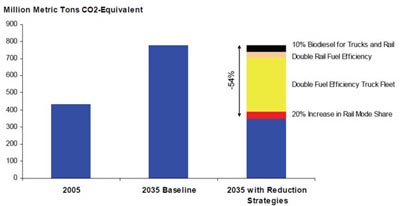
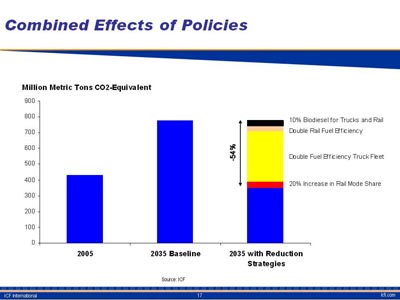
Figure 3 illustrates how a combination of these strategies might cut GHG emissions from truck and rail freight transport by more than half in 2035.
Workshop Presentation

1 ICF International Based on U.S. EPA's Inventory of U.S. Greenhouse Gas Emissions and Sinks.
2 Cambridge Systematics (2005): An Initial Assessment of Freight Bottlenecks on Highways, Prepared for FHWA.