
FHWA > Policy > Office of Transportation Policy Studies
November 2011
Prepared For:

FHWA Task Order RFP 31-10-10024
Submitted by:

Point of Contact:
Michael F. Lawrence, JFA President
4550 Montgomery Avenue
Suite 300N
Bethesda, Maryland 20814
Phone: (301) 961-8835
Fax: (301) 469-3001
lawrence@jfaucett.com
Technology and Transportation Behavior
1. Information and Communication Technologies
4. Transportation Fuel Efficiency
As economic, social and technological conditions change in the United States, individuals adapt their transportation habits. For example, when women began to join the labor force, the number of rush-hour drivers rose more quickly than did the population as a whole. This societal shift resulted in significant changes to the travel demand models used to forecast road usage demand. More recently, some reports have indicated that car ownership and road usage may have reached saturation point, and that use of public transportation may be on the rise. Over the past decade, fewer young people than observed in previous generations have signed up for drivers licenses. Many credit these trends to an increased environmentalism of today's youth, while others cite the effects of technology on young people's social behavior.
In order to trace the source of these recent trends, and make considered projections of how travel demand might evolve in the future, it is important to examine how changing economic and social conditions have affected past generations. In addition, emerging trends that may change transport demand in the future need to be identified. The Office of Transportation Policy Studies within the Federal Highway Administration (FHWA) is undertaking a study to look at these issues through a three stage process. The first step in this process is a literature scan to discuss recent trends in transportation behavior and to connect these trends to changes in the economic, social, technological and political landscapes. This literature scan is to be complemented by additional statistical analysis and focus groups. The initial part of the literature scan was undertaken by the FHWA Office of Transportation Policy Studies.
In order to more deeply assess the effects of a number of factors which are particularly pertinent to younger age cohorts, FHWA requested an additional literature scan to analyze recent trends in technology affecting travel behavior. The following sections address these issues in some detail, describing major trends, their potential effects on travel behavior and analyzing how younger generations may have a different response to these trends than did earlier generations.
Technology has always been an important engine of the U.S. economy, and innovation a part of the American culture. Recently, however, the importance of high tech devices in our daily life has increased, and the adoption of new technologies has changed the way we live, shop, communicate, and work, and as a result, has affected how we travel.
This culture of innovation and rapid technological adaptation is particularly strong among the younger generations, particularly among members of Generation Y. These so-called "internet natives" have grown up in the era of personal computing and the internet, and easily integrate technology into their daily lives. Generation Y readily recognize their dominance in technologies, with seventy-nine percent reporting that their millennial "gap" is large, and that they are more technology savvy than any other generation. This gap, however, appears to be closing over time; older generations are now increasingly comfortable with new technologies and are integrating these technologies into their daily lives. This finding may influence generational consideration and tolerance toward accommodating transportation for all generation varied age groups with transportation mobility.
This section of the report will describe the major technological innovations that are likely to affect travel behavior, including:
In the paragraphs that follow, we will describe recent innovations in each of these technologies, examine what the literature has demonstrated on the effects of these innovations on transportation behavior, and make some initial suggestions on whether the younger generations may have a different reaction to these technologies than older generations.
Since its birth in the 1990s, Information and Communication Technology (ICT) has become an important part of Americans' lives. These technologies have changed the way we work, shop, and socialize, making it easier to conduct these activities from the comfort of our own homes, or on-the-go using the mobile internet. The mainstreaming of these technologies has already begun to change the way we travel.
The exact nature of their effects, however, are not yet well understood, as this is a relatively new field of research for transportation planning. Further, the effects are complex and multi-faceted. There are many variables of analysis, including the context of the usage (for work, shopping or socializing), the demographics of the user, and the nature of the technology being used (i.e. broadband vs. mobile internet technologies). The following sections will provide a review of the existing literature on the potential effects of ICT technologies on travel behavior. It will begin with established technologies for a number of categories of ICTs, including:
These same three categories will then be examined for new and emerging technologies. Each sub-section will begin with a description of the technologies followed by a summary of recent trends in usage and the demographics of the average user. Finally, when available, the observed effects of these technologies on transportation usage will be described.
While the technology underlying many of today's popular ICT services has been available since the 1980s and 1990s, they have only started to become mainstream over the past decade, as the costs of computing and internet usage have fallen. High-speed internet access, especially broadband internet access, has become much more prevalent, going from covering only 3 percent of the adult population in 2000 to 66 percent of the adult population in 2010. The availability of faster internet connections in American households brings these technologies to a much wider population, and helps the companies in this growing sector to reach scale and to continue to innovate.
Figure 1 Home Access of Broadband Internet, 2000-10
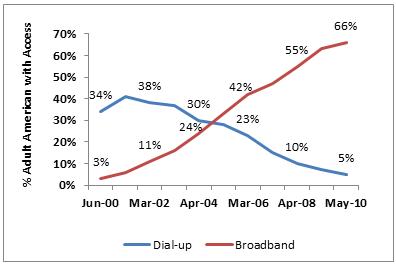
Source: Pew Internet and American Life Project Surveys, 2000-20101
While telecommuting had its roots in the 1970s, it has only become mainstream over the course the late 1990s and 2000s.2 A 2009 study by the Dieringer Research Group found that the number of Americans working at least one day a month from home or another remote location increased about 74 percent from 2005 to 2008, from about 9.9 million in 2005 to 17.2 million in 2008.3 Figure 2 demonstrates this recent upswing in telecommuting activities.
Figure 2: Trends in telecommuting4
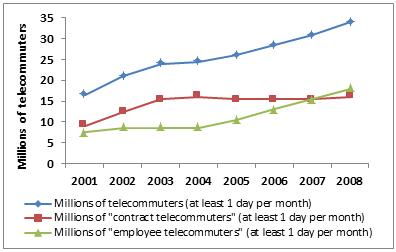
Source: WorldatWork Telework Trendlines 2009, data from The Dieringer Research Group Inc5
Younger generations, such as Generation X and Generation Y, appear to be increasingly interested in telecommuting. As the workplace adapts to the younger generations, employers may implement more strategies to attract and retain skilled Gen Xers and Millennials including: flexible hours, telecommuting, and use of the latest technology.6 This will become an increasing concern as about 80 percent of the roughly 80 million baby boomers will retire over the next decade. In a recent poll of Generation Y workers, Deloitte found that 14.3 percent of Generation Y workers listed the ability to work from home as one of the top three actions an employer could take to retain them in the company, above job security.7 Table 1 provides a description of the typical telecommuter in 2006 and 2008. The growth in telecommuting from 2006 to 2008 appears to be driven by the younger population, as the median age dropped from 40 to 38. This trend does not seem to be driven by women opting to stay at home to stay with children, as 61 percent of telecommuters in 2008 were men. This may indicate a shift in the perception of telecommuting among men.
| 2006 (n=140) |
2008 (n=130) |
|
|---|---|---|
| Number of "employed telecommuters," U.S. | 28.7 million | 33.7 million |
| Men | 53% | 61% |
| Women | 47% | 39% |
| Age | ||
| 18-34 | 38% | 42% |
| 35-54 | 52% | 48% |
| 55+ | 11% | 8% |
| Mean age | 41 | 40.3 |
| Median age | 40 | 38 |
| Educational Attainment | ||
| High School or Less | 18% | 23% |
| Some College/Vocational | 25% | 28% |
| College Graduate | 57% | 50% |
| Post Graduate Degree | 22% | 15% |
| Household Income | ||
| Under $40,000 | 20% | 10% |
| $40,000 - <$75,000 | 26% | 32% |
| $75,000 or more | 37% | 52% |
| Refused | 17% | 5% |
Source: WorldatWork Telework Trendlines 2009, data from The Dieringer Research Group Inc
Note: Because this data is for those who self-reported as telecommuters only, and not all U.S. adults, the margin of error for this question is +/- 8.6%.)
A number of innovations in collaborative technology have made telecommuting and web-conferencing increasingly possible. As mentioned above, over the past decade, the costs of computing and internet use have fallen, and high-speed internet access has become more prevalent. Broadband internet use has gone from covering only 3 percent of the adult population in 2000 to 66 percent of the adult population in 2010. The availability of faster internet connections in American workers' homes makes telecommuting more feasible for a large proportion of the population.
In addition, companies have developed specialized technologies to allow workers to use work email, shared drives, telephone and, in some cases, even the desktops of their work computers remotely. Major categories of technologies that have made telecommuting increasingly feasible include:
Table 2 below describes a number of products currently in common use on the market. This list is merely descriptive of the full set of products and services available and should not be construed as an endorsement of any of the products listed.
| Name | Brief Description | Cost | Link | |
| Collaboration software | ||||
| AdobeConnect | Enables individuals and small businesses to communicate and collaborate through easy-to-use, easy-to-access online personal meeting rooms. | $40/month or $395/year | http://www.adobe.com/products/acrobatconnect/ | |
| GoToMeeting | Online meetings, webinars, and online training for up to 1,000 attendees. Desktop sharing, presentation tools, automated Q&As, and recording of events. | $49-$149/month, or $468-$1,468/year, depending on size of meetings | www.gotomeetings.com | |
| Remote Access | ||||
| Symantec pcAnywhere | Efficient and secure remote connection to work stations. Allows for smart card authentication. | A standalone user costs $199.99/year, with no support. A 25 license pack with support costs $5,316.75. | http://www.symantec.com/business/pcanywhere | |
| GoToMyPC | Access to a work computer from any computer via the internet. Allows for synchronization of files, and remote printing. | $9.95/month for one user, and $19.90/month for up to 50 users. Larger organizations require individual pricing. | www.gotomypc.com | |
| Virtual Office | ||||
| Microsoft SharePoint Workplace (Office) | Collaboration software program that helps teams work together dynamically and effectively. User can access SharePoint site content on their local computer. Has mobile phone aps. | Licensing fee arrangement depends on size of contract. | http://office.microsoft.com/ en-us/groove/ | |
| OfficeScape | Provides advanced web and communication technologies, including phone, data management, and videoconferencing services, and on-demand physical offices and conference facilities. | Price varies based on product. A unified communication system which routes phone, fax and email messages costs between $19,000 and $40,0000. | www.officescape.com | |
| Project Management | ||||
| @task | On-demand project and portfolio management software to help teams' access business intelligence and work together. | Costing not available. | www.attask.com | |
| Ace Project | Project Management Software, Time Tracking, Project Tracking and Timesheet Software for Project Manager | $0-$99/month depending on the number of users and size of storage space of project documents. | www.aceproject.com | |
Source: Adapted from NY Metropolitan Transportation Council "A Comprehensive Survey of Emerging Technologies for New York Metropolitan Area, November 2007.
The effects of telecommuting on travel behavior have been widely studied by the transportation research community since its beginnings in the 1970s. Early studies found negligible, contradictory or positive effects of telecommuting on VMT.9 However, technological innovation and changes in the HR and management practices have changed the nature of telecommuting, and recent studies have generally noted several similar conclusions, including:
It is not yet clear if younger generation would have a different travel behavior response to telecommuting than do older generations. This may be an important field for further research.
Over the course of a decade, e-commerce has risen from a niche market serving only a small set of tech-savvy consumers to a major marketplace selling to a wide range of American consumers. According to a Nielson Survey, as of June 2010, only 15 percent of online American consumers had never made an online purchase, and about 80 percent indicated that they intended to make at least one online purchase in the next 6 months. The list of products and services most frequently purchased online include: books, clothing and airline tickets.14 Figure 3 demonstrates recent trends in E-Commerce. In terms of total spending, e-commerce almost tripled between 2002 and 2008, going from $72 billion to $214 billion. E-commerce fell somewhat in 2009 with the effects of the recession, but appears to have rebounded in 2010.
Figure 3: Trends in E-Commerce
*Through Q3 2010
Source: conScore e-Commerce Measurements, 2010
The impact of increased online shopping on travel behavior and road congestion remains a lively topic of debate, and researchers have identified a number of potential effects of this new surge in online shopping on travel. Traditionally, studies suggest that e-commerce may interact with travel behavior in at least four ways:
As of yet, the overall effect of online shopping on travel behavior remains unclear, with different studies reporting contradictory and ambiguous findings.
It is also likely that the purchase of different types of goods may result in different effects. If the purchase of digital merchandise such as e-books or MP3s replaces the purchase of their physical equivalent, the reduction of traffic on the roads may be most pronounced, as there is no delivery of a physical object. If a physical book or CD is ordered, however, the trip to purchase this item may be replaced by the delivery of the item. Thus, the final effects of this upward trend in online buying on travel may depend on what is being purchased, who is driving this trend, and how likely they are to use online shopping as a substitute for shopping in a brick and mortar store.
Looking forward to the effects of e-commerce on future transportation demand, it is important to consider the specific online shopping behaviors of the younger generations. Several studies have indicated that found that younger generations tend to be more likely to shop online, in part due to their comfort with computer technology.16 However, a recent Pew Study found that Generation X continues to dominate online shopping, with 80 percent of Generation X internet users engaging in e-commerce, in comparison with 71 percent of internet users ages 18-32, and 38 percent of online teens.1718
Figure 4: Difference in Minutes Traveling for Shopping Trips, Internet Users vs. Average
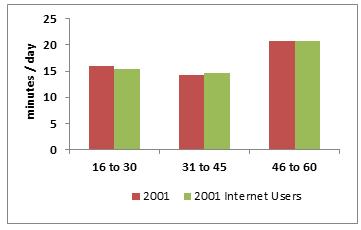
Source: NHTS as shown in Contrino and McGuckin (2006)
There is also the question of whether different age groups behave differently regarding travel habits and online shopping. There is some indication that internet access may have a slightly different effect on shopping trips for different age groups. Using National Household Travel Survey (NHTS) data, Contrino and McGuckin (2006) show that while 31 to 45 years old internet users traveled slightly more minutes on shopping related trips than the average 31 to 45 year old, 16 to 30 year old internet users traveled slightly less on shopping related trips than did the average; however, it is not clear whether this difference is statistically significant. Figure 4 displays the referenced estimated travel times for shopping separated between internet users and the average of the entire sample for each age group, as shown in the study. While this is not conclusive, it does indicate that younger generations may react somewhat differently in their travel habits to online shopping than do older generations, and signals the need for further investigation.19
Since the launch of the first social networking sites in 2002 and 2003, social media and social networking sites have gone from serving a few million users in 2004, to connecting more than 800 million people worldwide in 2010.20 The amount of time people are spending on social networking sites is also increasing. As demonstrated in Table 3, the number of monthly minutes spent on Facebook, the most popular social networking increased nearly 700 percent between April 2007 and April 2008. Individual users' time spent on the site has evidently increased, as this dramatic increase was set off neither by decreases in usage on other sites (many of which increased), nor in growth in the number of users on the site (which grew by only a little over 100 percent over the same period).
| Site | Apr-09 Total Minutes (000) |
Year-over-Year % Growth |
|---|---|---|
| 13,872,640 | 699 | |
| Myspace.com | 4,973,919 | -31 |
| Blogger | 582,683 | 30 |
| Tagged.com | 327,871 | 998 |
| Twitter.com | 299,836 | 3712 |
Source: The Nielsen Company
The younger generations were early adopters of social media technologies, with 67 percent of 18 to 29 year old internet users engaging in social media by May 2008, and 86 percent using social media by May 2010, according to Pew Research polls. Older generations are rapidly closing the gap, however, with the percentage of 30 to 49 year old internet users on social media sites going from 25 percent in May 2008 to 61 percent in May 2010. The upward trends for other age groups follow a similar trajectory, as shown in Figure 5.
Figure 5: Usage of Social Networking by Age Demographic
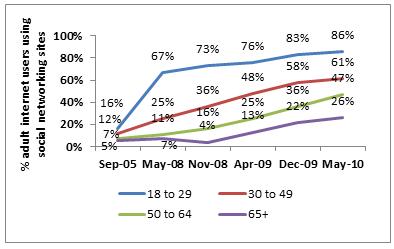
Source: Pew Research Center’s Internet and American Life Project, 2005- 2010 Tracking Surveys21.
Younger generations also seem to be more frequent social networkers. About 60 percent of internet users in the 18 to 29 year old age bracket visit social media sites daily, compared with 39 percent for 30 to 49 year old and less than 20 percent for age groups above 50 years.
Figure 6: Percentage of Internet Users Engaging in Various Activities Online Daily
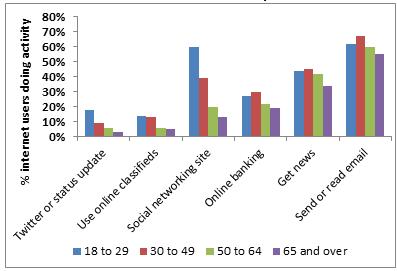
Source: Pew Research Center’s Internet and American Life Project, April-May 2010 Tracking Survey 21
This is a relatively new social phenomenon and the effects of this explosion in social networking on transportation habits have not yet been thoroughly analyzed. However, a few studies present a general framework for considering the theoretical effects of increased social networking on travel. Contrino and McGuckin (2006) suggested that old paradigms attempting to identify substitution, modification and/or complimentary effects are out-dated in this area, and that social networking has complex and ambiguous effects on travel. In some cases online interactions might substitute for social interactions. Alternatively, a wider social network might encourage wider and/or more frequent travel, and increased ease of connecting with others might cause the number and type of social trips to change.
Figure 7: Difference in Minutes Traveling for Social Trips, Internet Users vs. Average
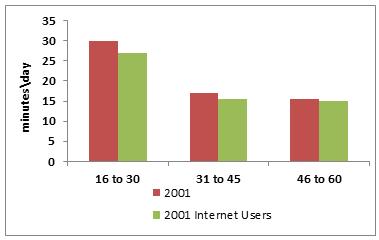
Source: NHTS as shown in Contrino and McGuckin (2006)
Contrino and McGuckin's (2006) employ estimates drawn from the 2001 NHTS to provide some preliminary evidence that internet users may be reducing their time traveling for social and recreational reasons. Figure 7 demonstrates the estimated difference in minutes traveling for social trips between internet users and the average traveler in different age groups in 2001. For each age group (16 to 30, 31 to 45, and 46 to 60), internet users traveled fewer minutes for social and recreational trips than did the average for that age group for the whole sample. This effect appears to be somewhat more pronounced for the younger age groups than it is for the older ones, although it is not clear if any of the differences are statistically significant.
A number of new and emerging technologies are already beginning to revolutionize ICT, impacting the way people telecommute, conduct online purchases and engage in social networking. Much of this innovation is driven by the expansion of mobile internet, the introduction of cloud computing for new and novel uses, and the development of new, more powerful smart devices and tablet computers. According to Morgan Stanley analysts, this new era of mobile connectivity will be about finding ways of doing things faster, better and cheaper. 23
The last wave of expansion of telecommuting and work related collaborative technologies was fueled in large part by the extension of broadband internet to a wider segment of the American public. Similarly, the next wave of expansion will largely be fueled by the development of the mobile internet. Mobile internet, which includes both internet accessible through smartphones and 3G enabled computers and tablet devices, has taken off rapidly in the past several years. Overtime, technologies that allow for mobile access to the internet are replacing those which access the internet through fixed broadband connections. As demonstrated in Figure 8, Morgan Stanley researchers expect global shipments of smartphones to exceed that of desktop PCs and Notebook PCs combined. The demand for tablet computers, which also frequently make use of 3G and public Wi-Fi connections, has also grown aggressively for both personal and business use. It is projected that the percentage of companies providing tablet computers to their employees will roughly double from the last quarter of 2010 to the first quarter of 2011, going from 7 percent to 14 percent of companies, according a recent poll by ChangeWave Research. In many cases the tablet computer will replace a laptop. 24
Figure 8: Global Shipment of Desktop PCs and Notebook PCs vs. Smartphone, 2005-2013 Est.
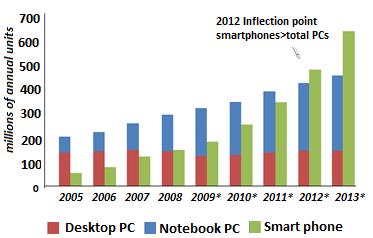
Note: Notebook PCs include netbooks
Source: IDC Gartner, Morgan Stanley Research estimates22
Although most age groups have been quick to adopt these new technologies, web-enabled smartphone devices tend to be more popular among older members of Gen Y and Gen X, with more than 28 percent of smartphone users being between the ages of 25 and 34 and 23 percent of users between the ages of 35 and 44. Younger members of Gen Y, which have less spending power and are less able to afford smart devices, are likely to purchase the devices in increasing numbers as they enter the labor force. The overall age breakdown of mobile and smartphone subscribers is included in Figure 9.
Figure 9: Age Demographics of Total Mobile Subscribers vs. Smartphone Subscribers
Source: comScore MobiLens, 3 Month Average, Ending September 2010
In the same way that smartphones and tablet computers allow people to access the internet wherever they go, cloud computing improves the mobility of access to data. Cloud computing is a set of services whereby computers and other devices can be linked to a remote server via the internet. Services may include, among others, data storage and management and remote hosting of software. Among numerous other uses, this technology makes telecommuting more cost-effective, including for small and medium sized companies, who might not have been previously able to afford the technological infrastructure to support telecommuting. By placing the applications and data used by a company off-site, at an externally managed data center, employees access the company's computer system and files via the internet whether they are in the office or working remotely. This technology could open up telecommuting as a viable option to a wider group of employees.
Despite initial concerns about data integrity and security, a growing number of firms are turning to cloud computing to create a virtual workplace. In an August 2010 survey of IT managers or decision makers at medium and large US firms, researchers at Harris Interactive found that 78 percent of surveyed firms used cloud computing either through private or public cloud computing. Further, 92 percent of managers at surveyed firms believed that the use of cloud computing would increase as current IT platforms need to be replaced.25
Whereas the expansion of broadband high-speed internet into American households made it easier for workers to remain in their homes to work, this new generation of technologies makes it easier for workers to take work with them anywhere. The effects of these technologies on travel behavior, therefore, are extremely ambiguous, and should be examined further.
The introduction of smartphones and tablet computers has led to an explosion in shopping related applications, which will likely have an important effect on shopping habits over time. These applications fall into several categories including direct online shopping sites, sites containing production and price information, and online discount and coupon providers. A summary of some popular shopping related applications for smartphones and tablet computers is included in Table 4.
| Online Shopping | |
| Amazon.com | Access to the online shopping portal on smartphones and tablet computers. |
| MyEbay | Allows you to follow your watchlist including high bidder, current price, shipping / handling, and bid on those items on your smartphone. |
| mShopper | With over 110 merchants and 13 million diverse products available, mShopper has attracted more than 100 specialty and name-brand merchants including Apple, Best Buy, The Gap, GNC, Home Depot, Target, and Wal-Mart. |
| Target.com | Access to online Target store, as well as information on the location hours and services of physical stores. Has a feature to ensure store has item in stock and specify the physical location. |
| Product and Price Information | |
| Consumer Reports Mobile Shopper | Access to Consumer Reports reviews, ratings and information on a smartphone device. Product may be identified using a UPC code. |
| Pricecheckah | Compare prices across multiple websites (Amazon, Buy.com, eBay, Overstock and WalMart) on a smartphone using UPC and ISBN codes. Can be used when shopping at local stores to compare in-store prices to online prices. |
| Online Discounts | |
| Shopkick | Location-based discounts and deals on smartphones. This app finds the closest deals at local stores, based on the user's location, and provides points to users for walking into participating stores. |
| Groupon | Features a daily coupon with steep discounts on products and services in major cities. |
Source: appolicious.com, www.apsafari.com
With the proliferation of smart devices and the increased accessibility of the internet, these new online shopping services and applications have taken off quickly. For example, Groupon, an online coupon discounter, grew 500 percent in five months, going from about 3 million subscribers in April 2010 to 15 million subscribers in August 2010. These subscribers tend to be fairly active, with Groupon estimating that 66 percent of subscribers read Groupon write-ups on a daily basis. While Groupon is the largest of such so-called "Social Commerce" sites, this industry has seen an impressive group of new entrants. Yipit.com, which has been tracking the development of this industry, identified more than 200 different daily deal services as of December 2010. The growth of some of these sites has been strong, such as that of Livingsocial.com, while other sites have remained relatively small scale, such as Dealon.com. Figure 10 provides a demonstration of recent trends with a select set of sites.
Figure 10: Growth in Online Discounting Industry
Source: Compete, Inc 2011.
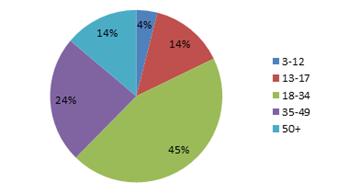
These services appear to be most popular among the younger age brackets. Taking the example of Groupon, as demonstrated in Figure 11, about 68 percent of Groupon users are between the ages of 18 and 34 years, with 45-to-54-year-olds representing 18 percent, 35-to-44-year-olds 11 percent, and over- 55-year-olds only 3 percent of all subscribers.
Figure 11: Age Demographics of Groupon Users
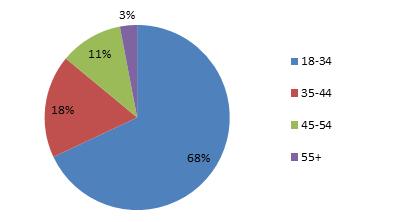
Source: Grouponworksforbusiness.com (Marketing division of Groupon), 2011
The effects of these new applications on transportation are likely to be complex. By providing comparative price information and product availability information on-the-spot, these technologies may reduce some shopping related travel by lessening the need to visit several stores in search of the best price or the availability of a specific product. On the other hand, online discounts provide an incentive for people to get out and spend more, perhaps creating additional shopping or recreation related trips.
Like in the cases of telecommuting and online shopping, social media technologies are becoming increasingly mobile. People can now check their Facebook accounts, or send a "tweet" on Twitter from anywhere they have a cellphone signal. Between January 2010 and January 2011, users accessing Facebook through their mobile browsers increased by nearly 700 percent, from 25 million mobile users to more than 200 mobile users.27 Mobile usage of Twitter has also grown aggressively, albeit from a smaller base. In January 2009, only 1.0 million people accessed Twitter via mobile browser, however this grew by 347 percent over 2009, rising to 4.7 million in January 2010.28 This rapid growth has been driven in large part by smartphone owners; about 31 percent of whom accessed social networking sites in 2010, compared with only 7 percent of regular feature phones.29
Figure 12: Mobile Social Network Usage by Age
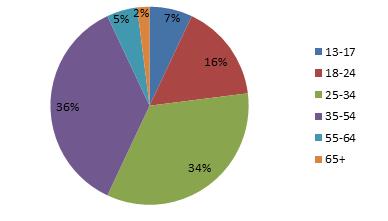
Source: The Nielson Company, December 2009
Despite the perception that this tremendous growth has been driven by Generation Y, data from the Nielsen Company indicates Gen X and Baby Boomers are actually more likely to be engaged in mobile social networking. The frontrunners in mobile social networking as of December 2009 were 35-to-54-year-olds, who accounted for 36 percent of mobile social network users, closely followed by 25 to 34 year old at 34 percent. As a proportion of total social networker, 13-to-17-year-olds represented only 7 percent and 18-to-24-year-olds only 16 percent. Figure 12 provides a full breakdown of mobile social network users by age demographic.
| Gen Y (18 to 34) |
Gen X (35 to 46) |
Younger Boomers (47 to 56) |
Older Boomers (57 to 65) |
Silent Gen (66 to 74) |
G.I. Gen (75+) |
|
| Send or receive text messages | 94% | 83% | 68% | 49% | 27% | 9% |
| Access the internet | 63% | 42% | 25% | 15% | 17% | 2% |
| Play a game | 57% | 37% | 25% | 11% | 10% | 7% |
| Send or receive email | 52% | 35% | 26% | 22% | 14% | 7% |
| Send or receive instant messages | 46% | 35% | 22% | 15% | 13% | 6% |
| Source: Pew Research Center's Internet & American Life Project, April 29-30, 201030 | ||||||
Figure 13: Number of SMS sent or received per month by age
Source: Nielson, State of the Media 2010, US Audiences and Devices26
Gen Y appears to prefer either to continue to communicate by text, or other online media that mimic the short style of a text message. Table 5 demonstrates that 94 percent of Gen Y phone users send or receive text messages, compared with 83 percent of Gen X and 49 to 68 percent of Baby Boomers. As demonstrated in Figure 12, 13-to-17-year-olds receive or send on average of more than 3500 text messages per month, more twice as many the next highest age category, 18-to-24-year-olds. Similarly, about 63 percent of all Twitter users are under the age of 35, as shown in Figure 14.
Figure 14: Age Demographics of Twitter.com
Source: Quantcast, 2010
Not only are social networking sites becoming more mobile, but social networking sites are increasingly using geolocation technologies to follow the movements of their users. As of June 2010, more than six million people had already signed up for geolocation services like FourSquare and Gowalla, which enable users to follow their friends' locations and to search for nearby merchants and deals via their smartphones.31
Figure 15: Age Demographics of 4Square.com
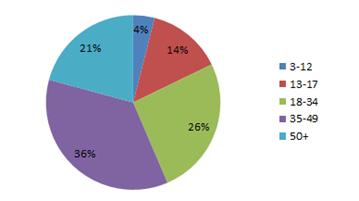
Source: Quantcast, 2010
Social networking sites like Facebook and Twitter have added location-based features, and other companies are developing similar apps, including those which display ads based on an individual's locations. As with other social networking sites, geolocation apps are most popular with older age groups. The largest group of users of 4square.com is between the ages of 35 and 49 years, who represent 36 percent of total users compared with 26 percent for 18-to-34-year-olds, as shown in Figure 15.
Much like the cases of telecommuting and online shopping, the effects of mobile social networking on transportation are likely to be complex, particularly with new geolocation technologies. By allowing users to log onto social networking and social gaming sites from their mobile phones, users are freed up to engage in these activities while on the go. Further, the ability of new applications to detect the location of their friends may lead to changes in trip chaining, with people organizing impromptu social trips while traveling for other reasons. At the same time, some individuals may opt to take public transportation or carpools to be more able to engage in social networking or social gaming during their commute.
Innovation in information and communication technology continues to move at a rapid pace, with new services being launched nearly every day. These technologies are also becoming increasingly mobile, affordable and widespread. Creating un-paralleled opportunities to change the way we work, shop, and socialize, these technologies make it easier to conduct these activities from the comfort of our own homes. At the same time, mobile internet technologies and new forms of computers and phones are making it increasingly possible to access our workplace, favorite stores, and social networks from anywhere that has cell phone coverage.
The current state of knowledge of the effect of these technologies on transport behavior varies somewhat, depending on the technology. Some of these effects, particularly those of older forms of these technologies such as telecommuting, have been well documented. Even in these more established technologies, however, it seems that younger age groups may use these technologies in slightly different ways than their older counterparts. This area is sure to remain an interesting and lively area of research over the coming years.
New advancements in the area of payment systems have increased the convenience of payment for public transportation, as well as for road usage through toll-roads and high occupancy express toll lanes (HOT lanes). These advancements are all the more important as State DOTs and local transit agencies are facing increasing pressures to reduce operating costs and increase revenues, all while improving customer convenience and quality of service. Integrated transportation payment systems (ITPS) have the potential of doing all of the above provided the general public and elected officials perceive that these payment systems are secure, preserve privacy and do not lead to fraud. In addition, an integrated system balances interests in increasing efficiency, mobility and customer convenience with concerns for security and privacy. Over the past decade, there has been an increase in the use of electronic toll collection and fare payment.
In general, these technologies allow for more efficiency in payment for road use and public transportation, and in some cases allow for new forms of payment for road use, as in the case of hot-lanes. The following sections will describe the technologies, the prevalence of their use, and, where information is available, describe how these technologies may affect transportation choice.
Electronic payment technologies include the use of magnetic stripe cards, 'smart cards', and electronic toll collection transponders and systems. Many of these technologies have been in existence for several decades, but are only slowly being brought into use for transportation. Electronic payment systems allow for road use and public transportation trips to be paid electronically, using a smart-pass, smart card or magnetic stripe card. Value may be added to the card or device, and the cost of a trip is deducted for each trip. Where available, the card or device may act as a pass that allows the user unlimited access for a certain period of time, typically a month. The card or device may also contain client information, such as funding program and trip eligibility, and may contain the client's photograph. The following will detail the use of such technologies for road use and for public transportation.
Electronic tolling for road use in the U.S. began in 1992, when the E-ZPass Interagency Group was established to pilot a system in New York and New Jersey. Since this time, 24 agencies in 14 states have joined the E-ZPass Interagency Group. These agencies use RFID transponders, which communicate with reader equipment built into lane-based or open road toll collection lanes. E-ZPass users in many areas can purchase a transponder preloaded with funds at retail locations such as supermarkets and pharmacies. The transponder can be reloaded automatically from the user's credit card.
Figure 16: Coverage of the E-ZPass Interagency Group
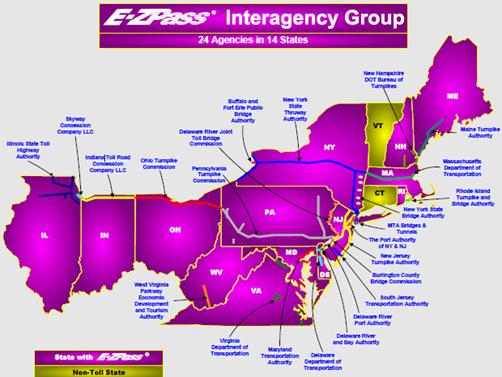
Source: E-ZPass Interagency Group, 2011.
To allow easy transit between agencies in the system, all agencies are connected through a secure network. Thus, travelers on this network can driver from Maine, through Virginia, and west past Chicago on toll roads without ever having to stop at a toll booth. Other electronic tolling systems have cropped up in other part of the country, including i-Zoom in Indiana, MnPass in Minnesota, K-Tag in Kansas, "Good to Go!" in Washington State, PikePas in Oklahoma, SunPass in Florida, TXTag and TollTag in Texas, and FasTrak system in California.
High occupancy toll express lanes, known as HOT lanes, use electronic tolling to charge for use of underutilized capacity in high occupancy vehicle lanes (HOV) by vehicles that do not meet the system HOV criteria. Using the same devices as in other electronic tolling, these lanes charge a variable toll based on factors such as the time of day, level of service, and other factors. At least seven states have already implemented at least one HOT lane project, and at least 5 states are in the process of constructing a HOT lane.
Electronic Tolling may shift travel behavior by charging for underutilized capacity. By allowing for variable pricing, based on the time of day, level of service and other factors, the introduction of electronic tolling may shift traffic away from peak hours, offer shorter trip duration and higher reliability. One study on toll roads in N.J. found a small but statistically significant shift in car traffic to pre-peak hours in the morning (5-6 AM) and afternoons (3-4 PM). The individuals who shifted their behavior were more likely to be younger, with lower household income. Women were more likely to change their behaviors than were men.32 Additionally, some road users may shift from newly tolled roads onto alternative routes including non-priced interstate, primary and other secondary roads in order to avoid tolls. Proposals for Mileage Based User Fees (MBUF) could capture and charge for all vehicle travel.
Technologies commonly used in public transportation include magnetic stripe cards and smart cards. The most common type of electronic media used in transit Electronic Fare Payment EFP systems is the magnetic stripe cards. The inexpensive cost, proven technology, and high consumer acceptance of magnetic stripe cards have made them successful in the transit industry. Depending on the design of the system, these cards can be used to store value over time, holding value worth more than one transit fare. Because fares are deducted in an automated fashion, time-based and/or distance-based fare structures are possible. Stored value cards also store information that can be used in multi-operator transit networks. Trip origins and destinations can be recorded on cards and subsequently read and used to split revenues between the different transit operators. Magnetic stripe cards can also be used as an "electronic purse" where stored value can be used for small purchased from cooperating merchants.
While magnetic swipe cards have been in use for over four decades, smart cards have gained acceptance only in the past 5 years. Smart cards are made of plastic, similar to a credit card and contain microprocessors and memory chips with wireless communication capabilities33. Smart cards, sometimes called integrated circuit (IC) cards, are similar to magnetic stripe cards — but store the information on an embedded microcomputer chip rather than the stripe. The term "smart card" is a generic name for cards that vary in their sophistication and design. Most smart cards require readers like the magnetic stripe cards, but with specialized contacts.
Smart cards offer the following benefits over magnetic-stripe media for use in multipurpose arrangements for a number of reasons. Smart cards and their supporting equipment have shown to be more reliable. Also, they have greater data and processing capabilities. Finally, the move toward adoption of smart cards by the banking and financial services industries creates a potential for joint arrangements.
Smart cards have been used in a range of applications including toll and parking payments, internet access and mobile commerce. Adoption of smart cards by transit agencies allow for partnerships with toll and parking systems, employers, universities, financial institutions and telecommunication companies34. However, transit system managers are often uncertain about the costs and, particularly, the benefits of moving to smart cards; this is especially the case for the often complex interoperable smart cards systems35. A recent successful implementation of smart cards is Transport for London's Oyster Card36. The smart card alliance (http://www.smartcardalliance.org/) provides updates on the advances in the state-of-the-art and state-of-practice in Smart Cards. The Alliance membership includes over 150 U.S. based and international organizations.
Figure 17: Deployment Trends for Electronic Toll Collection and Fare Payment, 2000-2006
Source: FHWA, 2008.
As shown in Figure 17, use of these payment technologies has increased significantly over the course of the past ten years. As transit agencies phase out their older vehicles, they are increasingly investing in vehicles equipped for electronic toll collection and fare payment.
These technologies make the use of public transportation more convenient, thus lowering one major barrier to use. Riders no longer need to carry correct change in order to ride the bus, and riders of light rail or subways no longer need to keep track of multiple tickets. Increasingly, riders who transfer between modes of public transportation no longer need to carry a transfer pass, as transfer passes are often automatically loaded onto smart cards.
Further, electronic payment systems allow transportation providers and funding agencies to track trips more accurately, thus increasing accountability and reducing waste and fraud. For example, an electronic payment system can verify that the correct person took a trip for which her/she was eligible. When coupled with an AVL system, the locations where a passenger boarded and exited the transit vehicle, and the trip length, can be documented. Electronic payment systems help ensure that transportation providers get reimbursed correctly for trips they provided, and that funding agencies get billed correctly, with the correct funding program being charged. In addition, one card can accommodate multiple transportation providers and funding agencies, and is therefore convenient for customers and vehicle operators.
To summarize, as illustrated in the table below, 67 percent of people between the ages of ages 25 and 47 use the EasyPay Express, an electronic payment system for transit fares.37 It is expected that the percentage using systems such as EasyPay express systems will increase in the next decades.
| Total | Cash | MC Non Bonus | MC w Bonus | 7 Day Pass | 30 Day Pass | Single Ride | EasyPay Express | |
|---|---|---|---|---|---|---|---|---|
| 18-24 | 8% | 8% | 11% | 5% | 10% | 10% | 9% | 6% |
| 25-54 | 66% | 55% | 69% | 67% | 74% | 78% | 61% | 67% |
| 55-64 | 19% | 24% | 15% | 25% | 14% | 12% | 22% | 14% |
| 65+ | 7% | 14% | 6% | 2% | 2% | 1% | 8% | 13% |
| Median Age | 43 | 46 | 41 | 43 | 40 | 39 | 43 | 43 |
Innovations in smartphone technology and in the financial service industry may provide additional, even more convenient means of paying for road use and for public transit. The American Public Transportation Association (APTA)Universal Transit Farecard Standards (UTFS) program is actively promoting the Contactless Fare Media System Standard (CFMS)38 for use in contactless fare systems throughout North America. Additionally, there are exciting developments in the contactless payments industry that will simplify the future of transit fare collection. These include using contactless bank cards, mobile devices, and identification credentials to pay for transit fare.
Systems to pay for public transit use through cell phones are currently being tested, and yielding promising results. A recent pay-by-phone trial in San Francisco, the first of its kind in the nation, was so promising that the Bay Area Rapid Transit system is considering adopting this method. In this trial, San Franciscans used phones equipped with a special technology called near-field communication. These 'Near Field Communications' (NFC) microchips allow secure communication between the phones and the sensors.
In the pilot program, 230 BART riders were provided with NFC-enabled mobile phones that worked on the Sprint telecommunications network. Each rider had multiple prepaid accounts that were managed through account management software on the phones. One account allocated funds for rides on BART. Another account was for use at Jack in the Box restaurants, utilizing the pre-existing "JackCa$h" prepaid program. For the transit portion of the trial, riders tapped the mobile phones on top of the turnstiles. Their payments were automatically registered and debited from their BART fare accounts. Data from the trial shows that participants took nearly 9,000 trips using the phones, representing an average of 50 trips per person over the four-month period of the trial. In addition, participants reloaded their BART accounts more than 800 times using the over-the-air feature in the phone, which equates to an average of five BART reloads per trial participant. At the conclusion of the trial period, 80 percent of the participants indicated that the mobile wallet application was easy to use. Evidence from the trial indicates the participants were highly satisfied with their phones. The phones also interacted with "smart" ad posters, so users could find the nearest restaurant and check the menu.
The technology is already used in Europe, Japan, China and South Korea. For the customer, this new technology is greatly convenient, particularly with the increased use of cellphones among members of Generation Y. For users of smartphones, this may create an added incentive to use public transit. Further, similar applications for the technology could be envisaged for road pricing, with drivers paying for toll roads and HOT lanes directly from their smart phones.39
In addition to innovations in payment through cell phones, a number of financial institutions are teaming up with transit agencies to allow for payment directly via credit card or bank card. Many agencies would like to modernize their transit fare payment systems through electronic payments based on contactless bankcards that support Visa payWave, MasterCard Worldwide's PayPassâ„¢, or other open bankcard contactless applications. Doing so would have a profound impact on not only the transit authorities but also the millions of customers they serve. Philip Keitel writes in a Federal Reserve Bank of Philadelphia discussion paper: "The move to fare payment systems based on contactless open loop payment cards represents a significant change, one that will affect the daily lives and possibly the payment preferences of millions of Americans."40
"Open bankcard standards" for payments are set by the world's most common financial networks, including Visa and MasterCard. Customers (riders) would be able to use electronic payment methods — credit, debit and prepaid—that get processed through an existing financial network. By adopting an open bankcard standard for fare payments, a transit authority could take itself out of the banking business and become just another merchant capable of accepting electronic payments at the point of sale. It enables a transit authority to procure a merchant acquirer and a prepaid program competitively. If the market changes and a more competitive arrangement is negotiated, a transit authority could make a change in providers without switching hardware and automated fare collection (AFC) providers.
Many transit authorities have a genuine interest in moving to open bankcard payment standards. For example, Jerry Kane, manager of Capital Program Planning at the Southeastern Pennsylvania Transportation Authority (SEPTA) New Payment Technologies Project, describes his vision for the future, characterizing SEPTA's planned system as "an integrated electronic fare payment and collection system capable of accepting both SEPTA- and bank-issued cards and capable of interfacing with both bank and nonbank financial clearing systems for transaction settlement."
Everything about an open bankcard payment fare system is a positive for customers. Riders can use the cards they already have without going through an intermediate step of purchasing a transit-specific card or token. The same cards can be used at retail locations located near the transit stations. Prepaid cards can be reloaded at many convenient retail locations as well as on the Web, and not just at transit authority kiosks. The convenience and comfort of using a familiar card encourages new people to ride — a real plus for the transit authority.
Integrated transportation payment systems (ITPS) have the potential for increasing efficiency, mobility and customer convenience with concerns for security and privacy. Over the past decade, there has been an increase in the use of electronic toll collection and fare payment. Emerging technologies such as open bankcards and pay-by-phone fare payment systems have been well received not only by transit users but also by transit agencies across the globe. With an increase in the use of smart phone among current teens and young professionals the increased implementation and widespread use of pay-by-phone payment systems can be expected in the next decade.
Global positioning technologies (GPS) and intelligent transportation systems (ITS) have changed the way we travel. GPS allows drivers to more easily navigate to known and un-known destinations, and to change their route in case of traffic congestion. ITS, in addition to its application for electronic payment, which are discussed in the payment systems section, has also been used for dynamic traffic light sequencing and speed limit adaptation to allow for more efficient flow of traffic. These technologies have had a particularly important impact on public transit, allowing for improved predictability in arrival time and improved trip planning capabilities.
The following section will describe these new technologic advances, providing their application for both drivers of passenger vehicles and public transit users. When information is available, the section will also examine how patterns of use of these technologies differ between generations.
Over the past decade, GPS and ITS technologies have gone from being the domain of a few IT early adopters, to a standard set of equipment for drivers and non-drivers alike. These technologies provide dynamic information to the user, allowing them to make more informed decisions on their travel, and alter their travel plans based on new emerging information about traffic and road conditions. The effects of these technologies on passenger car transportation and public transit will be profiled separately below.
The GPS navigation device market has expanded rapidly. In a July 2010 report, IE Market Research estimates that there were 6.2 million voice-guided in car navigation users in North America in 2009, and project that the number of users will rise to as many as 17.2 million users by 2014. Strong growth in the number of users is likely to be driver by a number of factors, including:
GPS has the potential to revolutionize the way that people drive. Most GPS devices include a feature which provides constant update of road conditions and traffic congestion, and the GPS device can update the proposed route on that basis. Thus, by providing information, GPS can help to relieve traffic congestion on main arteries, and re-direct traffic to secondary roads. An early study on this topic, Schofer, Koppelman and Charlton (1997), found that in 2 week trials with drivers "dynamic route guidance systems" were most effective when drivers have control for route planning and the computer is primarily responsible for data acquisition, organization and evaluation of driver defined routes.42 Using a traffic simulation model, Yahashita et al (2005) show that when route information is shared between users of GPS devices, all drivers' driving time decreases, with more substantial reductions for those drivers involved in route information sharing.43 Drivers do appear to be open to route shifting, as a survey implemented by TomTom showed that 71 percent of survey respondents reported change their routes depending on the time of the day they travel to avoid traffic.44
While it appears that all generations use GPS technologies, it appears that a higher proportion of younger generations (Gen X and Gen Y) use these technologies. Further, different generations use GPS technologies differently. A study by TeleAtlas found that when lost, Baby Boomers and the Silent Generation were more likely to revert to traditional methods of obtaining directions when lost, such as stopping at a gas station, while Gen X and Gen Y are more likely to prefer to use digital directions, or to make a phone call to an acquaintance or friend to get back on track. 45
Advanced Public Transportation Systems (APTS) are technologies used to improve the efficiency and effectiveness of public transportation operations, vehicle maintenance, and administration. The technologies include a wide range of computer databases, software and hardware as well as vehicle devices such as mobile data terminals (MDTs), global positioning satellites sensors (GPS), and automatic vehicle location (AVL) systems. Another set of applications is geared towards information dissemination, Advanced Traveler Information Systems (ATIS), plays an important role in improving the convenience, safety and efficiency of travel by assisting travelers with pre-trip and en route travel information.
New technologies help transit agencies to improve planning and management, keeping track both of their vehicles en-route, as well as their customers. Important management tools enabled by ITS technologies include:
On the basis of these systems, transit agencies are able to provide real-time transit information, thus making the public transit system, more efficient, accessible and user friendly. Real-time information is accessed through a variety of media including dynamic message signs (DMS) at stops and stations, cable television, personal digital assistants (PDAs), the Internet and telephones. Some examples of these services include:
Riders use this information to make various decisions about modes of travel, travel routes, and travel times. The availability of real-time transit information helps travelers make efficient use of their time by allowing them to pursue other activities while waiting for a bus or train. APTS have a proven impact on ridership and customer satisfaction. With new technologies emerging every day, new applications are tested and evaluated as they impact operations management invariable efforts to improve ridership and customer satisfaction.
Provision of adequate, timely information on public transit routes and accurate real time schedules may push marginal public transit users to opt for public transit over driving. The effects of these technologies on transportation choice are not yet well understood, and are likely to be an important subject of research going forward.
The rapid expansion of GPS and ITS technologies over the past ten years creates a strong incentive for continued innovation; the further expansion of these technologies over the next ten years will be fueled by the continued growth of use of smart phones, which increase the accessibility of the data produced by these systems. Further, development of new technology will be pushed by the infiltration of GPS into the huge Chinese and Indian markets via smart phones. China alone has at least 800 million cell phone users, with Chinese consumers showing themselves to be rapid adopters of new technologies. In 2010, 473 GPS-capable cell phone models were released in China, a 105 percent increase from 2009.50Analysis of the innovations currently being tested indicate that the next wave of technologies will provide more personalized information, and will better share and aggregate information for better management of the entire system.
One such technology is a personalized information portal, which would present the traveler with the various options and routes, via public and private transport, with predicted timings and costs (both financial and environmental), leaving travelers to make an informed choice. It is important that such a system not always suggest the same route for the same journey, but that it take-in sufficient information about the context of the journey. For example, if someone is travelling for business, that individual may prioritize speed over cost, and require access to a workspace and a WiFi connection. Alternatively, the system may be programmed to know that a firm has a strict environmental policy and display the lowest-carbon route. The system might also predict which roads are likely to be congested and when. Finally, the system may be able to account for known variations to the regular pattern of public transit rather than following published timetables. Currently IBM is working on such a system called Satnav and "part of the intelligence will be in making sense of the data and filtering out what's not important," says Illsley. "If my train is two minutes late I don't want to know. If it's 10 minutes late I do, and I want to know what that means for my connections."51
Resident futurologist at British Telecom, Robin Mannings, predicts that pre-booked individual trips could enter into a master plan deliberately sorting travelers into different routes or even different modes of transport in order to reduce congestion. With this sophisticated web of information, the system could automatically re-book a traveler onto an alternate flight or route in the case of an unforeseen problem. For example, in case of delays, the system could advise travelers to park and continue by train if a road becomes jammed. Manning suggests that for this system of linked travel and personal journey planning to work, it must be supported by several kinds of data, including detailed digital maps, accurate timetables, historical information about usage and congestion patterns, details of planned but temporary factors such as road works or major events, and real-time information on current congestion.
Much of this information already exists or is being created, thanks to the current system of ITS. The next important step will be to develop systems that fuse all this disparate data together to generate a consolidated picture, which covers multiple modes of transport and which allows the type of real-time, personalized services described above. While an integrated system is being developed, however, small innovations are possible and collecting and sharing travel information is not always based on expensive technology, it is just a matter of using existing technologies creatively. For example, a taxi company in the United Kingdom sends customers a text message when their cab is 10 minutes away, based on real-time ETAs from its GPS navigation system. In another example in rural Hampshire, IBM has a 'tweeting' staff shuttle bus that uses Twitter to inform would-be passengers of its precise location and whether it has seats available.
IT advancements will also improve the efficiency and attractiveness of mobility-sharing programs. Car sharing has flourished. In Europe, where in 1999 there were over 200 organizations in 450 cities involving over 130,000 participants (Sperling et al., 1999). Most car sharing involves use of general-purpose automobiles, but some programs involve sharing cars for access to public transport and sharing of alternative fuel vehicles, or both (e.g., the CarLink Program, which provides cars for access to a rail transit station in the San Francisco Bay Area). IT can facilitate reservations and billing and can allow clients to check on the real-time availability of vehicles at any given location.52
The first generation of route finding and satellite navigation systems were little more than electronic map-readers that took little account of the kind of vehicle you were driving or when one was driving it. By favoring motorways and trunk roads over alternatives that were often emptier and more direct, they may even have added to congestion by funneling everyone into the same bottlenecks. However, advances such as the Satnav system created by IBM are increasingly changing the way the Internet generation is traveling.
Smart mobile phones and handheld wireless Internet devices will increase the efficiency and pleasure of working while on the move. Future IT should greatly enhance the potential for effective and user-friendly traveler information. ATIS will be able to take advantage of elegant new Internet technology. Travelers will be supplied information on track conditions and near-term forecasts as well as real-time information on hazards and incidents. Specialized applications will undoubtedly include providing access information for handicapped travelers, tourists, and anyone with unusual requirements. 53
Recent studies have shown that fuel economy is one of the most important factors in vehicle choice.54 In a 2009 report on the future of the auto industry, Deloitte and Touch predicted that an era of price conscious and environmentally conscious consumers are emerging, creating demands for new technologies that improve fuel efficiency.55 Fuel efficiency has become increasingly important given recent volatility in the price for gasoline prices, especially recent price hikes in 2007 and 2008. A survey on car buying by Capgemini in 2010 found that 43 percent of respondents own a fuel-efficient or alternative-fuel vehicle in 2009, up from 41 percent in 2008 and 36 percent in 2009.56 As gasoline prices return to high levels over the course of 2011, and households continue to suffer economically due to a stagnant economy, the fuel efficiency of vehicles will likely remain an important part of the decision making process for car buyers. Further, this trend may be reinforced by environmental attitudes of members of the younger generation who are purchasing their first vehicles.
While the first hybrid car was developed more than a hundred years ago,57 mass-production of such vehicles did not begin until the late 1990s, with the introduction of the Toyota Prius.58 The US hybrid market has grown rapidly over the past several years, with the number of annual units sold rising from 88,000 in 2004 to a high of 346,641 units in 2007. Since 2007, market for hybrids has tempered somewhat with the onset of the recession, and a gradual reduction in oil prices from their heights in June-July 2008.59 Figure 19 describes the trends in the US hybrid market between 2004 and 2010.
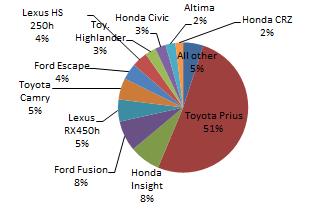
Figure 18: US Hybrid Market by Model, 2010
Source: Hybrid Market Dashboard 2010, hybridcar.com
Figure 19: Trends in US Hybrid Market 2004-10
(number of units sold)
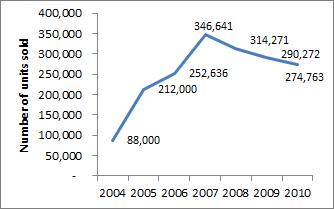
Source: Hybrid Market Dashboard 2004-10, hybridcar.com
A few vehicles dominate the market for passenger cars, with the Toyota Prius representing over 50 percent of hybrid sales in 2010. The next two most sold hybrid vehicles are the Honda Insight and the Ford Fusion, both of which are sedans like the Prius. A number of SUV or crossover vehicles have also entered the hybrid market, including the Ford Escape and the Toyota Highlander. These vehicles, however, remain a small segment of the overall US hybrid market. Figure 18 provides a breakdown of the US passenger car hybrid market by model for 2010. Hybrid cars can provide significant fuel economy, particularly on city driving. One highway driving, however, a number of small non-hybrid cars come close to competing with the hybrids. For more details, please refer to Table 7.
| Fuel Economy | City | Highway |
|---|---|---|
| Hybrid cars | ||
| Toyota Prius (2010) | 51 | 48 |
| Honda Civic Hybrid (2010) | 40 | 45 |
| Ford Fusion (2010) | 41 | 36 |
| Small non-hybrid cars | ||
| Ford Fiesta | 30 | 40 |
| Toyota Corrolla | 28 | 37 |
| Ford Focus | 24 | 35 |
| Toyota Yaris | 29 | 35 |
| Honda Civic | 26 | 34 |
| Source: www.Fueleconomy.gov | ||
This trend towards environmentally friendly vehicles has been even more pronounced in the case of public transportation. As of 2008, hybrid buses, natural gas buses, and biodiesel fueled vehicles made up nearly 30 percent of all public transit buses.60 Both small and large cities have begun to move towards using these new technologies, replacing their old fleets gradually with more fuel efficient and less carbon emitting vehicles.
Improved fuel efficiency of vehicles may lead to a shift in driving behavior, as higher fuel efficiency effectively reduces the cost to drive an extra mile. Improved fuel efficiency may also lift the perceived "environmental cost" of driving the extra mile, leading even environmentally conscious drivers to take to the road more often. This so-called "rebound effect" has been the study of transportation planners for many years. It is generally defined as the percent increase in vehicle miles traveled (VMT) in response to a one percent improvement in fuel efficiency. Most studies looking at the later part of the 20th century found that this effect was about 20 to 25 percent.62 Thus an increase in fuel efficiency may lead to higher road congestion, particularly in urban areas.
| 18-29 | 30-49 | 50-64 | 65+ | |
| World oceans will be less healthy than today | 74% | 60% | 55% | 51% |
| Environmental quality will not improve* | 62% | 51% | 43% | 42% |
| Earth will get warmer* | 77% | 63% | 65% | 61% |
| * definitely/probably Source: Pew Research Center/Smithsonian magazine April 21-26, 201061 |
||||
| Environment is priority | Economic growth is priority | |
| 18-49 yrs | 51 | 47 |
| 50 yrs+ | 37 | 58 |
| Source: CNN/Opinion Research Corporation Poll. March, 2010.63 |
||
| 18-34 | 35-54 | 55+ | TOTAL | |
| Yes | 78.3 | 69 | 64.1 | 70.5 |
| No | 19.4 | 28.1 | 32.5 | 26.6 |
| Don't know | 2.3 | 2.9 | 3.4 | 2.9 |
| Public Policy Institute of California, July 201064 | ||||
Looking forward, Generation Y has been strong advocates for environmental causes, which may help reinforce the consumer base in the future for fuel efficient vehicles. As shown in Table 8, young people are more likely to predict adverse environmental outcomes than older age groups. Further, according to a CNN poll, younger people appear to be more willing to make a tradeoff with respect to economic growth to maintain the environment (see Table 9). In a survey conducted of California residents by the Public Policy Institute of California, people under the age of 35 are much more willing to see tough standards on new cars to reduce air pollution than are their older counterparts, as indicated in Table 10.
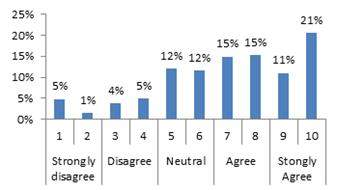
Figure 20: Gen Y Response, "The Environment is an Important Factor when Purchasing a Vehicle."
Source: Deloitte, Automotive Gen Y study, 2010
Further, Generation Y appears to place a high importance on fuel efficiency and the environmental impact of their car choice. A 2010 study by Deloitte and Touch found that gas mileage was the single most important factor to Gen Y buyers, above affordability, appearance, and reliability. In this same study, Deloitte also found that only about 15 percent of Gen Y respondents disagreed or strongly disagreed with the statement, "The environment is an important factor when purchasing a vehicle," and 62 percent agreed or strongly agreed with that statement (see Figure 20). Further, about 53 percent would pay more for an environmentally-friendly vehicle. At least some of this effect is economic as 64 percent would pay more for a vehicle that is both better for the environment and saves money on energy costs.
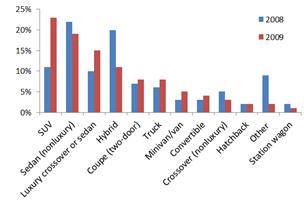
Figure 21: Gen Y Response, "What type of vehicle do you see yourself driving in five years?"
Source: Deloitte, Automotive Gen Y study, 2010
The commitment of Gen Y to remain consistent with these environmental values is still unproven. In the above referenced 2010 Deloitte study, the percentage of Gen Y respondents indicating that they see themselves driving a hybrid in five years declined from 20 percent in 2008 to 11 percent in 2009 and the percentage of those choosing a SUV increased from 11 percent to 23 percent between these two years. Figure 21 provides a summary of these trends. This increased interest in SUVs stands in contradiction to Gen Y's strong preference for fuel efficient vehicles (which was measured in the same sample as was the increased interest in SUVs), and to Gen Y's professed environmentalist beliefs. This finding raises questions not only on the strength of the Gen Y's environmental commitment, but also raises questions on the how effective environmental attitudes are in changing transportation behavior. Box 1 explores these issues in more detail.
Box 1: Effectiveness of Environmental Attitudes to Affect Transportation Behavior
|
The relationship between environmental knowledge and attitudes on the one hand, and environmentally responsible transportation choices on the other is far from clear cut. As pointed out by Flamm (2007), as environmentalism became increasingly common in the U.S. between the mid-1970s and the mid-1990s, vehicle miles traveled were on the increase, and the average number of passengers per vehicle declined. In light of this somewhat tenuous relationship, Flamm (2007) undertook a Knowledge-Attitudes-Behavior (KAB) survey.65 On the basis of the responses to this survey, Flamm constructs a Knowledge index and an Attitudes index, measuring the relative strength of each individual's environmental knowledge and attitudes. The study found that environmental attitudes had a small statistically significant positive relationship with the fuel efficiency of the vehicles in a household, as well as small statistically significant negative relationship with number of household vehicles, annual miles driven and estimated annual household fuel consumption. Environmental knowledge appeared to have a smaller effect than did environmental attitudes. In another similar study in the U.K., Anable (2005) uses the results of a mail back survey66 to categorize individuals by attitudinal statements, and to assess how people of different attitudinal categories varied with respect to car ownership, use, and frequency of use of non-personal car modes. The six attitudinal categories identified in the study include:
Anable (2005) further goes on to show that these different attitudinal categories behave in distinct ways, as outlined in the table below:
Overall, this research indicates that environmental attitudes can influence individual's travel behavior, but this influence will likely be relatively minimal, and in some cases isolated to small groups of highly dedicated individuals. |
||||||||||||||||||||||||||||||||||||||||||||||||||||||||||||||||||||||||||||||||
Sources: Anable (2005) and Flamm (2007)
At the moment, Baby Boomers continue to be far more likely to drive hybrid vehicles than their younger counterparts. J.D. Power and Associates' 2007 review of auto industry marketing showed that only 2 percent of hybrid owners are 24 or younger; while 29 percent are between 45 and 54; and 33 percent are 55 and older.67 This may be in part due to the high price tag of hybrid cars compared with other small cars. However, as more and more Gen Y shoppers enter the car market, it will become increasingly important to gauge their car buying behavior. Their presence is already beginning to be felt. It has been estimated that starting in 2010, Gen Y will buy one out of every four new U.S. vehicles purchased, and within 10 years they may represent as much as 40 percent of the car market.68
By the time that Generation Y enters the car market in force, however, a new set of fuel efficiency technologies may have come into vogue and the prices of hybrid vehicles may have declined to a more widely accessible level. The most prominent of these new technologies are electric cars and hydrogen fuel cell cars. A number of electric cars have begun to enter the US car market, and some hybrid cars are now including plug-in versions which allow the car to use the electric powered engine more heavily. Hydrogen fuel cell cars, however, are still largely at the concept stage, and it may be several years before a commercially viable model is launched.69While electric cars are now readily available in the US car market, there is not yet a strong consumer base for these new vehicles. Mike Omotoso, director of powertrain forecasting for J.D. Power and Associates estimates that plug in hybrids and full electric cars, which are now only an infintessimal part of the market, will likely only reach one to two percent of the market by 2020.70 A 2010 Deloitte and Touche study on emerging automotive technologies indicated that there are four major barriers to the widespread adoption of electric vehicles:
At the moment, electric cars are much more expensive than traditional gasoline powered combustion engine vehicles. A 2009 report by Price Waterhouse Coopers estimates that electric cars cost about $7,000 -$20,000 more than traditional vehicles, with the difference in price being mostly attributable to battery cost (Price Waterhouse Cooper, 2009).72 Table 7 provides a summary of the cost and performance of a number of up and coming electric vehicles.
| Automaker | Model | Charging time* | Range* | Aprox. Price | Launch date |
| Think Global AS | Think City | 13hrs | 112 mi | $25-33,000 | 2007 |
| Tesla | Roadster | 3.5hrs | 217 mi | $97,000 | 2008 |
| Mitsubishi i-Miev | Quick-charge: 80% in 30 min.; household charger (200V): 100 % in 7hrs | 99 mi | $30,000 | 2009 | |
| Subaru | Plug-In; Stella | 50 mi | $47,900** | 2009 | |
| BYD Auto | E6 | Quick-charge: 50% in 10 min | > 250 mi | $42,000 | In US 2012 |
| Nissan | Leaf | Quick-charge: 30 min | 99 mi | $32,500 | 2010 |
| GM | Volt | 10hrs (120V) | 40 mi | $41,000 | 2010 |
| Ford | Focus | 2011 | |||
| Tesla | Model S | Quick-charge: 45 mins | 158-298 | €50 - 60 k | 2012 |
| * based on European model specifications ** not for sale in US | |||||
| Source: Deloitte, "A new era Accelerating toward 2020 — An automotive industry transformed," 2010 | |||||
This difference in price can represent a significant barrier for most buyers. A 2010 study the Boston Consulting Group calculated for U.S. electric car purchasers to be able to break even within three years, at least one of three conditions would need to be met:
Without such incentives, it could take up to 5 years for a consumer in the US to break even on their electric car investment, an amount of time which is beyond the economic planning horizon of most consumers. The US Federal Government currently provides a tax credit of $7,500 for electric, hybrid and plug-in hybrid cars, and many states provide additional incentives.74 Improvements in the cost of batteries and specialized microprocessors used in these vehicles may bring this technology within the reach of more consumers.
Another barrier to the development of the market for electric cars is related to their limited range. As demonstrated in Table 12, a number of the first generation of electric vehicles has a range of less than 150 miles. While most US commuter travel less than 40 miles round trip on their commutes, this range limits the flexibility of the vehicles for use in long-distance travel. Further, drivers of these vehicles would have to plug in their vehicles every night to recharge, a process that can take several hours, compared to the several minutes that is required to refuel a gasoline powered combustion engine powered vehicle.
Additionally, these vehicles create the need for the construction of an accompanying infrastructure of re-charging stations. These stations have begun to be constructed in some large cities, but their prevalence remains limited, with California being the only state with more than 50 recharging stations, and as many as 17 states with no recharging stations, as shown in Figure 22.
Figure 22: Prevalence of Electric Vehicle Recharging Stations
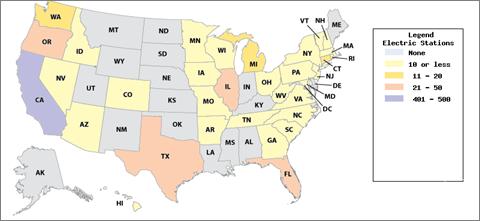
Source: Department of Energy, Alternative Fuels and Advanced Vehicles Data Center, 2010.
Several other technologies are on the horizon, which promise to reduce the environmental impact of passenger transportation. For example, natural gas powered vehicles. GM is rolling out compressed natural gas (CNG) and liquefied petroleum gas (LPG) alternatives to the Chevrolet Express and GMC Savana in 2011. Honda offers a natural gas version of its popular Civic for only $25,500, although only about 1,000 are sold per year mostly for corporate or government use. This technology has already become popular in other countries. According to the International Association for Natural Gas Vehicles, the United States has only 110,000 natural gas vehicles, compared with 2.3 million in Pakistan, 1.8 million in Argentina and 1.7 million in Iran. For this to be a truly viable option, however, the government and the private sector would need to undertake significant investment to adapt the infrastructure to accommodate use of natural gas as an automotive fuel. Hydrogen fuel cell vehicles have also been the subject of much discussion and research. Reports of a commercially viable hydrogen fuel cell vehicle have been made since 2004, but a real market for the cars has yet to emerge. The major blockage has been the cost of producing hydrogen fuel cells. Fortune magazine estimated in October of 2009, that the Honda Clarity cost $300,000 to produce per car.75 Widespread use of this technology remains far in the future, however, with some experts suggesting it could take more than 10 to 20 years.76
As a nation, we may look forward to technologies and advancements that will improve the future transportation system through transportation planning efforts and technology deployment. The knowledge and aptitude of younger generations' use and application of information and wireless technologies will contribute to developing a more efficient system. Their openness to different modes, concern for the environment, high usage of the Internet and telecommunications for shopping and social networking activities coupled with high unemployment, lower incomes and increasing travel costs may have an effect on the way they will travel in their future years and will be a topic of further study as this project moves forward.
Key Findings:
Information and Communication Technologies
Payment Systems
GPS and ITS
Transportation Efficiency
Booz Allen Hamilton. "Energy Trends: New Hybrids Breaking Out of Niche?" Booz Allen, 2004.
Boston Consulting Group. "Batteries for Electric Cars: Challenges, Opportunities and the Outlook to 2020." Boston Consulting Group, 2010. Accessed online Jan. 10, 2011. <http://www.bcg.com/documents/file36615.pdf>
Black, Lee, Jack Mandelbaum, Indira Grover, and Yousuf Marvi. "The Arrival of 'Cloud Thinking.'" Management Insight Technologies White Paper. November 2010.
Bressler, Jeff. "Generation Y, the Green Car Generation." Autrotropolis.com. Accessed online. Jan 3, 2011. <www.autotropolis.com/wiki/index.php?title=Generation_Y,_the_Green_Car_Generation>
Capgemini. Cars Online 07/08: Responding to Changing Consumer Trends and Buying Behaviour. Accessed online Jan 11, 2011. <http://www.us.capgemini.com/insights-resources/publications/cars->
Capgemini. Cars Online 09/10: Responding to Changing Consumer Trends and Buying Behaviour. Accessed online Jan 11, 2011. <http://www.us.capgemini.com/news-events/press-releases/Capgemini-Cars-online-study/>
Center for Disease Control. "U.S. Teen Birth Rate Hits Record Low in 2009, CDC Report Finds, Total births and fertility rate also down." Center for Disease Control Press Release. CDC National Center for Health Statistics Office of Communication December 21, 2010. Accessed online January, 28, 2011
Changewave Research. Corporate Smart Phones and Tablets - 1Q 2011 Business Spending Outlook, December 1, 2010.
Cisco. "Cisco Study Finds Telecommuting Significantly Increases Employee Productivity, Work-Life Flexibility and Job Satisfaction." Accessed online 12/8/2010. <http://newsroom.cisco.com/dlls/2009/prod_062609.html?print=true>
Choo, Sangho, Particia Mokhrarian, and Ilan Salomon. "Impacts of Home-Based Telecommuting on Vehicle-Miles Traveled: A Nationwide Time Series Analysis." A study prepared for the California Energy Commission (UCD-ITS-RR-02-05), October 2002. <http://www.its.ucdavis.edu/publications/2002/UCD-ITS-RR-02-05.pdf>
Choo, Sangho, Particia Mokhrarian, and Ilan Salomon. "Does Telecommuting Reduce Vehicle Miles Traveled? An Aggregate Time Series Analysis of the US." Transportation 32(1), 2005, 37-64 July 2004. <http://129.3.20.41/eps/em/papers/0505/0505001.pdf>
Contrino, Heather and Nancy McGuckin. "An Exploration of the Internet's Effect on Travel." August 1, 2006.
Copeland, Michael V. "The hydrogen car fights back", Fortune magazine, October 14, 2009.
Crane, Randall. "Is There a Quiet Revolution in Women's Travel?"Journal of the American Planning Association 73 (3), 2007. Deloitte and Touch "A new era: Accelerating toward 2020 — An automotive industry transformed." Deloitte and Touche, 2009
Deloitte Development LLC. "Generation Y: powerhouse of the global economy Restless generation is a challenge — and a huge opportunity — for employers." <http://www.deloitte.com/view/en_US/us/Services/consulting/consulting-services/human-capital/Talent-Consulting-Consultant-Consultants-Human-Capital/article/a90f49642dff0210VgnVCM100000ba42f00aRCRD.htm>
Dieringer Research Group Inc. "WorldatWork Telework Trendlines." Dieringer Research Group Inc., 2009.
Doyle, D., & Taylor, B. "Variation in metropolitan travel behavior by sex and ethnicity." In Travel patterns of people of color: Final report. Columbus, Ohio. Washington, DC: U.S. Department of Transportation, Federal Highway Administration, 2000.Goldberg P. K., "The Effects of the Corporate Average Fuel Efficiency Standards." Journal of Industrial Economics, Vol 46 (4), 1998 (pgs1-33).
Goldin, C., Katz, L., & Kuziemko, I. "The homecoming of American college women: The reversal of the college gender gap." Journal of Economic Perspectives, Vol. 20(4), 2006, pgs 133-156.
Goldberg P. K., "The Effects of the Corporate Average Fuel Efficiency Standards." Journal of Industrial Economics, Vol 46 (4), 1998, pgs1-33.
Gossen, Rachel and Charles L. Purvis, "Activities, Time, and Travel Changes in Women's Travel Time Expenditures, 1990–2000"Greene D.L., J.R. Kahn and R.C. Gibson, "Fuel Economy Rebound Effect for US Households." Energy Journal, Vol 20 (3), 1999 (pgs 1-31).
Greene D.L., J.R. Kahn and R.C. Gibson, "Fuel Economy Rebound Effect for US Households." Energy Journal, Vol 20 (3), 1999, pgs 1-31.
Greed, Clara. " Are we there yet? Women and Transport Revisited" in Gendered Mobilities. Burlington ,VT: Ashgate Publishing, 2008.
Harris Interactive. "Cloud Computing: Final Report." Harris Interactive Public Relations Research. September 24, 2010.
Hybridcars.com, "Profile of Hybrid Drivers." March 31, 2006. Accessed online <http://www.hybridcars.com/hybrid-drivers/profile-of-hybrid-drivers.html>
Jones, Sydney, and Susannah Fox, "Generations Online in 2009 "Pew Internet & American Life Project." January 28, 2009.
Kelley, Debbie. "Human Resource Expert: Prepare now for post-recession market." Colorado Springs Gazette. August 11, 2009. Accessed online: www.gazette.com.
Lenhart, Amanda, Kristen Purcell, Aaron Smith and Kathryn Zickuhr. "Social Media and Mobile Internet Use Among Teens and Young Adults" Pew Research Center's Internet and American Life Project. February 3, 2010 <http://pewinternet.org/Reports/2010/Social-Media-and-Young-Adults.aspx>
McGukin, Nancy and Yukiko Nakamoto. "Differences in Trip Chaining by Men and Women." Research on Women's Issues in Transportation. TRB Conference Proceedings #35. Chicago, Il: November 18-20, 2004.
McGuckin, N., and E. Murakami. "Examining Trip- Chaining Behavior: Comparison of Travel by Men and Women." Transportation Research Record: Journal of the Transportation Research Board, No. 1693, TRB, National Research Council, Washington, D.C., 1999, (pp. 79–85). <npts.ornl.gov/npts/1995/Doc/chain2.pdf>
Meeker, Mary. Internet Trends 2010. April 12, 2010. Morgan Stanley Research. <http://conversations.marketing-partners.com/2010/06/internet-trends-2010-by-morgan-stanley%E2%80%99s-mary-meeker/>
Miller, Virginia. "Telling the Story of Public Transportation's Positive Environmental Impact" American Public Transportation Association Press Release. April 21, 2010.
Mokhtarian P L, "A Typology of Relationships between Telecommunications and Transportation" Transportation Research Part a-Policy and Practice. Vol. 24, 1990 (pgs. 231-242)
Mokhtarian P L, "A conceptual analysis of the transportation impacts of B2C e-commerce" Transportation. Vol. 31, 2004 (pgs. 257-284).
Mokhtarian P L, Circella G, "The role of social factors in store and internet purchase frequencies of Clothing/Shoes", in workshop proceedings of: The international workshop on Frontiers in Transportation: Social Interactions. Amsterdam, Netherlands: 2007.
Pendyala R M, K G Goulias, and R Kitamura. "Impact of Telecommuting on Spatial and Temporal Patterns of Household Travel" Transportation. Vol. 18, 1991 (pgs 383-409).
Pisarski, Alan, Commuting in America III: The Third National Report on Commuting Patterns and Trends, Transportation Research Board, 2006, pg. 19Price Waterhouse Cooper. "Capitalizing on Change: The Electric Future of the Automotive Industry." Price Waterhouse Coopers Global Automotive Perspectives Services, 2009.
Salomon, I. "Telecommunications and Travel Relationships - a Review" Transportation Research Part a-Policy and Practice. Vol. 20, 1986 (pgs 223-238).
Small, Kenneth A. and Kurt Van Dender. "Fuel Efficiency and Motor Vehicle Travel: The Declining Rebound Effect." Energy Journal, vol. 28, no. 1 (2007), pp. 25-51.
Smith, Aaron. "Home Broadband 2010." Pew Research Center's Internet and American Life Project. August 11, 2010. <http://pewinternet.org/Reports/2010/Home-Broadband-2010.aspx>
Tonn B E, Hemrick A, "Impacts of the Use of E-Mail and the Internet on Personal Trip-Making Behavior" Social Science Computer Review. Vol 22, 2004 (pgs 270-280).
US Department of Transportation. FHWA. "NPTS Brief: Mobility and the Melting Pot". January 2006. www.nhts.ornl.gov Valdez-Dapena, Peter. "All that hype won't sell electric cars." CNN Money. October 27, 2010. Accessed online Jan 11, 2011. <http://money.cnn.com/2010/10/27/autos/jdpa_hybrid_electric_study/index.htm>
Wachs, M. "Men, women, and wheels: The historical basis of sex differences in travel patterns." Transportation Research Record, Vol. 1135, 1987 (pgs 10-16). And Wachs, M. "Men, women, and urban travel: The persistence of separate spheres." In M. Wachs & M. Crawford (Eds.), The car and the city: The automobile, the built environment, and daily urban life. Ann Arbor, MI: University of Michigan Press, 1991.Wald, Matthew, "U.S. Drops Research Into Fuel Cells for Cars," New York Times, May 7, 2009
Walls, Margaret and Elena Safiro. "A review of the literature on telecommuting and its implication for vehicle travel and emissions." Resources for the Future. Discussion Paper 04-44. December 2004.
Wilson R, Krizek K, and S. Handy. "Trends in Out-of-Home and At-Home Activities: Evidence from Repeat Cross-Sectional Surveys" Transportation Research Record: Journal of the Transportation Research Board. Vol. 2014, 2007 (pgs 76-84).
1 Surveys conducted April 29-May 30, 2010. N=2,252, 18 and older, including 744 cell phone interviews. Interviews were conducted in English. Margin of error is +/- 2 percent. Source: "Home Broadband 2010" Pew Internet and American Life Project Surveys, 2000-2010. Available at: http://pewinternet.org/Reports/2010/Home-Broadband-2010.aspx as of 27 July, 2011.
2 The term "telecommuting" was first coined by Jack Niles in the 1970s in response to new technologies and the rising costs of gasoline due to the Middle East Oil Embargoes. Source: Joice, Wendell. History of Telework. Telework Network. Available at: http://www.teleworknetwork.com/pdfs/63.pdf as of 27 July, 2011..
3 WorldatWork Telework Trendlines 2009, The Dieringer Research Group Inc. Available at: http://www.worldatwork.org/waw/adimLink?id=31115 as of 27 July, 2011.
4 "Employee telecommuter" is a full- or part-time employee who works remotely at least one day per month. A "contract telecommuter" is a self-employed individual who works remotely at least one day per month. Data for 2007 are estimates only; the survey was not conducted in 2007. Source: WorldatWork Telework Trendlines 2009, data from The Dieringer Research Group Inc. Available at: http://www.worldatwork.org/waw/adimLink?id=31115 as of 27 July, 2011.
5 Interviews with 1,002 U.S. adults 18 years and older were conducted using computer-generated random-digit telephone lists. The data were weighted to match current population norms for U.S. adults using four weighting factors: age, gender, level of education and U.S. Census region. Estimates are reliable at the 95-percent confidence interval to within +/- 3.1 percent. Source: WorldatWork Telework Trendlines 2009, data from The Dieringer Research Group Inc Available at: http://www.worldatwork.org/waw/adimLink?id=31115 as of 27 July, 2011.
6 Kelley, Debbie. "Human Resource Expert: Prepare now for post-recession market." Colorado Springs Gazette. August 11, 2009. Accessed online: www.gazette.com
7 Deloitte Development LLC. "Generation Y: powerhouse of the global economy Restless generation is a challenge–and a huge opportunity–for employers." <http://www.deloitte.com/view/en_US/us/Services/consulting/consulting-services/human-capital/Talent-Consulting-Consultant-Consultants-Human-Capital/article/a90f49642dff0210VgnVCM100000ba42f00aRCRD.htm>
8 Generally requires a minimum bandwidth of. 4 Mbps, but 14 Mbps or more may be needed for large, theatre-like installations. Source: "Maximizing the value of telepresence." Frost and Sullivan White Paper. Available at http://www.tandberg.com/collateral/Frost%20and%20Sullivan%20-%20Maximizing%20the%20Value%20of%20Telepresence.pdf as of 27 July, 2011.
9 Mokhtarian, Patricia. "A Synthetic Approach to Estimating the Impacts of Telecommuting on Travel." Urban Studies. Vol. 35 Is. 2, Feb 1998 pps. 215-241. Available at: http://tmip.fhwa.dot.gov/resources/clearinghouse/docs/udes/mokhtarian.pdf as of 27 July, 2011.
10 Walls, Margaret and Elena Safiro. "A review of the literature on telecommuting and its implication for vehicle travel and emissions." Resources for the Future. Discussion Paper 04-44. December 2004.
11 Choo, Sangho, Particia Mokhrarian, and Ilan Salomon. "Does Telecommuting Reduce Vehicle Miles Traveled? An Aggregate Time Series Analysis of the US." Transportation 32(1), 2005, 37-64 July 2004. Available at: http://129.3.20.41/eps/em/papers/0505/0505001.pdf, 27 July, 2011.
12 ibid
13 Cisco. "Cisco Study Finds Telecommuting Significantly Increases Employee Productivity, Work-Life Flexibility and Job Satisfaction." Accessed online 12/8/2010. <http://newsroom.cisco.com/dlls/2009/prod_062609.html?print=true>
14 The Nielsen Company conducted a survey in March 2010 and polled over 27,000 Internet* users in 55 markets from Asia Pacific, Europe, Middle East, North America and South America. Source: Nielson Company. "Global Trends in Online Shopping A Nielsen Global Consumer Report." The Nielson Company, June 2010. Available online at: http://hk.nielsen.com/documents/Q12010OnlineShoppingTrendsReport.pdf as of 27 July 2011.
15 See Choo et al., 2007; Mokhtarian, 1990; Mokhtarian, 2004; Pendyala et al., 1991; and Salomon, 1986
16 See See Sulaiman, A; Ng, J and Mohezar, S. E-"Ticketing as a new way of buying tickets: Malaysian perceptions", Journal of Social Science, Vol. 17, No. 2: 149-157, 2008
17 Jones, Sydney, and Susannah Fox, "Generations Online in 2009 "Pew Internet & American Life Project." January 28, 2009
18 This low rate among teens may be attributable to the fact that many in this age group are not financially independent, and do not make their own spending choices for most of their shopping items.
19 It is important to note that this analysis does not control for income level or a number of other relevant factors which might be strongly related to time spent traveling to shop, and are also likely to be highly correlated with access to internet.
20 Facebook alone topped 500 million active uses in July of 2010. Source: Facebook. "Timeline." Facebook Company Information. Available at: http://www.facebook.com/press/info.php?timeline as of 27 July, 2011.
21 Sample size= 2,252 adults 18 and older. Source: Hampton, Keith, Lauren Sessions Goulet, Lee Rainie and Kristen Purcell. "Social Networking Sites and our Lives: Appendices and Methodology." June 16, 2011. Available online: http://pewinternet.org/Reports/2011/Technology-and-social-networks/Appendices/Methodology.aspx 27 July, 2011
22 As reported in Meeker, Mary. Internet Trends 2010. April 12, 2010. Morgan Stanley Research. Accessed online 1/3/2010. <http://www.morganstanley.com/institutional/techresearch/pdfs/Internet_Trends_041210.pdf>
23 Meeker, Mary. Internet Trends 2010. April 12, 2010. Morgan Stanley Research. Accessed online 1/3/2010. <http://www.morganstanley.com/institutional/techresearch/pdfs/Internet_Trends_041210.pdf>
24 Changewave Research. Corporate Smart Phones and Tablets - 1Q 2011 Business Spending Outlook, December 1, 2010.
25 Harris Interactive. "Cloud Computing: Final Report." Harris Interactive Public Relations Research. September 24, 2010. Based on an online survey of 210 IT managers/decision makers working in organizations of 1,000 employees or more. Sample was weighted to be representative of U.S. businesses with 1,000 or more employees.
26 Data from Nielson Consumer Value Metrics panel in Q3 2010. Results collected from the analysis of 60,000 phone bills in the U.S.
27 Facebook. "Facebook Statistics." Accessed online Jan. 7, 2011. And ComScore. "Mobile Facebook, Twitter Growth Explodes." Accessed online January 6, 2011. <http://www.marketingcharts.com/interactive/mobile-facebook-twitter-growth-explodes-12179/>
28 ComScore. "Mobile Facebook, Twitter Growth Explodes." Accessed online January 6, 2011. <http://www.marketingcharts.com/interactive/mobile-facebook-twitter-growth-explodes-12179/>
29 Ibid.
30 Sample size= 2,252 adults 18 and older. Source: Hampton, Keith, Lauren Sessions Goulet, Lee Rainie and Kristen Purcell. "Social Networking Sites and our Lives: Appendices and Methodology." June 16, 2011. Available online: http://pewinternet.org/Reports/2011/Technology-and-social-networks/Appendices/Methodology.aspx 27 July, 2011
31 Worchester Polytechnic Institute. "Geolocation, Next Phase of the Social Media Revolution, Focus of June 14 Workshop at WPI." June 8, 2010. Accessed online Jan. 6, 2011. <http://www.wpi.edu/news/20090/wireless2010.html>
32Holguin-Veras, Jose, Kaan Ozbat, and Allison de Cerreño « Evaluation Study of Port Authority of New York and New Jersey's Time of Day Pricing." March 2005. NJ Department of Transportation. FHWA/NJ-2005-005.
33 Multisystems, Inc. "Fare Policies, Structures and Technologies: Update". 2003. TCRP Report 94. http://onlinepubs.trb.org/onlinepubs/tcrp/tcrp_rpt_94.pdf
34 ibid
35 Hiroyuki, Iseki. "Survey on Status of Knowledge and Interest of Smartcard Fare Collection Systems among US Transit Agencies".2006. http://www.path.berkley.edu/PATH/Publications/PDF/PRR/2006/PRR-2006-12
36 Transport for London. "Transport for London's Oyster Card". 2007. http://www.tfl.gov.uk/tickets/oysteronline2732.aspx
37 Source: "Demographic Ridership Data." NYMTA data as reported by www. Streetblog.org, October 2009. Available at: http://www.streetsblog.org/2010/10/20/who-buys-which-type-of-metrocard/ as of 27 July, 2011.
38 This standard defines the data format used on Proximity Integrated Circuit Cards (PICC). This part provides a consistent and uniform method for storing, retrieving and updating data from contactless fare media used in transit applications. It also references related international standards which define the physical, electrical and communications aspects of PICCs. Source: APTA. "Universal Transit Fare System Task Force." APTA Standards Development Program Website. Available at: http://www.aptastandards.com/StandardsPrograms/UTFSStandards/TaskForce/tabid/82/language/en-US/Default.aspx, as of 27 July 2011.
39 For more information see: First Data Government and Transit Task Force. "Transit Payment Systems: A Case for Open Payments". 2010. (http://www.fundxpress.com/downloads/thought-leadership/transit-payment-systems_wp.pdf) and
Wronski Richard. "RTA looks into potential of riders using cell phones instead of tickets or transit cards". May 2009. http://articles.chicagotribune.com/2009-05-26/news/0905250222_1_cell-phones-debit-cards-fare
40First Data Government and Transit Task Force. "Transit Payment Systems: A Case for Open Payments". 2010. (http://www.fundxpress.com/downloads/thought-leadership/transit-payment-systems_wp.pdf)
41 IE Market Research. "3Q. 2010. US GPS Navigation and Location Based Services Forecast." IEMR, July 1, 2010.
42 Schofer, Joseph, Frank Koppel, and William Charlton. "Perspectives on Driver Preferences for Dynamic Route Guidance Systems." Transportation Research Record. Vol. 1588, TRB, 1997 (pgs 26-31).
43 Yamashita, Tomohisa, Kiyoshi Izumi and Koichi Kurumatani. "Analysis of the Effect of Route Information Sharing on Reduction of Traffic Congestion." In Application of Agent Technology in Traffic and Transportation. Whitestein Series in Software Agent Technologies and Autonomic Computing, 2005.
44 "TomTom Survey Reveal Interesting Facts about Drivers." Accessed online December 22, 2010. <http://gps-cartracking.com/tomtom-survey-reveals-interesting-facts-about-drivers>
45 Martin, Scott. "New Study Reveals More about Map and GPS Habits." GPS Lodge. August 16, 2006. Accessed online Dec. 22, 2010. <http://www.gpslodge.com/archives/006968.php>
46 Adapted from: United we Ride. "Intelligent Transportation System." Coordinating Council on Access and Mobility (CCAM). Available at: www.unitedweride.gov/MMS-ITS-3-18-05.doc as of 27 July 2011.
47 ibid
48 ibid
49 Adapted from: United we Ride. "Intelligent Transportation System." Coordinating Council on Access and Mobility (CCAM). Available at: www.unitedweride.gov/MMS-ITS-3-18-05.doc as of 27 July 2011
50 Yannan, Tuo. "GPS-enabled phones the next 'must have'"China Daily. Jan. 14, 2011. Accessed online Jan 17, 2011 <http://www.chinadaily.com.cn/business/2011-01/14/content_11855043.htm>
51 IBM Group. Future Focus: Travel. White Paper June 2009. https://www.304.ibm.com/businesscenter/cpe/download0/177501/IBM_White_Paper_3.pdf
52 IBM Group. Future Focus: Travel. White Paper June 2009. https://www.304.ibm.com/businesscenter/cpe/download0/177501/IBM_White_Paper_3.pdf
53 Golob, Thomas. "Impacts of Information Technology on persona travel and commercial vehicle operations: research challenges and opportunities." TRB. June 2000. http://its.ee.tsinghua.edu.cn/literatures/_Literature_incoming/Traffic%20Signal%20Control/Thomas%20F.%20Golob_TRC_Impacts%20of%20information%20technology%20on%20personal%20travel%20and%20commercial%20vehicle%20operations--%20research%20challenges%20and%20opportunities.pdf
54 See Deloitte and Touch "A new era: Accelerating toward 2020 — An automotive industry transformed." Deloitte and Touche, 2009.; Capgemini. Cars Online 07/08: Responding to Changing Consumer Trends and Buying Behaviour. Accessed online Jan 11, 2011. <http://www.us.capgemini.com/insights-resources/publications/cars-online-07-08/>
55 See Deloitte and Touch "A new era: Accelerating toward 2020 — An automotive industry transformed." Deloitte and Touche, 2009.;
56 Capgemini. Cars Online 09/10: Responding to Changing Consumer Trends and Buying Behaviour. Accessed online Jan 11, 2011. <http://www.us.capgemini.com/news-events/press-releases/Capgemini-Cars-online-study/>
57 For a detailed history of hybrid vehicles see: http://www.hybridcars.com/history/history-of-hybrid-vehicles.html
58 For more see Booz Allen Hamilton. "Energy Trends: New Hybrids Breaking Out of Niche?" Booz Allen, 2004.
59 In June and July of 2008 an average gallon of gas in the US cost about $4.10 (inclusive of tax), by January 2009, the average US gas price had fallen to $1.84. Over the course of 2011 prices have again exceeded $3.00, reaching about $3.70 a gallon as of July 2011. Source: US Energy Information Administration. "Monthly U.S. All Grade All Formulation Retail Gasoline Prices." Release date 25 July, 2011. Available by query at: http://www.eia.gov/petroleum/data.cfm as of 28 July 2011)
60 Miller, Virginia. "Telling the Story of Public Transportation's Positive Environmental Impact" American Public Transportation Association Press Release. April 21, 2010.
61 Sample size= 1,546 adults nationwide
62 Goldberg 1998, Greene, Kahn, and Gibson (1999), Small and Dender (2007)
63 Sample size= 1,030 adults nationwide. MoE ± 3.
64 Sample size = 2,465, statewide representative sample of California.
65 Survey of 4,000 households in the Sacramento California metro area, using a two step proportional stratified random sample. Source: Flamm, Bradley. "Environmental Knowledge, Environmental Attitudes, and Vehicle Ownership and Use." A presentation to the TRB Annual Meeting, January 23, 2007.
66 Results of a mail-back questionnaire survey and segmentation of 666 visitors to National Trust properties in the northwest of the UK. Source: Anable, Jillian." 'Complacent Car Addicts' or 'Aspiring Environmentalists'? Identifying travel behaviour segments using attitude theory." Transport Policy. Volume 12, 2005, pgs 65 — 78.
67 As cited by Hybridcars.com, "Profile of Hybrid Drivers." March 31, 2006. Accessed online <http://www.hybridcars.com/hybrid-drivers/profile-of-hybrid-drivers.html>
68 Bressler, Jeff. "Generation Y, the Green Car Generation." Autotropolis.com Buying Review. Accessed online Jan 3, 2011. <http://www.autotropolis.com/wiki/index.php?title=Generation_Y%2C_the_Green_Car_Generation>
69 According to Yahoo autos, Toyota and GM expect to introduce a hydrogen fuel cell car in 2015
70 Valdez-Dapena, Peter. "All that hype won't sell electric cars." CNN Money. October 27, 2010. Accessed online Jan 11, 2011. <http://money.cnn.com/2010/10/27/autos/jdpa_hybrid_electric_study/index.htm>
71 Deloitte, "A new era Accelerating toward 2020 — An automotive industry transformed," 2010
72 Price Waterhouse Cooper. "Capitalizing on Change: The Electric Future of the Automotive Industry." Price Waterhouse Coopers Global Automotive Perspectives Services, 2009.
73 Boston Consulting Group, 2010 .Accessed online Jan. 11, 2011. <http://www.bcg.com/documents/file36615.pdf>
74 See www.fueleconomy.gov, a site of the US DOE and EPA
75 Copeland, Michael V. "The hydrogen car fights back", Fortune magazine, October 14, 2009.
76 Statement by U.S. Secretary of Energy Stephen Chu on May 2009 as cited in Wald, Matthew, "U.S. Drops Research Into Fuel Cells for Cars," New York Times, May 7, 2009. <www.nytimes.com/2009/05/08/science/earth/08energy.html, retrieved 9 May 2009>