Changes in truck sizes and weights impact the relative costs of utilizing different truck configurations and modal choice between truck and rail. These cost changes translate into changes in mode choice, changes in shipper costs and changes in the distribution of freight to truck configurations. The changes in the distribution of freight to truck configurations impacts truck vehicle miles traveled (VMT) and the weight distribution of that VMT. The shifts in freight between truck configurations and from rail to truck directly impact shipper costs, highway pavements, safety, energy consumption, air quality, and noise levels.
The analytical approach used in the CTS&W Study is essentially unchanged but has been updated to include the newest data sources and expanded modeling of over 1 million truck shipments and explicit modeling of existing LCV shipments. Similar to the CTS&W Study's analysis the data is examined with explicit user-controlled assumptions concerning the mode and configuration costs. The discussion in this chapter focuses on the differences between the current analysis and the CTS&W Study's analysis. The reader is referenced back to Chapter IV of the CTS&W Study for a more general discussion of truck and rail analysis.
The analysis year for this scenario is 2010 and the base year is 2000. Using the methodology developed for the Department of Transportation's (DOT's) 1997 Federal Highway Cost Allocation (HCA) Study, year 2000 VMT were developed for the study vehicles disaggregated by weight group, highway functional class and State. The base year data for the rail car mile traffic comes from the Surface Transportation Board's 2000 Waybill Sample.
The 2000 VMT and car mile estimates are forecast to 2010 using commodity-by-commodity demand based forecasting. The forecasts were developed by Global Insight (formerly DRI/WEFA) using their U.S. macroeconomic model. This improves upon the single percentage truck and rail growth rates that were used in the CTS&W Study.
Truck Analysis
For purposes of analysis truck traffic is divided into short-haul, long-haul and triples. The short-haul truck analysis focuses on combination trucks that operate less than 200 miles, on a typical haul. In the 13 scenario States this is primarily resource and construction hauls. Operations in four States that currently have double-trailer combinations operating at the scenario's weight limits were used to develop proportional weight distributions and utilization rates for the 9 States that would experience an expansion of their size and weight rules for double-trailer combinations.
The triple-trailer analysis similarly developed weight distributions and utilization rates for the 3 States that currently do not allow triple-trailer operations. Triple-trailer combinations are primarily operated by less-than-truckload carriers who use them to facilitate the movement of small packages between and among their terminals.
Long-haul truck analysis explicitly accounts for changes in transportation costs and the impact of expanded roadway networks. The analysis used the Intermodal Transportation and Inventory Cost Model (ITIC) developed for the CTS&W Study and further discussed in Chapter IV of that study. This analysis significantly updates the truck database by using the Freight Analytical Framework (FAF) database. The FAF data provides truck-freight-tonnage flows by commodity type at the county level of detail. FAF freight volumes are assigned to cargo body types using commodity and vehicle data from the 1997 Vehicle Inventory and Use Survey (VIUS). The assignment of truck tonnage totals to individual truck movements and configurations is estimated from the application of market freight-rate data to the truck flows routed over the available highway networks. The traffic is assigned to the configuration with the lowest cost as determined by the load size, which is based on commodity density (pounds per cubic foot) and market rates. The configuration's size and weight limit was set to the lowest maximum size and weight allowed in the States traveled in-route from origin to destination. Figure III-1 describes the development of motor carrier origination-destination specific market rates that used Signpost Solutions' North American Truckload Rate Index.
|
Rail Analysis
The rail analysis, both intermodal and carload, followed the methodology used in the CTS&W Study. The data was updated to the 2000 Carload Waybill Sample and movements that did not travel within or through the 13 analyzed States were excluded.
A change in truck size and weight regulations will alter a shipper's logistic costs. "Logistic cost" includes the whole cost of receiving raw inputs and shipping final outputs. Transportation and inventory costs are two of the largest components of a shipper's logistic costs. This section updates transportation and inventory totals to 2000; Chapter XII of the CTS&W Study contains a more detailed explanation of the trade-off between transportation and inventory costs.
Transportation cost is the cost of moving a shipment from its origin to its destination. In 2000 rail shippers paid $36 billion in transportation expenses and shippers using commercial trucks paid $481 billion of which $158 billion was intercity shipments (ENO Foundation). Total logistics costs for all modes, including inventory, administration and carrying costs topped $1.006 trillion or 10.1 percent of year 2000 nominal gross domestic product (GDP).
Changes in truck size and weight also affect inventory costs. Inventory costs include warehousing, depreciation, taxes obsolescence, insurance, ordering and interest expenses. Total national inventory carrying cost was estimated to be $1.485 trillion in 2000 (Cass Logistics).
The impact on shipper transportation costs is derived from the ITIC model. As was true with the CTS&W Study, estimation of the aggregate changes in inventory cost associated with the illustrative scenario could not be completed within the scope of this study. Shipper costs for truck transportation are computed by multiplying the VMT for each shipment by that shipment's transportation cost, which depends upon the configuration, gross vehicle weight, and the market rate for that origination-destination pair.
Rail shipper transportation cost is computed from revenues reported in the Surface Transportation Board's (STB) Carload Waybill Sample, a sample of rail freight movements. The Waybill Sample includes expansion factors to allow estimation of total impacts. The cost of the truck alternative movement of rail traffic traversing the 13 study States is generated for base case and scenario truck configurations to compare with the cost of the move by rail. Where the scenario's truck cost is below rail variable cost as reported in the Waybill, the traffic diverts to truck. Where the scenario truck cost is above rail variable cost, but below rail revenue, rail retains the traffic by lowering the rate to match the truck cost. As a result of the rate reductions made by rail to retain the freight, some shippers who remain on rail benefit from lower rates as well as those shippers who switch from rail to truck.
The Western Uniformity Scenario is analyzed with two alternative maximum lengths for the longest double trailers. The two cases both include shorter double-trailer RMDs and triple-trailer combinations but the low-cube case constrains the longest double to 95-feet combined trailer length (this allows up to a twin 45-foot TPD), where as the high-cube case allows the longest double to reach 101-feet combined trailer length (this allows up to a twin 48-foot TPD). The analysis assumes that the regulations governing the sizes and weights analyzed have been in place long enough to be fully adopted by industry. Figure III-2 outlines assumptions regarding how freight currently traveling in the affected configurations would respond to the new LCVs.
| Original Truck Configuration | Likely Reaction to the Scenario |
|---|---|
| Five-axle tractor semitrailer | Change to Rocky Mountain Double |
| Change to Turnpike Double | |
| Five- or Six-axle double-trailer combination (LTL freight) | Change to triple-trailer combination (LTL freight) |
| Rocky-Mountain (or short) double-trailer combination | More payload |
| Turnpike (or long) double-trailer combination | More payload |
| Triple-trailer combination | No change |
As Table III-1 shows, total scenario VMT declines from base case levels for all of the highway classifications. The share of VMT on non-Interstate declines in each of the scenario cases as well. The largest decline in non-Interstate truck VMT occurs in the High Cube Case due to the utilization of the longer TPD that is restricted to the Interstate System.
| Functional Class | Base Case VMT | Low Cube Case VMT | High Cube Case VMT |
|---|---|---|---|
| Rural | |||
| Interstate | 8,329 | 7,850 | 7,791 |
| Other Principal Arterial | 3,457 | 2,810 | 1,942 |
| Other | 3,127 | 3,098 | 1,906 |
| Urban | |||
| Interstate | 2,001 | 1,631 | 1,360 |
| Freeways/Expressways | 316 | 179 | 107 |
| Other | 1,592 | 1,460 | 922 |
| Rural and Urban | |||
| Interstate | 10,330 | 9,482 | 9,151 |
| Other | 8,493 | 7,547 | 4,877 |
| Total | 18,823 | 17,029 | 14,028 |
The extent of LCV use will depend on the types of commodities moving within and through the region, as well as whether the traffic originates and/or terminates within the region. Tables III-2 and III-4 show the LCV share of VMT for specialized freight, dry freight, and in total for the Base Case and the Western Uniformity Scenario Cases. Intra-regional traffic has the largest penetration of LCVs in the Base Case and both of the scenario cases. This is expected, as these traffic flows do not have the costly operational disadvantage of separating the configuration for travel outside the region.
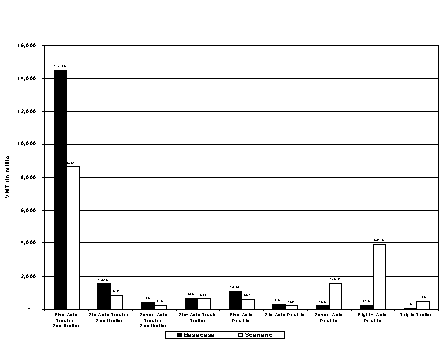
Table III-3 and Figure III-3 summarize the VMT analysis results for the low-cube case. In this case the 2010 VMT within the analyzed region10 declines 9.5 percent. It is interesting to examine the impact of the scenario on truck traffic that flows within the 13 analyzed States, through the analyzed States (either across or with an origination or destination with in the analyzed States) and on rail traffic. Within the study region 69 percent of the base case VMT is impacted, 65 percent by shifts from tractor-semitrailer configurations to LCVs and 4 percent by increased weight on existing LCVs. Only 8 percent of the truck travel across the region is impacted (these are moves that have an origination and destination outside the 13 analyzed States). Table III-2 indicates that through-traffic VMT in the 13 States would actually increase from the use of more productive LCVs. This is because the best routing for much of the through-traffic between the Southeast and California in the base case is across Texas, New Mexico and Arizona. With the introduction of more productive LCVs in the west, the scenario routing shifts north to take advantage of the LCV network.11
Compared to the "Longer Combination Vehicles Nationwide Scenario" in the CTS&W Study, the impact of the regional permit system is very small. As a percent of the rail traffic moving within or through the 13 States, only 0.22 percent of the rail carload miles divert and only 0.07 percent of the intermodal rail miles divert to truck. The restriction of the 45-foot trailers on the turnpike double and the limited 13 State involvement coupled together create a small impact on the railroads. In contrast, the LCVs Nationwide Scenario predicted 9 percent of rail carload miles and 31 percent of rail intermodal miles diverted.
| Commodity Group | Flow | VMT By Flow and Commodity Group | |||
|---|---|---|---|---|---|
| Base Case | Low Cube | ||||
| Total VMT (millions) | Percent in LCVs | Total VMT (millions) | Percent in LCVs | ||
| Bulk, Tank, Flatbed (Specialized Freight) | Intra-Regional | 2,101 | 12.7% | 1,713 | 88.8% |
| Inbound | 1,098 | 0.8% | 958 | 40.5% | |
| Outbound | 2,285 | 0.8% | 2,150 | 23.8% | |
| Through | 887 | 0.0% | 895 | 7.1% | |
| Total | 6,370 | 4.6% | 5,716 | 43.5% | |
| Dryvan, Reefer (General Freight) | Intra-Regional | 2,406 | 6.2% | 2,063 | 53.9% |
| Inbound | 2,700 | 0.1% | 2,382 | 35.7% | |
| Outbound | 4,589 | 0.0% | 4,041 | 34.1% | |
| Through | 2,758 | 0.0% | 2,827 | 5.0% | |
| Total | 12,452 | 1.2% | 11,313 | 30.8% | |
| All Traffic | Intra-Regional | 4,506 | 9.2% | 3,775 | 69.7% |
| Inbound | 3,798 | 0.3% | 3,341 | 37.1% | |
| Outbound | 6,874 | 0.3% | 6,191 | 30.5% | |
| Through | 3,645 | 0.0% | 3,722 | 5.5% | |
| Total | 18,823 | 2.4% | 17,029 | 35.0% | |
| Scenario | Vehicle-Miles-of-Travel (in millions) |
|---|---|
| Base Case | 18,823 |
| Low-Cube Case | 17,029 |
| Percent Change | -9.5% |
Figure III-3
Impact of Western Uniformity Scenario on VMT by Different Vehicles,
Low-Cube Case

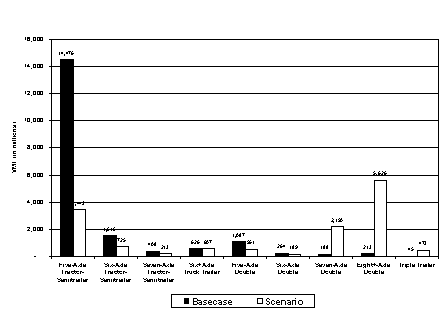
Table III-5 and Figure III-4 summarize the analysis results for the high-cube case. The longer turnpike double (up to twin 48-foot trailers) reduces VMT 25.5 percent among the 13 analyzed States. As with the low-cube case, it is interesting to examine the impact of the scenario on truck traffic that flows within the 13 analyzed States, through the analyzed States (either across or with an origination or destination with in the analyzed States) and on rail traffic. Within the study region 76 percent of the base case VMT is impacted, 71 percent by shifts from tractor-semitrailer configurations to LCVs and 5 percent by increased weight on existing LCVs. As compared to the low-cube case, there is a much larger impact on the through-traffic. In the high-cube case 60 percent of the through-traffic tractor-semitrailers divert to LCVs. These truck movements would originate as two single 48-foot tractor-semitrailers but would join as a twin 48-foot TPD for the move across the region and then split apart for delivery outside the region. Such operations could yield substantial benefits for logistics management and large fleet operations. Small single truck owner-operators could be at a competitive disadvantage.
Table III-4 shows that the different types of truck traffic are not impacted equally. The intra-regional traffic has the greatest cost per ton-mile gains since there is no penalty for staging trailers for moves outside the region. The Table also shows that the heavier bulk, tank and flatbed commodities are more likely to divert since they will experience strong gains in the amount of freight each truck can accept. Comparing Tables III-2 and III-4 shows that the longer trailers allowed in the High-Cube Case translate into more diversion for all traffic segments. The High-Cube Case exhibits a substantial jump in the inbound, outbound and through traffic that diverts when compared to the Low-Cube Case. This is because the "penalty" of delivering the trailers outside the 13 State region is less when operating 48-foot trailers than for 45-foot trailers.
As a percent of the rail traffic moving within or through the 13 States, only 0.24 percent of the rail carload miles divert and only 0.10 percent of the intermodal rail miles divert to truck. The restriction of the 48-foot trailers on the turnpike double and the limited 13 State involvement coupled together create a small impact on the railroads.
| Commodity Group | Flow | VMT By Flow and Commodity Group | |||
|---|---|---|---|---|---|
| Base Case | Low Cube | ||||
| Total VMT (millions) | Percent in LCVs | Total VMT (millions) | Percent in LCVs | ||
| Bulk, Tank, Flatbed (Specialized Freight) | Intra-Regional | 2,101 | 12.7% | 1,566 | 96.1% |
| Inbound | 1,098 | 0.8% | 827 | 56.9% | |
| Outbound | 2,285 | 0.8% | 1,804 | 41.5% | |
| Through | 887 | 0.0% | 664 | 45.8% | |
| Total | 6,370 | 4.6% | 4,861 | 62.3% | |
| Dryvan, Reefer (General Freight) | Intra-Regional | 2,406 | 6.2% | 1,853 | 62.7% |
| Inbound | 2,700 | 0.1% | 1,966 | 58.8% | |
| Outbound | 4,589 | 0.0% | 3,302 | 58.0% | |
| Through | 2,758 | 0.0% | 2,047 | 50.3% | |
| Total | 12,452 | 1.2% | 9,167 | 57.4% | |
| All Traffic | Intra-Regional | 4,506 | 9.2% | 3,419 | 78.0% |
| Inbound | 3,798 | 0.3% | 2,792 | 58.3% | |
| Outbound | 6,874 | 0.3% | 5,105 | 52.1% | |
| Through | 3,645 | 0.0% | 2,711 | 49.2% | |
| Total | 18,823 | 2.4% | 14,028 | 59.1% | |
| Scenario | Vehicle-Miles-of-Travel (in millions) |
|---|---|
| Base Case | 18,823 |
| Low-Cube Case | 14,028 |
| Percent Change | -25.5% |
Figure III-4
Impact of Western Uniformity Scenario on VMT by Different Vehicles,
High-Cube Case

Table III-6 shows that shippers who use the LCVs at heavier weights and sizes experience transportation savings. Truck shippers who change configurations would save $1,190 million in the low-cube case and $2,036 million in the high-cube case. Rail shippers who change from rail to truck save $2.3 million in the low-cube case and $3.2 million in the high-cube case. Rail shippers who continue to use the railroad obtain competitive rate reductions of $26 million in the low-cube case and $48 million in the high-cube case. The impact of the lower rail revenues is presented in Chapter X.
| Western Uniformity Scenario | ||
|---|---|---|
| Low-Cube Case | High-Cube Case | |
| Truck-to-Truck | ||
| Dollars (millions) | $1,190 | $2,036 |
| Percent Change | 2.3% | 3.9% |
| Rail-to-Truck | ||
| Dollars (millions) | $2.3 | $3.2 |
| Percent Change | 0.01% | 0.01% |
| Rail Discount | ||
| Dollars (millions) | $26 | $48 |
| Percent Change | 0.06% | 0.11% |