This chapter focuses on the interaction of the Western Uniformity Scenario's truck configurations with roadway ramps, interchanges and intersections. The Scenario's longer combination vehicles (LCVs) are potentially less maneuverable than vehicles currently in use.
The addition of longer LCVs on more roadways in the Scenario would require intersection and interchange improvements to allow for the safe operation of these vehicles. Also in the Western Uniformity Scenario TPD and triples would be restricted to a limited network of highways. These trucks would need to be assembled and disassembled at staging areas adjacent to the highway. This chapter includes a discussion of current staging area practices in the Western States and provisions for staging areas under the Scenario.
This section provides an overview of the relationship between vehicle turning characteristics ("offtracking") and roadway geometry. A more detailed discussion is provided in the CTS&W Study Volume II, Chapter VI and Volume III, Chapter VII.
Offtracking is said to occur when a vehicle makes a turn and it rear wheels do not follow the same path as its front wheels. The magnitude of this generally increases with the spacing between the axles of the vehicle and decreases for larger radius turns. Offtracking is considered in determining the extent to which roadway geometrics would need upgrading to accommodate less maneuverable LCVs. There are two types of offtracking: low-speed and high-speed.
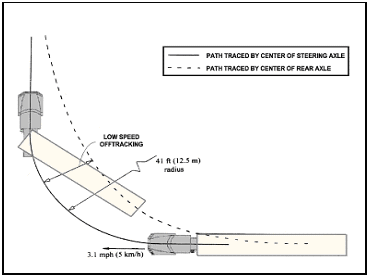
Low-Speed Offtracking occurs when a combination vehicle makes a low-speed turn - for example a 90-degree turn at an intersection - and the wheels of the rearmost trailer axle follow a path several feet inside the path of the tractor steering axle. Figure VI-1 illustrates low-speed offtracking in a 90-degree turn for a tractor-semitrailer. Excessive low-speed offtracking makes it necessary for the driver to swing wide into adjacent lanes when making a turn to avoid climbing inside curbs, striking curbside fixed objects or other vehicles. On an exit ramp excessive offtracking can result in the truck tracking inward onto the shoulder or up over inside curbs. For single trailer combinations, this performance attribute is affected primarily by the distance of the tractor kingpin18 to the center of the trailer rear axle or axle group. For multitrailer combinations the effective wheelbase(s) of all the trailers in the combination, along with the tracking characteristics of the converter dollies, dictate low-speed offtracking. In general longer wheelbases worsen low-speed offtracking.
Figure VI-1
Low-Speed Offtracking

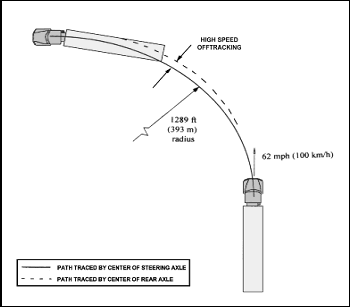
High-Speed Offtracking results from the tendency of the rear of the truck to move outward due to the lateral acceleration of the vehicle as it makes a turn at higher speeds. Figure VI-2 illustrates high-speed offtracking for a standard tractor-semitrailer. The speed-dependent component of offtracking is primarily a function of the spacing between truck axles, the speed of the truck, and the radius of the turn; it is also dependent on the loads carried by the truck axles and the truck suspension characteristics.
Figure VI-2
High-Speed Offtracking

This study examines the impact that scenario truck configurations would have on freeway interchanges, at-grade intersections, mainline curves and lane widths of the current roadway system, determines what improvements would be needed to accommodate the new trucks, and estimates the costs of these improvements. The focus of this research is to compare the new truck configurations with the current tractor-semitrailers and LCVs operating in the Scenario States.
Unlike the analysis for the CTS&W Study Volume III, the base case vehicle in this analysis varies by State depending on that State's grandfather laws under the 1991 ISTEA freeze. The chosen base case vehicle represents the worst vehicle from an offtracking perspective currently allowed on the analyzed roadway segment. For example if the worst off-tracking vehicle currently allowed on the roadway is a TPD then the TPD is used as the base case for that road segment, if the RMD is the worst offtracking vehicle then it is used as the base case vehicle, and if the 53-foot tractor semitrailer has the worst offtracking then it is the base case vehicle. Table VI-1 shows the base case RMD and TPD for each State. This precise framing of the base case is an improvement to the CTS&W Study's analysis that used the 48-foot tractor semitrailer at 80,0000 pounds as the base case vehicle for all roads.
| State | Rocky Mountain Double | Turnpike Double |
|---|---|---|
| Colorado | 43.5 + 31 | 48 + 48 |
| Idaho | 35 + 20 | 35 + 20 |
| Kansas | 48 + 28.5 | 45 + 45 |
| Montana | 38 + 28 | 45 + 45 |
| Nebraska | 38 + 20 | 38 + 20 |
| Nevada | 48 + 28.5 | 48 + 48 |
| North Dakota | 48 + 28.5 | 48 + 48 |
| Oklahoma | 48 + 28.5 | 48 + 48 |
| Oregon | 35 + 20 | N/A |
| South Dakota | 48 + 28.5 | 48 + 48 |
| Utah | 48 + 28.5 | 48 + 48 |
| Washington | 35 + 20 | N/A |
| Wyoming | 38 + 27 | N/A |
Table VI-2 shows the low-speed offtracking and swept path for the analyzed configurations. The measure is shown for a standard 90-degree right-hand turn with a 42-foot radius19 negotiated at a speed of 5 kilometers per hour. Low Speed Offtracking is the one measure where the STAA Double outperforms all the other configurations. The long TPD with twin 48-foot trailers performs the worst of the vehicles.
| Vehicle Description * | Configuration** | Performance Data | |
|---|---|---|---|
| Low Speed Offtracking (feet) | Swept Path | ||
| Single (53') | 3-S2 | 16.12 | 24.12 |
| STAA Double (2@28) | 2-S1-2 | 13.52 | 21.52 |
| RMD (38', 27') | 3-S2-3 | 18.57 | 26.57 |
| RMD (38', 27') | 3-S2-4 | 22.08 | 30.08 |
| RMD (38', 27') | 3-S2-2 | 21.54 | 29.54 |
| RMD (35', 20') | 3-S2-2 | 15.78 | 23.78 |
| RMD (38', 28') | 3-S2-4 | 20.06 | 28.06 |
| RMD (38', 20') | 3-S3-2 | 18.42 | 26.42 |
| RMD (38', 27') | 3-S2-4 | 21.02 | 29.02 |
| RMD (43.5', 31') | 3-S2-4 | 20.78 | 28.78 |
| RMD (38', 27') | 3-S3-4 | 19.13 | 27.13 |
| RMD (48', 28.5') | 3-S2-3 | 21.87 | 29.87 |
| Short TPD (2@45') | 3-S2-4 | 27.98 | 35.98 |
| Long TPD (2@48') | 3-S2-4 | 30.63 | 38.63 |
| Triple A-Train (3@28') | 2-S1-2-2 | 20.38 | 28.38 |
| Triple C-Train (3@28') | 2-S1-2-2 | 20.38 | 28.38 |
* Vehicle description shows the vehicle type where RMD is a Rocky Mountain Double and TPD is a Turnpike Double. The numbers in parenthesis give the length of each trailer.
**The first number in the series indicates the number of axles on the power unit; the next set refers to the number of axles supporting the trailing unit ("s" indicates it is a semitrailer) and the subsequent numbers indicate the number of axles associated with the remaining trailing unit(s).
The four roadway geometric elements impacted by truck offtracking are mainline horizontal curves, horizontal curves on ramps, curb return radii for at-grade ramp terminals and curb return radii for at-grade intersections. Data on these elements were collected for nine States in the CTS&W Study. Two of those States, Kansas and Washington, are in the current Scenario. Data from that two State sample were used by researchers to examine the five highway types in the sample States and determined the mainline curve radii based on Highway Performance Monitoring System (HPMS) data. Where HPMS data were not available the sample States provided existing aerial photographs and as-built plans on ramp curve and curb return radii at ramp terminals and intersections.
Roughly 25 rural interchanges, 25 urban interchanges and 25 rural at-grade intersections in each of the sample States were examined. The locations were selected because they carried substantial truck traffic.
The feasibility of widening each curve radius was rated as: minor difficulty (just add a little more pavement), moderately difficult, or extremely difficult (requiring major construction or demolition of existing structures). Sample data were expanded to the National Network for Large Trucks (NN). Estimates were made for the number of locations or mileage that needed improvements and the amount and cost of widening for each truck that offtracks more than the currently operating longest vehicle on that roadway segment.
The amount of widening was based on the offtracking of the scenario trucks. For horizontal curves and ramps, it was decided that no encroachment of shoulders or adjacent lanes would be allowed. For intersections and ramp terminals, trucks were not allowed to encroach upon shoulders, curbs, opposing lanes, or more than one lane in the same direction.
For some facilities, the cost of widening existing highway features is required even for the current vehicle fleet if there are turns and highway curves that cannot accommodate existing trucks. Those costs are reported in the Base Case Scenario. Similar to the bridge cost analysis, the Base Case Scenario results are subtracted from the Western Uniformity Scenario results to estimate the incremental cost of the proposed scenario vehicles.
As shown in Table VI-3, the scenario States vary in their current treatment of staging areas. Most States like Montana and Wyoming specify limited access but do not require staging areas. On the other hand, Idaho publishes a list of staging or "breakdown" areas close to the road network. These staging areas are privately owned and operated at truck stops or warehouse facilities.
| State | Provision |
|---|---|
| Colorado | Limited to 10 miles |
| Idaho | Specified Staging Areas (privately operated) |
| Kansas | State Issued Access Permit |
| Montana | Triples Limited to 2 miles off Interstate; |
| Doubles - Reasonable Access | |
| Nebraska | Within 6 miles of Interstate and approved by State |
| Nevada | Reasonable Access |
| North Dakota | Reasonable Access |
| Oklahoma | Limited to 5 miles from Interstate or 4 lane divided highway |
| Oregon | Staging at Private Facilities for Triples |
| South Dakota | Reasonable Access |
| Utah | Off-Interstate Routes as authorized by State |
| Washington | Reasonable Access |
| Wyoming | Reasonable Access |
To minimize the infrastructure repairs it is assumed the Turnpike Double is not allowed off the Interstate Network, except where already permitted by a State. Also, the triple trailer combination is restricted to the Interstate but that restriction is driven less by offtracking concerns but more by automobile driver concerns. Staging areas are assumed to exist at key rural interchanges and the fringes of major urban areas.
The CTS&W Study explicitly estimated the number and cost of staging areas, see Volume III, page VII-9. The present analysis employs the experience of Idaho DOT as a model for how the other 12 States would enact the necessary staging areas. Idaho DOT publishes maps showing the routes for extra-length configurations that provide the locations of breakdown or staging areas. The areas are built and maintained by private companies and users must make arrangements with the owners for use of the staging areas.
Therefore, it is assumed in this study that staging areas would be privately provided and States would make lists and maps publicly available to the truck operators.20
The model used in the CTS&W Study was used to estimate geometric improvement costs for the Base Case and Western Uniformity Scenarios based on the offtracking performance of the specified truck configurations, and the mileage and location of the roads upon which the vehicles are expected to operate. The 1994 costs were updated to 2000 using the Annual Price Trends for Federal-Aid Highway Construction Composite Index for the Scenario States.21
The costs to upgrade the roadway geometry are shown in Table VI-4. This upgrading improves the mainline curves, intersection and interchange features such that the scenario vehicle with the worst offtracking characteristics would not offtrack excessively, that is, offtrack outside the width of its lane.
| Analytical Case | Worst Offtracking Vehicle On Roadway | Improvement Costs ($ million) | ||||
|---|---|---|---|---|---|---|
| Mainline Curves | Intersections | Interchanges | Total | Incremental to Base Case | ||
| Base Case | RMD | $47 | $99 | $5 | $152 | |
| TPD | $112 | $214 | $387 | $713 | ||
| Total Cost | $159 | $313 | $393 | $864 | NA | |
| Western Uniformity Low Cube | RMD | $165 | $394 | $12 | $571 | |
| TPD-45 | $109 | $159 | $445 | $714 | ||
| Total Cost | $274 | $553 | $457 | $1,284 | $420 | |
| Western Uniformity High Cube | RMD | $165 | $394 | $12 | $571 | |
| TPD-48 | $150 | $221 | $698 | $1,069 | ||
| Total Cost | $314 | $615 | $710 | $1,639 | $775 | |