U.S. Department of Transportation
Federal Highway Administration
1200 New Jersey Avenue, SE
Washington, DC 20590
202-366-4000
|
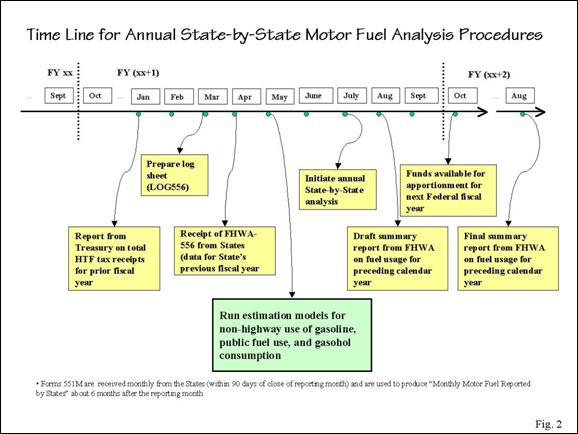
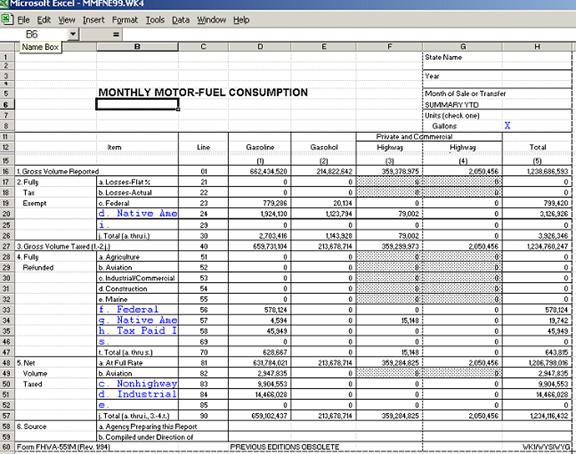
< Previous | Contents | Next > This chapter presents a description of the fuel attribution process. The description of the attribution process is divided into two levels of detail. The first, or high level, provides the relationships among the major components of the process, including the data sources, analyses, and outputs. The second level, or detailed level, describes the detailed data flows in each analysis. Basically, "attribution" is the process that FHWA carries out annually to determine a state's share of the overall on-highway motor fuel consumption. Results from this process are used in estimating amounts of the Highway Trust Fund (HTF) receipts to be attributed to highway users in each state. This information is then used in distributing funds to states through the apportionment process used in several major highway programs. The attribution process starts when highway-related tax revenue is collected by the Internal Revenue Service (IRS) and subsequently assigned to the appropriate tax categories - one of which is the motor fuel excise tax. The Federal motor fuel taxes are usually paid by oil companies at the point where the fuel is loaded into tanker trucks or rail cars at the terminal. Congress has determined that the tax money should be attributed to the state in which the fuel was actually consumed, which is not necessarily where the tax is paid (where it is loaded for shipment). However, the IRS has no information on where or how the fuel is actually consumed. Therefore, FHWA has to rely on its own attribution process to determine on-highway use of motor fuels within each state. The following sections describe the data analysis processes. The main sources of data for the fuel tax attribution process are forms submitted by the states to the FHWA, as well as many estimating models that are mainly used to ensure that the data for each state is being represented consistently, in addition to filling in any gaps in the data that exist for various, often unavoidable, reasons. Generally, the estimation models are updated and run in the May-June timeframe every year. FHWA completes these estimations before the beginning of the annual state-by-state analysis, which normally starts around July. These estimates actually represent the year prior to the analysis year since current-year data are usually not available in time. For example, 1999 data was used during the 2000 analysis year. Due to a time lag in the data collection and development of summary statistics, estimation models are run during May-June of calendar year x+1 to generate non-highway use of gasoline, public fuel use, and gasohol consumption for calendar year x. Figure 2-1 presents a timeline for the annual state-by-state motor fuel analysis procedures. It includes a three-year analysis cycle. Figure 2-1. Timeline for Annual State-by-State Motor Fuel Analysis Procedures 2.2 Monthly Motor Fuel Reporting Procedures Form FHWA-551M provides data for the monthly reporting of motor fuel volume. This form is completed by the state agency that collects the motor fuel tax. The form must be transmitted to the FHWA Washington Headquarters no later than 90 days after the close of the month for which data are being reported. Information that is not available on a monthly schedule is included on the next monthly report submitted after the data become available. In the past (before January 2002), data arrives from the states in any of several forms: mailed-in paper reports, facsimile paper reports, e-mailed reports, or computer disk reports in either Lotus or Excel format. States report amounts of fuel consumed in gallons. The information states provide is organized primarily for the purpose of administering state fuel-tax programs. There are variations in individual state requirements; therefore, reported data are sometimes not comparable among states. In order to treat states equitably in motor fuel attribution and to ensure consistency, the FHWA often has to adjust parts of the state's submissions. Once the preliminary adjustments are complete, resulting in one reviewed form for each month in the calendar year, the data are summarized in a report titled Monthly Motor Fuel Reported by States. This report is produced about six months after the month in which a transaction called "state taxation of motor fuel" or "taxable event" occurred. The data on hand from the states at the time of preparation for publication are included, and states that have not submitted data by that time are not included. The data are not consistent and complete at this early stage, and have had only minimal FHWA editing and no analysis. The data are, however, the most current, and therefore is the first place to identify potential trends, and the first place for states to check FHWA motor fuel entries for reason and consistency with their own records. The results are reported in the Highway Statistics Table MF-33GA, which shows gasoline volumes by month, and Table MF-33SF, which shows special fuels by month. 2.3 State-by-State Annual Analysis Figure 2-2 summarizes a high-level overview of the data flow from the states to attribution. It shows the various data sources, estimation models, and outputs generated from each analysis. Figure 2-2. Flow Chart of Motor Fuel Data The primary data sources on motor fuel use are the motor fuel gallons and motor fuel tax revenues reported regularly to the FHWA by each state's taxation or revenue department. States use Form FHWA-551M ("Monthly Motor-Fuel Consumption") to report gross volume fuel consumption to the FHWA, for gasoline, gasohol, highway diesel fuel, and highway liquefied petroleum gases (LPG) on a monthly basis. States also report their annual motor fuel tax revenue data on FHWA-556 ("State Motor-Fuel Tax Receipts And Initial Distribution by Collection Agencies") once a year. This form is submitted by a state on a fiscal-year basis, which can be a calendar year or any one of several annual time periods. Each state's fiscal year is different. For example, a state's fiscal year may be defined as July 1 to June 30, or October 1 to September 30. This time period represents an annual interval in which the department responsible for the "state motor fuel taxes" reports "revenue received from motor fuel per-unit taxes" to FHWA. Other taxes dealing with transportation issues also may be reported. Data from Form 556 is used on the EVAL worksheet (discussed later) to compare state-reported revenue with state-reported gallons (the gallons reported are multiplied by the state's tax rate(s) for comparison). FHWA Form 556 must be submitted to the FHWA by April 1 of the year following the analysis year. In a few cases, state-reported data on Form 556 must be put through additional calculations to meet FHWA needs, just as some of the Form 551M data must be adjusted. For example, Illinois reports gross receipts by gasoline and special fuels, but this data needs to proceed through several additional steps to properly allocate these totals. Examples of other states that require special treatment of Form 556 include Florida and West Virginia . The following section outlines the adjustments. 2.3.2 Data Verification and Adjustment As noted in Figure 2-2, the first step in the overall fuel tax attribution process is the states' completion of Form 551 each month. Once one of these forms is submitted, via disk, email, fax, or regular mail, and within 90 days of the close of the month for which the fuel volume data are reported to the Federal government, the FHWA reviews, verifies, and adjusts data where necessary. The adjustments to data submitted on Form 551M are necessary for several reasons. The state-submitted data are not of themselves sufficient for FHWA to accurately distribute HTF monies to the states consistently and equitably. Tax legislation, tax forms, and administrative procedures vary significantly among the states. For example, exemptions or refunds for non-highway use or government use of motor fuels are handled quite differently in many states. Also, for some states, collection of certain data may not be required according to the legislative requirements. In order to ensure accurate treatment of all states during the analysis of motor fuel information, adjustments are made to the data to account for these discrepancies. Furthermore, some adjustments are necessary in order to estimate missing or non-reported data. It is important to note that adjustments are made to the annual data summaries only. The adjustments are not made to monthly summaries. The spreadsheet version of the Form FHWA 551M currently used by FHWA is composed of thirteen worksheets for each state for any selected calendar year. Once the state data are written into the FHWA spreadsheets, the file is named MMF plus the two character state abbreviation and the two-digit year. One worksheet exists for each month, and the 13th worksheet presents the summary sheet that contains totals from the other 12 sheets. The summary sheet sums all the monthly worksheet cells of Form FHWA-551M from page one into annual totals. Once the data on Form 551M have been verified and adjusted, three summary tables are generated in addition to the 551M Summary (Figure 2-3):
Detailed descriptions of the annual summary analysis are presented in Section 2.4 of this report. When assured that all entries in the summary are properly accounted for, the evaluation process (EVAL) is performed. Figure 2-3. Data Verification and Adjustment Before state-reported fuel data from the 551M Summary can be used in the fuel attribution process, it must be checked for accuracy and rationality through a process known as EVAL (Figure 2-2). This is a critical step in the fuel tax attribution process since it establishes the consistency and validity of the data submitted by the states. In the evaluation process, states whose tax rates have changed during the year and those with multiple tax rates are checked to ensure the appropriate tax rates are used in the analysis. The evaluation process involves using the tax rates from MF-121T and the 551M Summary sheet generated in the preceding step to compare with the revenue reported on Form 556. Using IFTA gallons information from Form 556 and Form 571, the annual data are reviewed and adjusted as necessary for each state to ensure adequate fuel data quality (Figure 2-4). This is performed to ensure reported consumption (in gallons) and receipts (in dollars) are within acceptable limits. The calculated tax revenue, based on the reported volume data, must not vary from the reported receipts by more than 10 percent. Additional adjustments may be required when significant differences are identified. Depending on the scale of these differences, the state may be contacted and a written explanation will be requested. The MF-20 analysis (and subsequent steps in the fuel attribution process) cannot proceed until the correlation between receipts and gallons (times the tax rate) is within the acceptable limits. FHWA analysts work with a state until there is a less than 5 percent difference in the receipts reported on the Form 556 versus the gallons (times tax rate) reported on 551M. The output of the evaluation is a revised 551M summary that is used in the GTA revenue analysis, the gasohol model, and in the Use/User Analysis (Figure 2-4). This Revised Form 551M Summary, distinguished from the Form 551M Summary, is the output of data verification and adjustment. Detailed descriptions of the step-by-step process involved in the evaluation analysis are presented in Section 2.4 of this report.
Note: Form 571 is submitted by only a few states in reporting their IFTA gallons; most states report their IFTA gallons on the 551M Form. A similar process to EVAL is the Gallons Taxed Analysis (GTA) process that uses revenue data from Form 556 and fuel consumption data (in gallons) from the Revised 551M Summary to compare the two sets of information. This analysis completes forms MF-51 and MF-56, which together are referred to as GTA. The results of this comparison are then published in Highway Statistics Tables MF-1 (motor fuel tax receipts for all states) and MF-2 (volume of motor fuel exempt from and subject to state taxation). This process, however, does not have a direct effect on the fuel attribution process. A detailed description of the analysis steps is presented in Section 2.4 of this report. The next step in the fuel tax data analysis process is to estimate public and non-highway use of fuel. This step is presented in the following section. 2.3.5 Estimation Models Used in FHWA Attribution Process A number of mathematical and statistical formulas, as well as supplemental information from many other sources, are utilized in analyzing the motor fuel data. The complexity of this process reflects the wide variation among state taxation structures and methodologies for defining, capturing, and reporting data to the FHWA. The FHWA performs three estimation procedures for the following motor fuel usage components:
Each of these components is estimated by utilizing models. These estimation models and their data sources are described in detail in Section 2.5 of this report. The Federal fuel taxes, which make up more than 80 percent of the HTF receipts, are imposed when the fuel is first removed from bulk storage and the tax is paid by the seller. Generally, these taxpayers are the oil companies. Although paid initially by a company, the costs of these fuel taxes become part of the purchase price of the products and are ultimately paid by the highway users. Using oil company tax data in attribution process would be problematic, however, because the state in which the motor fuel tax is paid does not reflect where it will be shipped, stored, or used. Consequently, FHWA must estimate the HTF contributions from highway users by looking at tax revenue data in each state. Typically, state revenue departments have data on motor fuels that are exempted, refunded, or taxed at other rates. From this type of data, FHWA may be able to identify the use of the fuel and, therefore, its place in attribution of HTF. Unfortunately, in many cases, this data does not exist at the state level and FHWA must estimate fuel usage from other sources. Furthermore, as stated previously, motor fuel tax programs vary from state to state. Often, the states' motor fuel information systems and the data that are submitted to FHWA are not comparable. Some states exempt or refund taxes collected for all fuel used by agencies of the Federal government. A few states tax Federal highway use of motor fuel while others also tax non-highway fuel uses by Federal agencies. Similarly, rules on tax exemptions or refunds for motor fuel used by state, county, and municipal government agencies also differ significantly among states. Rather than imposing the data collection and reporting burden on the states, FHWA has opted to estimate some of these data. In the case of gasohol usage, very few states recognize the Federal definitions of gasohol (i.e., alcohol content of 5.7 - 7.7, 7.7 - 10 percent, and >10 percent). Some states define gasohol as reformulated gasoline (RFG), not as a gasohol blend. Furthermore, most states tax gasohol at the same rate as gasoline, and the tax receipts are combined for these fuel types. Consequently, states are not able to furnish data with the level of detail required by FHWA. A modeling approach is therefore needed so that FHWA can determine the distribution of total gasohol consumption by the three Federal gasohol tax categories. The estimation process developed by FHWA has been designed to accurately represent states on highway fuel use, and to produce meaningful results to fulfill attribution process needs. When FHWA estimates and state-submitted data are available, FHWA makes judgments about the relative quality of the data and selects one or the other, or some combination of the two data sets. The following sections provide overviews of the estimation models. The outputs from the off-highway use of gasoline and public use estimation models are used together with the revised Form 551M Summary to conduct the Use/User Analysis (MF-20). 2.3.5.1 Off-Highway (or Non-Highway) Gasoline Model Tables MF-33GA and MF-121T (monthly gasoline reported by states and tax rates on motor fuel by state, respectively) generated from the data verification process are used as inputs to the Off-Highway Gasoline Model. The off-highway estimation model has six modules (Figure 2-5):
Three of these modules (agricultural, construction, and industrial/commercial) are further divided into two categories: non-highway use of gasoline by trucks and non-highway use of gasoline by other equipment. The purpose of the off-highway model is to estimate non-highway use of gasoline (both private and commercial) for individual states. This estimation is performed as part of an effort to separate on-highway gasoline use from non-highway use since only on-highway use is applicable to the FHWA apportionment process. Fuel consumption for small equipment (e.g., lawnmowers, chain saws) is not included due to a lack of reliable data. FHWA plans to review recent work by the U.S. Environmental Protection Agency (EPA) on off-road small engines to determine the feasibility of using this information in enhancing the non-highway fuel consumption models with this additional data. The EPA has recently created a model ("NONROAD"), which is a comprehensive, national model for estimating and predicting non-road emission inventory, including 80 basic and 260 specific types of small gasoline engines. The most recent version of this model released (June 2000) is still in draft format while the data collection and analysis efforts continue at EPA. Output data from the Off-Highway model is then used in the Use/User Analysis and in generating Table MF-24 (private and commercial non-highway use of gasoline) of Highway Statistics [4]. The steps involved are described in detail in Section 2.5 of this report. Figure 2-5. Off-Highway Gasoline Model 2.3.5.2 Public Sector Consumption Model The Public Use Model is used to estimate public sector consumption of gasoline. This model uses information from Highway Statistics Table MV-7, the GSA's Federal Motor Fleet Report, percentages of fuel consumption, and population and land area data, to estimate gasoline consumption by the public sector (Figure 2-6). The public sector includes Federal, state, county, and municipal governments. At the Federal level, only civilian use of motor fuel is considered (off-highway military use is exempted from Federal tax liability). This model creates consistent data for each state that would otherwise be inconsistent due to differing state taxation policies. The final estimation of public sector fuel consumption is then used in the Use/User Analysis. The steps involved are described in detail in Section 2.5 of this report. The Gasohol Model uses information from the Revised 551M Summary as well as from an IRS Module to estimate gasohol consumption for each state, in terms of three blends defined by the Energy Policy Act of 1992 (EPACT) and recognized by the IRS and FHWA: 10 percent, 7.7 percent, and 5.7 percent ethanol by volume (Figure 2-7). IRS taxes the three different blends of gasohol at different tax rates. This model serves to provide comparable estimates of each blend for each state since the states have a variety of methods of reporting gasohol consumption amounts. Some states report only one type of ethanol, while others do not report any gasohol consumption at all; Washington State is the only state that defines the three types of gasohol in legislation identical to those defined in the Federal legislation. Since highway-funding attribution is based on Federal motor fuel tax revenue, FHWA has to determine gasohol revenues attributed to each state using the Federal definition of the three types of gasohol. Data generated from this process is used in the Attribution of HTF receipts as well as in Highway Statistics Table MF-33E (i.e., FHWA estimation of amount of gasohol used in each state) (Figure 2-2). Section 2.5 presents detailed descriptions of the model. 2.3.7 Use/User Analysis (MF-20 Analysis) As can be seen in Figure 2-8, data from the Revised 551M Summary as well as the Public Use Model and the Off-Highway Model are inputs for the Use/User Analysis (MF-20). Figure 2-8 provides an overview of the inputs and outputs of the MF-20 analysis. The purpose of the MF-20 analysis is to subdivide fuel consumption into several categories, denoting both the use and the users of the fuel consumed: fuel type (gasoline, gasohol and special fuels), use (highway and non-highway), and tax status (e.g., exempt, refunded, at-other-rate). The most important subdivision is highway versus non-highway. The distinction between "public" versus "private and commercial" is secondary. As a rule, the non-highway gallons consumed shown on the MF-20 form/worksheet should not be greater than the FHWA-estimated values from the models. The results of this process, including fuel consumption categorized by fuel type, use, and tax status, then feed into the Attribution of HTR process. In addition, the results generate two Highway Statistics tables:
This step immediately precedes the attribution of fuel taxes, and final adjustments to the data reported by the states are made in the MF-20 analysis. It involves several sub-steps including comparing model estimates with state-reported values, imputing missing data, and adjusting Native American fuel consumption. Figure 2-8. MF-20 (Use/User Analysis) The final step in the fuel tax attribution process is the calculation of the HTF Receipts. Figure 2-9 shows the inputs and outputs of this final step. Using outputs of the gasohol model, the Use/User Analysis and Form 556, the highway fuel usage for each state is aggregated and the apportionment amount, based on the percent of fuel used, is calculated for each state. In other words, for each state, the total tax receipts received for each type of fuel are multiplied by the percent of total fuel consumed to determine the amount of attribution the state will receive. This calculation is done for gasohol and special fuels as well as gasoline. In addition to determining the fuel attribution, the data from this process is reported in Highway Statistics tables:
2.4 Detailed Descriptions of Steps in Each Process This section presents detailed descriptions of the steps in each of the processes discussed in Section 2.3. The descriptions include diagrams that show data flows at the highest level of detail. The business rules applied in the various stages of the analysis process are shown in italics. Figure 2-9. Attribution of HTF Receipts 2.4.1 Summarizing Fuel Tax Data from the States Naming Conventions The following are naming conventions used for the files used in the fuel data analysis. The two major folders containing motor fuel files are called MF (motor fuel) and MMF (monthly motor fuel). Within the MF folder are sections representing a series of years, where a two-digit name represents the last two digits of the year, so 84 represents 1984, 00 represents 2000, etc. Within the folder for a given year, state's files are indicated by its two character postal code (i.e., Colorado is CO and Connecticut is CT). The rest of the characters represent the type of data analysis worksheets (EVAL, MF20, and GTA). In the MMF folder, the organization is slightly different. The MMF folder has a large set of files in which the name begins with MMF, indicating monthly data. The next two places in the filename indicate the state's name, identified by its two character postal code. In the next two places, the year is indicated by the two-digit system described above. A subfolder of MMF, entitled "Tables," contains the worksheets that develop the tables to be published in Monthly Motor Fuel Reported by States and Highway Statistics. The table filenames indicate the type of table and the motor fuel information being displayed. For example, 33GA00.wk4 contains the data for Table MF-33GA, and displays monthly data on gasoline for the year 2000, and 33SF00.WK4 contains monthly data for Table MF-33SF, and displays data on special fuels for the year 2000. Data Source Form FHWA-551M provides data for the monthly reporting of motor fuel volume. Form FHWA-551M is completed by the state agency that collects the motor fuel tax. The form must be transmitted to the FHWA Washington Headquarters no later than 90 days after the close of the month for which data are being reported. Information that is not available on a monthly schedule is included on the next monthly report submitted after the data becomes available. In the past (before January 2002), data arrives from states in any of several forms: mailed-in paper reports, facsimile paper reports, e-mailed reports, or computer disk reports in either Lotus or Excel format. States report units in gallons on this form (Figure 2-10). Editing State Data Reports At this stage of the motor fuel reporting process, the purpose of the data entry is to record the state-reported data as it is received. As noted in the introduction in Chapter 2 of "Guide to Reporting Highway Statistics," the state data may be modified later to achieve uniform measurement of the data because of differing definitions and treatment of data under each state's legislation and administrative procedures. Generally, state motor fuel taxes are levied on road users, and refunds of the taxes paid or exemptions to the tax are given for non-highway use of motor fuel. However, not all states offer refunds or exemptions for all classes of non-highway use, and not all available refunds are actually claimed. Thus, often the net volume of fuel taxed is not the same as the volume consumed on highways. Volume of motor fuel consumed on the highways in each state is the primary data parameter of interest for FHWA purposes. It is necessary to make various adjustments to the tax-status information provided by the states to show fuel volume on a use basis when consistency of motor fuel data are essential for attribution and publication in Highway Statistics. The purpose of the adjustments is to level the playing field so that all states are treated equitably in attribution. During the data entry process, the FHWA assesses the data being entered, using some analytical judgment. For example, FHWA has chosen to show only private and commercial highway (i.e., excluding public) use of special fuels in its consumption tables. Many states, however, report non-highway and public uses of special fuel. The FHWA currently deducts any identifiable non-highway or public use of special fuels in the state-reported figures. In the near future, FHWA will be changing this policy. FHWA instructions will ask the states not to report identified non-highway diesel. State reporting of data that is not needed by FHWA serves no useful purpose and therefore should be eliminated. By FHWA definition, transit use, regardless of the ownership of the transit system, is treated as private and commercial use of special fuels. Many states do not report their use of transit special fuels. At this stage, the FHWA analyst corrects the state's data by including transit use when these data are available from other sources, if at all. Under current FHWA practice, an FHWA analyst enters some states' transit data (CO, MA) from this source. In future changes to the reporting instructions, FHWA will instruct states to obtain data on transit motor fuel use in their state from this source, and to report this data if the state does not have its own sources for transit motor fuel use data. Aviation gasoline is another fuel tracked by an independent source. Since aviation gasoline is treated differently than normal gasoline (it is a higher-octane fuel and is stored separately to maintain purity), Department of Energy (DOE) tracks its inventory. The data series can be found in Petroleum Marketing Annual, Table 49, "Prime Supplier Sales Volumes of Aviation Fuels, Propane, and Residual Fuel Oil by PAD District and State." Data for a full calendar year should be available by March of the following year. A few states will have data for some months withheld from this table because of disclosure provisions. For a few states (usually four or five) data will be withheld for the entire year. For these states, estimation procedures are discussed in Section 2.5. Annual State Data Analysis Once the monthly motor fuel data are verified, adjusted, and considered complete for the calendar year for a state, the FHWA-551M annual summary for the state is generated. This summary provides annual data for each state. The data are checked to ensure that all components are included, since the data for some states may be incomplete (for example, International Fuel Tax Agreement [IFTA] data may not be complete, even though all monthly data may be available, because most IFTA data are reported quarterly). The following steps are taken for states with available FHWA Form-551Ms in reviewing the entries on the summary:
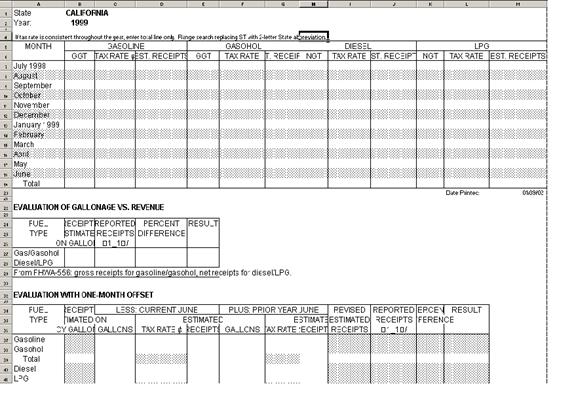
For a few states, IFTA motor carrier gallons are not reported on the Form 551M or included in the summary. If adjustment is indicated on the previous year's file for the state in question, the appropriate gallons to GGR diesel and gasoline are added on to the current year's summary before proceeding. In a few cases, the state must be contacted to obtain IFTA gallons. In others, the states show their revenues on the Form 556. For these, the state divides the revenue by their IFTA tax rate in order to determine the number of gallons. IFTA gallons also may be shown in supplementary documents, noted on page 2 of the 556, or included on FHWA Form 571. When reported on Form 571, the revenue is shown on the GTA worksheet, and gallons calculated, based on the revenue, are transferred to the 551M summary and the transfer noted on Form 571, so that the Motor Vehicle staff does not include it with the motor carrier receipts. The state-reported data are also checked to ensure that it includes only aviation gasoline. The FHWA is only concerned with the gasoline used in piston-engine airplanes (e.g., Piper cubs), not jet fuel or turbo-prop fuel, which is kerosene. After a calendar year's worth of state forms have been verified, the data can then be used in FHWA Tables MF-33GA, MF-121T, and MF-33SF. The 12-months' data are also summarized in a sheet titled, "551M Summary." Annual data reported in the 551M Summary includes gross volume reported, gross volume taxed, fully refunded volume, fully exempt volume, tax rate at the end of each, and stratification of gasohol consumption by blend ratio. This summary is then used in the Gasohol Model, GTA analysis, and in the Use/User Analysis (MF-20). 2.4.2 Procedure for Completing EVAL Worksheet A template is used to create a blank EVAL spreadsheet (Figure 2-11). Two versions of EVAL template exist - one for calendar year and one for fiscal year. The template is chosen based on the state's fiscal year (as shown on the previous year's EVAL or the state's Form 556). Only one rate is entered on the total gallons row if the tax rates do not change through the year. If the state's tax rates change one or more times during the year, the tax rates are entered for each month. The appropriate revenue receipts from the FHWA Form-556 are then entered (instructions to do so are written on the blank EVAL). Next, gasoline gross gallons taxed (and gasohol, if the state reports any) times the tax rate is compared to gross gasoline and gasohol revenue. Also, diesel net gallons taxed (and special fuels, if the state reports any) times the tax rate is compared to net diesel revenue. In many states, IFTA gallons from Form-556 are derived by dividing total diesel revenue by the diesel tax rate, and therefore, must match the EVAL results closely. Although this may be considered circular reasoning, and therefore invalid for data verification, it is necessary in order for some states to be able to provide reasonable IFTA numbers. Care is taken to use the correct tax rates in the evaluation. For example, the FHWA adds an environmental fee for Nebraska to the tax rate in Table MF-121T. However, Nebraska does not report revenue from the environmental fee on Form-556. This means that the environmental fee is not included in the tax rate for the EVAL calculation. Because there is no distribution of revenue to the cleanup fund shown on the bottom half of the FHWA Form-556, FHWA can conclude that there is no environmental revenue on the FHWA-556. Michigan (multiple rate structure), New York , West Virginia , and Florida (State Comprehensive Enhanced Transportation System [SCETS] tax) are other states with complicated tax structures, requiring special consideration. The evaluation results of the previous year are generally used as a guide, noting the following:
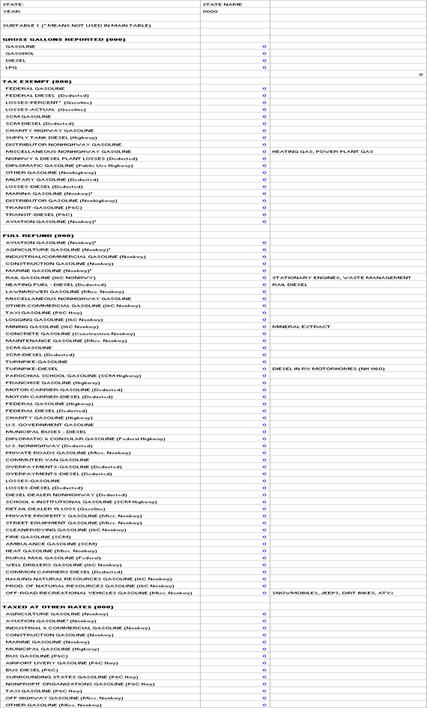
As a rule, the EVAL process is considered complete if the estimated gallon receipts are within a plus or minus five percent of the reported receipts. If not, any items included in either the 556 receipts or the 551M gallons are checked to see if they have not been accounted for in the other form. If the difference remains outside the acceptable range after all adjustments have been made, the monthly gallons data are offset by one month and then re-estimated using the cells at the bottom of the EVAL worksheet. Sometimes a lag exists between gallon data and receipts data. If offsetting does not make the difference within five percent, a decision is made as to whether or not the state should be contacted. If the difference is 10 percent or greater, the state must be contacted by telephone or memo for a written explanation. Once the correlation between the reported receipts and gallons is within acceptable limits, a revised 551M summary is produced. The EVAL worksheet is saved as xxEVAL, where xx is the two-letter state abbreviation. This is then used in the Use/User and GTA Revenue analyses and also as an input into the Gasohol model. 2.4.3 Steps in the Use/User Analysis (MF-20) The MF-20 process is divided into three parts. The first part is a sub table worksheet that contains the possible fuel types under the categories of exempt, refunded, and taxed at other rate. The second part is a worksheet used to enter the values estimated from the models and to determine which number should prevail (either the estimated number or the state-reported number). Sometimes the estimated numbers are used to derive missing data points that a state has not reported. The third part is the analysis worksheet where the calculations are done. The following are steps in running the MF-20 analysis program:
As a rule, if the amount the state reports is less than the FHWA estimate, place the difference in the prevailing rate column. If a state's Federal use amount is greater than the FHWA estimate (which represents Federal civilian on-highway use), the excess will automatically be deducted in the MF-20 as Federal government non-highway (it is assumed to be for military or non-highway uses). Also enter the allowable one percent loss, discussed earlier, if state-reported data exceeds one-percent. If the state reported losses is less than one percent, enter the state-reported number.
Some additional items to note regarding the MF-20 analysis worksheet:
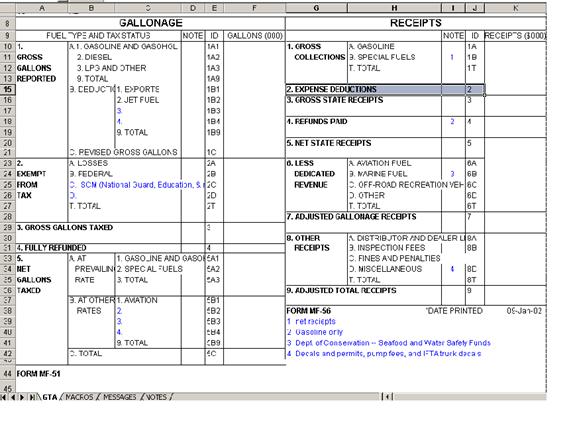
Figure 2-12. Sample MF-20 Sub-Table 2.4.4 Steps of the GTA Analysis The GTA process uses revenue data from Form 556 and fuel consumption data (in gallons) from the Revised 551M Summary to compare the two sets of information. This analysis completes forms MF-551 and MF-556, which together are referred to as "GTA." The steps for completing these forms are listed below. The results of this comparison are then published in Highway Statistics Tables MF-1 (motor fuel tax receipts for all states) and MF-2 (volume of motor fuel exempt from and subject to state taxation). This process, however, does not have a direct effect on the fuel attribution process. Figure 2-13 shows the worksheets for the GTA analysis. Figure 2-13. Sample GTA Worksheet Steps to complete the GTA tables for a state:
2.5 Detailed Description of Estimation Models This section presents, in greater detail, the estimation procedures that FHWA uses in completing its annual attribution process. Specifically, this section describes the estimation models used in producing state-level consumption estimates for (1) non-highway use of gasoline; (2) Federal, state, county, and municipal governments (i.e., public sector) use of gasoline; and (3) on-highway use of gasohol. Figure 2-2 shows where the operations of these models occur in relation to the entire attribution process. As noted in Section 2.2, the estimation models are updated and run between May and June. FHWA estimates the public use of gasoline for the same reason it estimates off-road uses of gasoline. Although the Federal tax code exempts public uses of gasoline, not all states do so; therefore, it would be inconsistent to use as-reported state data without adjustment. Additional inconsistencies and exceptions apply to states' reporting of gasohol, and so this type of fuel consumption requires modeling as well. The following sections describe the models' characteristics and positions within the sequence of fuel attribution processes. 2.5.1 Off-Highway (a.k.a. Non-Highway) Gasoline Model 2.5.1.1 Off-Highway Gasoline by Trucks The non-highway gasoline-consumption estimation model builds on estimation procedures developed by Oak Ridge National Laboratory (ORNL) for the FHWA in 1994 [5]. Data used in this model are compiled from various sources, including publications and data sets produced by Federal agencies (e.g., Census Bureau) and private organizations, such as the Motor Vehicle Manufacturers Association of the United States . The model was implemented as a Windows-based spreadsheet by ORNL, for ease of annual updates and use by FHWA. ORNL also developed a User's Guide for this spreadsheet system, which provides detailed information on the operations of this model [6]. The first step in the Off-Highway Gasoline Model estimates the non-highway use of gasoline by trucks. The "APPEND" module estimates non-highway use of gasoline by trucks. Figure 2-14 shows the data flow through the multiple worksheets in the APPEND module. Periodic updates of data, however, need to be manually completed by the FHWA. The results of the APPEND module are used in the AGRICULT, CONSTR, and IND modules. The major data sources and estimation procedures used in the APPEND module are described below. Note: "WS" denotes a worksheet in the spreadsheet program. Figure 2-14. Non-Highway Trucks Module ("APPEND") The major data set used for estimating non-highway uses of gasoline by trucks is the Vehicle Inventory and Use Survey (VIUS), a national sample survey conducted every five years by the Bureau of the Census. VIUS is part of the Census of Transportation under the Economic Census. The most current data set available is for 1997. VIUS provides information on trucks owned by businesses and individuals, ranging from multi-trailer combination vehicles to pickups, vans, and minivans. Data elements contained in VIUS include vehicle type, engine type, annual vehicle-miles of travel (VMT), major use of vehicle (e.g., agricultural, construction, mining, manufacturing, retail wholesale), percent of annual mileage for off-road use, engine type (e.g., gasoline, diesel), state in which the vehicle is registered, average miles per gallon (MPG), and other vehicle characteristics. Because VIUS is a survey of vehicles selected based on a statistical sampling method, each record (which represents one vehicle in the survey) also includes an expansion factor that can be used to "inflate" the sample to its national representation (i.e., the universe). The necessary data are extracted from VIUS using a computer program developed by Battelle, and the database program, Microsoft Access [14]. Other data sources include Motor Vehicle Facts and Figures published by the Motor Vehicle Manufacturers Association of the United States and Highway Statistics by the FHWA. A fuel-use growth rate factor was computed using data on the number of trucks in operation obtained from Motor Vehicle Facts & Figures and averages of VMT per truck, as well as average MPG from Highway Statistics. The estimated growth factor is used to expand the VIUS estimate represents the analysis year. Details of data sources used in the estimation models are shown in Appendix B. Use the Latest VIUS Before initiating the APPEND spreadsheet program, FHWA needs to ensure that the APPEND module contains the most recent version of VIUS data. As stated before, VIUS is only conducted once every five years. The next VIUS is scheduled for 2002 but the data will not likely be available before 2004. Therefore, current VIUS data components within the APPEND module will not require updates until the new data set is available. At the moment, Worksheet-A contains information derived from the 1997 VIUS. This spreadsheet contains one table with five columns. One column identifies the state and the other columns are for the four selected major uses of trucks (i.e., agricultural, construction, industrial/ commercial, and personal). Values in these four columns represent the total gasoline consumed by trucks operated off-road in the given state for each major-use category in 1997. How VIUS Data was Used The data content of Worksheet-A is not directly extracted from VIUS because VIUS does not provide a break down of gasoline and gasohol fuel use. Furthermore, it does not provide on-highway versus non-highway fuel efficiency of the trucks (i.e., MPG), nor the percent of off-road travel that occurred within a state. The state of registration is assumed to be where the off-road travel took place, even though in reality it does not always represent the state in which the truck operates. Using information on average MPG, annual VMT, and the percent of off-road travel for each gasoline-engine truck from the VIUS data set, ratios for on-highway over non-highway MPG for each selected major-use category and truck type are computed. These MPG ratios are then used to calculate non-highway fuel use for each state. Detailed descriptions of these methodologies are provided in the ORNL report [5]. Adjustment for Non-VIUS Year Estimates When the analysis year is not the same as the VIUS year, VIUS-based non-highway estimates are adjusted so that changes that may have occurred during the interim years can be captured. As mentioned previously, a fuel-use growth rate factor is computed using information obtained from Motor Vehicle Facts & Figures and Highway Statistics. The estimated fuel-use growth factor is essentially a combined factor based on three growth rates: number of trucks in operation, average VMT per truck, and average MPG for trucks. These growth rates and the final fuel consumption growth factor are included in Worksheet-B of the APPEND module. The resulting table is generated by multiplying the growth factor from Worksheet-B and each of the elements in the Worksheet-A table, and is then stored in Worksheet-C of the APPEND module. Separating Gasoline and Gasohol Consumption Because gasoline-engine trucks can use either gasoline or gasohol and VIUS does not provide direct distinctions in fuel usage, a different data source is needed to further break down the non-highway fuel use into gasoline and gasohol uses for each state. This separation of gasoline and gasohol is conducted by using information gathered from Worksheets A, B, C, and data on gasohol consumption estimated from the gasohol model. The gasohol estimation model is discussed later in Section 2.5.3 of this report. Worksheet-D of the APPEND module computes gasohol shares for states, in relation to total gasoline and gasohol consumed in the state. These estimates are calculated based on data obtained from Table MF-33GA in the most current edition of Highway Statistics. Worksheet-E of APPEND combines data from Worksheets A through D to obtain state-level estimates for non-highway uses of gasoline and gasohol by three of the four major-use categories for trucks (i.e., agricultural, industrial and commercial, and recreational). The fourth estimate, for the truck fuel consumption for non-highway construction purposes, is not broken down by state. Rather, national totals on gasoline and gasohol consumption for non-highway construction use are provided in Worksheet-E. The model developer felt that such a design was necessary because VIUS does not provide information that is timely enough to reflect current construction activities within the states. The method used for allocating the total non-highway construction use of fuel to the states is presented in Section 2.5.1.4. The second part of the Off-Highway Gasoline Model estimates the non-highway gasoline used by what is considered "other equipment." In addition to gasoline use by trucks while operated off-highway, other types of equipment used for non-highway purposes also consume gasoline. Five modules are included in this group. Each of these modules calculates the amount of gasoline consumed by certain types of equipment (other than trucks) for one of the five major-use categories: agriculture, construction, industrial/commercial, aviation, and marine. Gasoline consumption estimated from these modules are then combined with those computed from the APPEND module to generate the total non-highway gasoline gallons estimates by state. Descriptions of the five modules, including their data sources and procedures, are provided in the following sections. 2.5.1.3 Agriculture Module ("AGRICULT") Data Sources In addition to farm trucks, farm equipment (e.g., wheel tractors, cotton pickers) also consumes gasoline. Note that two assumptions are employed in this estimation procedure. The current model assumes that farm equipment is used solely for non-highway purposes and does not use gasohol [1] . This module uses data from the Census of Agriculture as its primary information source. Additional data sources include the Farm Production Expenditures summary report published annually by U.S. Department of Agriculture (USDA), Petroleum Marketing Annual from Energy Information Administration (EIA), U.S. Department of Energy (DOE), and Highway Taxes and Fees published by FHWA. Details of data sources used in this estimation model are shown in Appendix B. Estimation Method The estimation procedures for non-highway gasoline consumption by farm equipment are somewhat complicated. Figure 2-15 illustrates how data flows within this estimation process. Similar to VIUS, Census of Agriculture is also under a five-year data collection cycle. The latest data was collected for 1997. To ensure that the module produces reliable estimates, it is necessary to periodically update the model with the most recent version of Census of Agriculture data. Information is also obtained from the 1991 Farm Production Expenditures summary report. No updates of this source have been entered into the model due to the fact that no information at this level of detail has been available since 1992. Worksheet-A of this module contains information on ratios of gasoline to total fuel expenditures derived from the Census of Agriculture and associated Farm Production Expenditures summary report. Total fuel expenditures taken from the most recently published summary report are then used to estimate expenditures on gasoline for the analysis year. In order to assure accuracy of the estimated ratios (i.e., gasoline to total fuels expenditures for fanning), agricultural fuel use by farm equipment is further divided into two agricultural fuel-distribution mechanisms: bulk storage tanks on farms and purchases made at retail stations. Note that geographic detail for farm expenditures on fuels provided by the Farm Production Expenditures summary report is at the farm production region level, not at the state level. Census of Agriculture data are used to compute each state's share of total expenditure within each region in the Census year. This information is stored in Worksheet-B. Assuming state-shares for the analysis year stay the same as those in the Census year, Worksheet-B then applies results obtained from Worksheet-A to generate state-level expenditures by the two fuel-distribution methods for each state. Using gasoline price data obtained from EIA's Petroleum Marketing Annual and state fuel tax rates from Table MF-121T of the Highway Taxes and Fees, estimates on total gallons of gasoline used in agriculture by state, for the analysis year, are generated and stored in Worksheet-B as well. Worksheet-C of the AGRICULT module contains estimated shares of non-highway gasoline use by agricultural farm equipment. These shares were estimated based on a statistical regression model developed using information collected under the Census of Agriculture. This regression model established a relationship between the non-highway agricultural gasoline use and the number of farm equipment units used by farmers within each state during the Census year. Again, by assuming the shares remain the same for the analysis year, the non-highway agricultural gasoline use by state can be estimated from the totals obtained from Worksheet-B. Figure 2-15. Agriculture Module ("AGRICULT") By combining estimates for farm trucks from Worksheet E of the APPEND module and estimates for farm equipment from Worksheet-C of AGRICULT, the process of estimating the non-highway agricultural uses of gasoline and gasohol by state is finally completed. It should be noted that fuel use by trucks comprises the majority of this estimation. The resulting estimates are provided as Worksheet-D in the AGRICULT module. 2.5.1.4 Construction Module ("CONSTR") Data Sources Similar to agricultural fuel use, motor fuels are consumed by both equipment and vehicles used off-road for construction purposes. The majority of vehicles used for non-highway construction purposes are expected to be trucks and vans, particularly single-unit heavy trucks. Therefore, this estimation is included under the VIUS framework. Construction equipment, such as asphalt pavers, non-vehicle concrete mixers, surfacing equipment, cranes, tractors, loaders, and backhoes, are not licensed for highway use and are generally powered by diesel fuel. Currently, FHWA motor fuel reporting does not include non-highway diesel usage. The EPA is working on a draft model so that these uses may be included in the Off-Highway gasoline model in the future. Unlike agricultural fuel use, however, both gasoline and gasohol are considered in this model. Besides the VIUS data set used by APPEND, a major data source used in this CONSTR module is the Statistical Abstract of the United States published annually by the Census Bureau. Estimation Method As described earlier, the national totals of non-highway gasoline and gasohol consumption by trucks used for construction purposes are provided in the VIUS-based APPEND module. State-by-state estimates of construction use of gasoline and gasohol, however, are not produced by APPEND. Instead, dollar-values of non-residential construction contracts in each state obtained from the Statistical Abstract of the United States are used to distribute the VIUS-estimated total to the states. This is because the Statistical Abstract data on non-residential construction contracts are much more current than the VIUS data and, therefore, can better reflect current construction activities within the states. The computation process in the CONSTR module is more straightforward than the AGRICULT module. Figure 2-16 shows the data flow in this estimation process. Data contained in this worksheet includes state-level values of non-residential construction contracts extracted from the most current Statistical Abstract publication. The module computes the state shares of the total non-residential construction contracts, takes the total non-highway gasoline and gasohol consumption estimates for construction uses from the APPEND module, and distributes the totals, according to these shares, among the states to obtain state-by-state estimates.
Figure 2-16. Construction Module ("CONSTR") 2.5.1.5 Industrial/Commercial Module (" IND ") Data Sources The majority of the vehicles used for non-highway industrial and commercial purposes are expected to be vans and trucks, mostly used for shipping products and materials. It should be noted that forklifts, sweepers, scrubbers, material-handling equipment, generators, pumps, and welding equipment also fit in this classification, but are not included in the model since no reliable data exists for this equipment. Again, VIUS is applied as a major data source by this module. Data regarding off-road use of trucks in manufacturing, mining, forestry, wholesale and retail trade business, utilities, services, rental, and for-hire transportation business are all included in this category. Estimation Method Non-highway use of fuel by the industrial and commercial sectors is estimated in the same general manner as for the agriculture and construction sectors (Figure 2-17). Motor fuels can be consumed by both equipment and trucks used off-road for industrial and commercial purposes. Industrial and commercial fuel use by trucks that operated off-road is already estimated in the VIUS-based APPEND module. Industrial and commercial equipment, such as forklifts, sweepers, scrubbers, material-handling equipment, generators, pumps, and welding equipment, also consume motor fuel. Unfortunately, due to the lack of available data on fuel used by engines in the above-mentioned equipment, the IND module only considers non-highway use of trucks in its current calculations. That is, the current version of IND module contains only a single worksheet with data taken directly from the APPEND module. No other computation is needed. Further refinement of this module might be possible if new data sources can be identified. Figure 2-17. Industrial/Commercial Module (" IND ") 2.5.1.6 Aviation Module ("AVI") Data Sources Two major sources of aviation gasoline consumption data are used in this module. The first is the sale of aviation gasoline (in gallons) from Petroleum Marketing Annual, published by EIA. These data were collected monthly by EIA from all firms identified as suppliers who made the first sales of the products. Worksheet-B of the AVI module contains EIA data on aviation gasoline consumption for the analysis year. The second data source is data on hours flown by general aviation in each state from the General Aviation and Air Taxi Activity Survey, conducted annually by the Federal Aviation Administration (FAA). This information is included in Worksheet-A of this module. Estimation Method The estimation procedure for aviation use of gasoline is relatively straightforward. For most states, annual totals from the EIA aviation gasoline consumption data contained in Worksheet-B can be directly carried over to Worksheet-A (Figure 2-18). Due to confidentiality concerns, however, data for some of the states and Washington , D.C. are not disclosed by EIA. Some states withhold only certain months' data, while others (usually around four or five states) will be withheld for the entire year. These missing data (those withheld by EIA) are estimated by FHWA. A statistical regression model has been built into Worksheet-A of the AVI module. This regression model uses a relationship found between existing EIA data on "aviation gasoline consumption" and FAA data on "hours flown by general aviation by states" to estimate gasoline consumption for states that are not disclosed by EIA. Completed estimates for aviation gasoline consumption by all states are included in Worksheet-A of the AVI module. Figure 2-18. Aviation Module ("AVI") 2.5.1.7 Marine Module ("BOAT") Data Sources Since nearly all commercial vessels are powered by diesel fuel, the marine sector of interest for FHWA is recreational boating using outboard motors. Furthermore, it is assumed that recreational boating does not involve the use of gasohol. The fundamental issue here is to determine the number of powered boats in each state and the average amount of fuel each boat uses for recreational purposes. The primary data source used in the BOAT module is a final report compiled from the 1991 National Recreational Boating Survey. This was a major survey of boating co-sponsored by U.S. Coast Guard (USCG) and U.S. Fish and Wildlife Service. Additional data sources used in this module include Boating Registration Statistics published by National Marine Manufacturers Association (NMMA), Boating Statistics published annually by USCG, and the periodical of Sales & Marketing Management. Estimation Method Two worksheets are contained in this module (Figure 2-19). Worksheet-A begins with 1991 as the base-year for the modeling effort because data on the number of powered boats in each state were obtained from the 1991 National Recreational Boating Survey. Using data extracted from the annual Boating Statistics on the number of registered boats by state for the base-year and the latest year, a growth rate for the number of registered boats between these two years can be computed for each state. These growth rates are then applied to the base-year to derive the estimated number of powered boats for the most current year for each state. These calculations, along with the 1991 data and associated estimates, are included in Worksheet-A of the BOAT module. Figure 2-19. Marine Module ("BOAT") Worksheet-B of this module takes results from Worksheet-A to estimate the amount of gasoline used by each state for recreational boating purposes. Using data on the average effective household buying income in each state for both 1991 and the latest year from Sales & Marketing Management, a growth rate of the effective household buying income can be computed for each state. These state-level growth rates are further corrected using the Consumer Price Index (CPI), taken from the Statistical Abstract of the United States, to adjust for inflation in each corresponding year. These adjusted growth rates are then applied to the base-year (i.e., 1991) average annual gallons used per boat to produce estimates for the target year (which is a year behind the analysis year). Finally, the estimated average gallons used per boat is multiplied by the number of powered boats for each corresponding state to obtain an estimated total fuel use in recreational boating for each state. These estimates are adjusted one more time to account for those boats that are powered by fuels other than gasoline (i.e., diesel). This adjustment is made using information on the gasoline/diesel splits obtained from the 1991 National Recreational Boating Survey. This completes the process of the BOAT module. 2.5.1.8 Recreational Module ("OFFROADF") The third part in the estimation process does not fit into either the truck or other equipment categories. Referred to as the OFFROADF module, it estimates the recreational consumption of fuel (gasoline, gasohol, diesel, and special fuels) used by motorized vehicles on recreational trails or backcountry terrain (Figure 2-20). The off-road model used to estimate the total off-road recreational fuel consumption was also developed by ORNL. The method relies on information about the total number of the vehicles of a particular type (i.e., snowmobiles, off-road motorcycles, all-terrain vehicles, and light trucks used off-road) within a state and the average annual fuel used per vehicle. The off-road recreational fuel consumption is estimated by multiplying these two numbers together. Due to a lack of reliable data, currently FHWA does not estimate fuel consumption by small equipment (e.g., lawnmowers, snow blowers, chain saws). These state-level fuel consumption estimates need to be further adjusted because vehicle registration data can be misleading for estimating fuel use by state. A vehicle very likely can be used in a different state from where it is registered. The adjustment to the state shares is based on a factor determined by the amount of rural land in each state. This model has been implemented in a spreadsheet file, OFFROADF, by ORNL. A detailed description of this procedure can be found in the 1999 ORNL report [7]. Figure 2-20. Recreational Module ("OFFROADF") The summary table combines state-level estimates from the above modules into a single table (SUMMARY) to obtain total non-highway gasoline and gasohol consumption, as shown below in Figure 2-21. This includes estimates from Worksheet-D of AGRICULT module (agricultural) and worksheets from the other four modules: CONSTR (construction), IND (industrial and commercial), AVI (aviation), and BOAT (marine - recreational boating). It should be noted that the AGRICULT, CONSTR, and IND modules' estimates are mainly comprised of truck and heavy van fuel use. If a state-submitted number is also available for any of these major use categories, FHWA will evaluate quality of the reported data and compare it to the model-estimated value before accepting the state-reported number. This completes the process of estimating non-highway gasoline consumption. FHWA uses results generated from this annual exercise to compile information presented in Table MF-24 of the annual Highway Statistics. The process of estimating gasoline use by Federal, state, county, and municipal entities requires the FHWA to conduct a different set of analyses, as discussed in the next section. Figure 2-21. Non-Highway Gasoline Consumption ("SUMMARY") 2.5.2 Public Sector Consumption Model A second model necessary to the fuel attribution determination is the Public Use Model. Using Highway Statistics table MV-7 (publicly owned vehicles), the GSA's Federal Motor Fleet Report, percentages of fuel consumption, and population and land area data, the Public Sector Consumption model estimates gasoline consumption by the public sector, which includes Federal, state, county, and municipal governments. At the Federal level, only civilian use of motor fuel is considered (military use is exempted from tax liability). This model creates consistent data for each state that would otherwise be inconsistent due to differing taxation policies. The final estimation of public sector fuel consumption is then used in the Use/User Analysis. As shown in Figure 2-22, the Public Sector Consumption Model is divided into two main parts, the estimation of Federal employees' on-highway motor fuel consumption and state, county, and municipal (SCM) fuel consumption by fuel type and by state. These two components are described in more detail in the following two sections.
Figure 2-22. Public Sector Consumption 2.5.2.1 Process for Estimating Highway Fuel Use by Federal Civilians Data Sources Data used in this part of the public-use model are compiled from various sources, including publications produced by Federal and private organizations. For example, the number of Federally-owned vehicles that are operated by civilian departments and used in each state is obtained from Table MV-7 of Highway Statistics. It should be noted that there is a one-year lag for this publication. Data used in the analysis year will therefore be one year behind. Data on the annual estimates of gallons used per vehicle are obtained from the Federal Motor Fleet Report, published by the U.S. General Services Administration (GSA) [9]. As in the non-highway model, the procedure used for estimating Federal civilian fuel use has been implemented into a Windows-based spreadsheet computer system. These spreadsheet files are designed in such a way that annual updates and analyses can be easily done by FHWA. A user's guide was developed by ORNL, which provides detailed information on the operations of this model [10]. Estimation Method The methodology used in estimating Federal civilians highway use of motor fuel for all states was developed by ORNL in 1992 [8]. This methodology is based on the simple concept of multiplying the number of vehicles by the average gallons consumed per vehicle to derive the total amount of fuel used. This part of the public-use model consists of four modules. The relationships among these modules are presented in Figure 2-22. Unlike the non-highway fuel use model, the estimation process of the Federal-use model is straightforward. It begins with extracting data from Table MV-7 of the latest publication of Highway Statistics to update the worksheet contained in the FEDVEH module. The data of interest is the number of Federally-owned cars/vans, buses, trucks, and motorcycles that are operated by civilian departments and used in each state. The next module is FEDCOEF, which contains two worksheets. Information taken from the latest GSA report [9] is stored in Worksheet-B of this module. It includes data on fuel consumption and average in-use vehicle inventory for various vehicle types (including automobiles, station wagons, ambulances, various truck types, and buses) by Federal agency. Using these GSA data, Worksheet-B derives estimates of per-vehicle fuel consumption (in gallons) for each vehicle type. These estimates are then automatically transferred to Worksheet-A in the same module for further computation needs. Note that GSA data are not separated by fuel type. Additional processing is therefore required in order to generate the needed level of detail. To accomplish this, several parameters needed for distributing fuel consumption into different fuel types, as well as breaking fuel usage into on- and off-highway uses, are included in Worksheet-A of the module FEDCOEF. These parameters (or "coefficients") are estimates obtained from the State-County-Municipal (SCM) part of the model, which is discussed in the SCM section that follows. The third module in the Federal-use model is called FEDCALC. As is explicitly indicated in its module name, this is where the main calculations are performed. FEDCALC combines data from FEDVEH and FEDCOEF to calculate Federal on-highway fuel consumption by vehicle type and by state. Non-highway Federal use by state is then estimated by applying a percentage (taken from the FEDCOEF) to the total on-highway use for each given state. Finally, the FEDMAIN module takes results from FEDCALC and uses parameters from FEDCOEF to further distribute these estimates into gasoline, gasohol, and diesel fuels by state. This ends the process for estimating Federal civilian motor fuel consumption in each state. 2.5.2.2 Process for Estimating Fuel Use by State, County, and Municipal Governments Data Sources The method used in estimating motor fuel uses by state, county, and municipal governments for all states was based on results from a study conducted by ORNL for FHWA in 1994 [11]. It uses population and land-area of a region (e.g., state, county, or city) to estimate fuel used in that region. The basic estimation equations were developed using data collected from a statistical sampling survey of SCM governments in the United States , which was conducted as part of the 1994 study. The SCM part of the public-use model consists of ten modules. Flows between these modules are presented in Figure 2-22. Although the number of modules involved in this model seems large, the methodology is in fact fairly simple and straightforward. Estimation Method Three of the modules, STATE, COUNTY, and CITY, are used to hold population and land-area data for each respective type of geographic region for the analysis year. Module PCOEFcontains parameters (or coefficients) for the regression equations that describe relationships between fuel consumption, population, and land-size for each type of region (i.e., state, county, and city). Detailed technical descriptions of these regression equations and how they were developed can be found in Miaou et al. [11]. PCOEFalso contains several percentages derived from the survey data. These percentages are used in the public-use model to divide the total fuel consumption estimates intoon-highway and off-highway uses, as well as to distribute them among different fuel types. The PCNTYTOT and PCITYTOT modules combine information from PCOEF with populations and land-area data from the COUNTY and CITY modules, respectively, to estimate the total fuel consumption in their respective regions. Results from these modules are then transferred into associated calculation modules, PCAL_CNT and PCAL_CTY, for county and city respectively. With information from PCOEF, PCAL_CNT and PCAL_CTY further break down the total fuel use estimates into on- and off-highway, and then distribute them by fuel type. On the state side, the PCAL_ST module uses data from STATE and PCOEF to estimate total fuel used by the state government. It also uses information from PCOEF to separate the total estimates into on- and off-highway uses, and then to divide them by different fuel types for each state. Finally, the PMAIN module sums the three sets of estimates obtained from PCAL_ST, PCAL_CNT, and PCAL_CTY to produce a set of total SCM estimates. To account for underreporting in certain areas under the SCM sample survey (e.g., school systems), a final adjustment is made to the estimates in PMAIN. This completes the process of estimating public-use fuel consumption. Results from FEDMAIN and PMAIN are automatically entered into other FHWA worksheets through spreadsheet links. These estimates are used in the MF-20 analysis, which is where the FHWA determines whether state-submitted or model-generated data should be used. After all the steps for estimating public and off-highway uses described above have been completed, a final spreadsheet (PUBNONHW) is run, bringing all the relevant data into a summary sheet entitled "Public Use and Private and Commercial Non-Highway Use of Gasoline" for the analysis year. A macro (currently in Lotus and now being converted to Microsoft Excel) then moves this data, state-by-state, to a printed sheet that will be used in the MF-20 analysis. Prior to continuing with the state-by-state analyses, FHWA runs the gasohol model to obtain estimates of on-highway gasohol consumption by state. This gasohol estimation model is discussed in the following section. The Gasohol Model uses information from the Revised 551M Summary as well as from an IRS Module to provide reliable estimations of gasohol consumption for each state, in terms of three blends defined by the Energy Policy Act of 1992 (EPACT) and recognized by the IRS and FHWA: 10 percent, 7.7 percent, and 5.7 percent ethanol by volume. IRS taxes the three different blends of gasohol at different tax rates. This model serves to provide comparable estimates of each blend for each state since the states have a variety of methods of reporting gasohol consumption amounts. Some states report only one type of ethanol, while others do not report any gasohol consumption at all; Washington State is the only state that defines the three types of gasohol in legislation identical to those defined in Federal legislation. Since highway-funding attribution is based on Federal motor fuel tax revenue, FHWA has to determine gasohol revenues attributed to each state using the Federal definition of the three types of gasohol. Data obtained from this process is used in the Attribution of HTF receipts as well as in Highway Statistics Table MF-33E. 2.5.3.1 Data Sources and Revisions to the Model The model for estimating gasohol consumption was developed by Battelle under a contract with FHWA in 1994. The original model was reviewed and updated by Battelle for FHWA in 1999. The purpose of the review was to validate and verify the data as well as to evaluate the goodness of the regression equation used in this gasohol estimation model; specifically, the review evaluated how this equation performed in determining gasohol usage for the states. As a result of this work, the gasohol estimation model was revised. The updated model accurately reflects new data identified during the 1999 study. The screen design of the model (i.e., user-interface) was also updated to improve the ease of transition between data tables maintained by FHWA. The assessment of state data on gasohol, the analysis of the regression equation, and the conclusions drawn from this effort were documented in the 1999 Battelle report, Gasohol Estimation Model Review [12]. Major data sources used in the gasohol estimation model are FHWA Form-551M and IRS quarterly tax revenue data. This model also uses information collected from contacting states through a questionnaire survey conducted as a part of the 1999 model review activity. State responses to this survey are documented and provided in Gasohol Estimation Model Review, State Responses to Questionnaire by Battelle [13]. A general overview of this gasohol estimation model is presented in Figure 2-7. These procedures are discussed below. On a greater level of detail, one can see in Figure 2-23 that the estimation of highway gasohol consumption is divided into two main parts, the ESTNEW module and the IRS module. The main analysis module for the gasohol model, the ESTNEW module, contains the regression model, which enhances the state-reported data quality. The IRS module produces control data for the estimation. "XX" denotes the analysis year (i.e., files used for analysis year 2000 are named ESTNEW00 and IRS00). Figure 2-23. Highway Gasohol Consumption 2.5.3.3 Computing the Control Totals IRS00 contains revenue data collected from IRS-Form 720 (Quarterly Federal Excise Tax Return) for the four quarters in tax-year 2000. As mentioned before, IRS data are available only at the national level. Total quarterly tax liabilities ($) and tax rates on gas-for-gasohol and gasohol-sold, for each of the three types of gasohol, are obtained from IRS and entered into the worksheets in IRS00. This module then computes the total gallons of fuel used quarterly in each blend of gasohol by dividing the tax liability with its corresponding tax rate. Refunds and credits on gasohol are handled in a similar manner. IRS data do not separate refunds and credits by the three blends of gasohol. The shares of refunded or credited tax liability among these three types of gasohol, therefore, are assumed to be the same as the shares calculated from those quarterly reported total tax liabilities. After adjusting amounts associated with refunds and credits, total gallons of ethanol used in gasohol are calculated for each quarter. These quarterly totals are consolidated into an annual national total in the IRS00 module. The gasohol estimation model then applies this number to calibrate the state estimates obtained from the ESTNEW00 module. 2.5.3.4 Use of State-Provided Data FHWA receives the amount of gasohol consumption (in gallons) from states as reported on the FHWA-Form 551M. These data are entered into a worksheet in the ESTNEW00 module as an input to the estimation model. These state-reported gasohol consumption estimates are multiplied by an ethanol adjustment factor to calculate the gallons of ethanol that are used by each state. In general, the ethanol adjustment factor used for most states is 10 percent (i.e., a 10 percent blend). Different adjustments were made to acknowledge under-reporting in some states found by interviews conducted under the 1999 model review effort. Adjustments are also made for states that use more than one blending for gasohol. Finally, this factor is set to 0 for states that are not using gasohol. FHWA then assesses the accuracy of state-reported consumption to select those states that represent accurate reporting of the ethanol used. About 30 states meet the FHWA selection criteria (including states that do not use gasohol). For these selected states, FHWA accepts the state-provided and FHWA-adjusted ethanol gallons as current and accurate. 2.5.3.5 Estimating Ethanol Gallons for Non-selected States The ethanol consumption for states that are not selected by FHWA (i.e., those values that were in question) are estimated using a regression equation. This regression equation was developed by Battelle and revised in 1999. It has been integrated into the current ESTNEW00 module. A brief description of the regression equation is included later in this section. Since ethanol consumption for the nation (from IRS00) and the selected states is known, the total ethanol consumption from those non-selected states can be calculated by simple subtraction. The resulting difference is then used as a control total to adjust the ethanol consumption estimates produced from the regression equation for those non-selected states. More specifically, state-level ethanol consumption estimates produced by the regression equation are added to form a total for these non-selected states. Regression-estimated consumption for each non-selected state is then divided by this total (i.e., sum of all regression-based estimates) to produce a "share" (i.e., percentage of the total) for the state. The control total (i.e., the difference obtained from above) is then distributed to individual states according to these calculated shares. The values from this process are the amount of ethanol consumption estimated for each of the non-selected states. All these computations are done inside the ESTNEW00 module. 2.5.3.6 Estimates of Gasohol Gallons The annual ethanol consumption by state, either from state-provided data or by regression-estimation, is adjusted one more time to determine the total gasohol consumed by each state. This adjustment is done by taking a state's ethanol consumption and dividing it by the state's percentage blends of gasohol (i.e., at 5.7, 7.7, or 10 percent). The percentage blend for each state is provided on FHWA-Form 551M. Many states do not report their percentage blend, however. Data collected from the 1999 Battelle survey is therefore used in the ESTNEW00 module for these states. The following provides the steps for managing and running the model: Step 1: FHWA receives the values of gasohol from each state as reported on the FHWA Form 551M. Steps 2 and 3: The gasohol value received from the state is multiplied by an ethanol adjustment factor to calculate the number of gallons of ethanol that are used by the state. For states that collect ethanol gallons data directly and derive total gasohol gallons assuming a 10 percent blend, the adjustment factor is 10. In aggregate, the default value for most states is 10. However, based on results of the interviews, adjustments were made for acknowledged under-reporting (+ .1 for a small amount, + .5 for a large amount). Adjustments also were made for states that use more than one blending. Step 4: FHWA selects state-provided ethanol gallons values (found in Step 2) that represent accurate reporting of the ethanol used (about 30 states meet this criteria). These ethanol gallons are summed together. Step 5: The values found in Step 4 are subtracted from the Internal Revenue Service (IRS) control total, the known Federal gasohol revenue as reported by IRS. Step 6: The values from the states that are in question (i.e., those states not used in Step 4, and which are known to have some gasohol use) are estimated from the regression equation. This regression equation is currently used to estimate the gallons of ethanol consumed. "Number of ethanol gallons consumed" is the dependent variable, with the following independent variables:
Step 7: Step 6 values are summed, showing the total gallons of ethanol estimated by the regression equation. Step 8: Each individual estimate (from Step 6) is divided by the total calculated in Step 7 to create a percentage of the total. Step 9: The percentage found in Step 8 is multiplied by the IRS difference found in Step 5. The value from this is the gallons of ethanol used by state. Step 10: The ethanol gallon values from Step 9 and Step 3 are divided by the percentage blends to determine a value for gasohol gallons. [1] Farm equipment that operates on diesel fuel is not in-scope here because non-highway-use diesel is dyed and therefore is non-taxable. Moreover, this assumption was made due to data limitations encountered during the model development in 1994. Review of currently used modeling approaches as well as further investigation on new data sources will be conducted in a separate follow-up task. |
||