U.S. Department of Transportation
Federal Highway Administration
1200 New Jersey Avenue, SE
Washington, DC 20590
202-366-4000
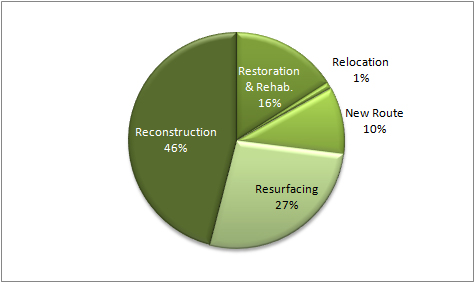
| Restoration & Rehab. | 16% |
|---|---|
| Relocation | 1% |
| New Route | 10% |
| Resurfacing | 27% |
| Reconstruction | 46% |
| Year 2011 = | $17,301,024 |
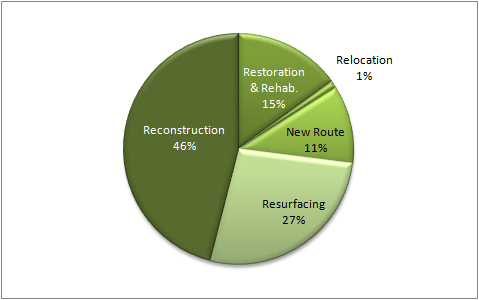
| Restoration & Rehab. | 15% |
|---|---|
| Relocation | 1% |
| New Route | 11% |
| Resurfacing | 27% |
| Reconstruction | 46% |
| Year 2010 = | $22,692,585 |
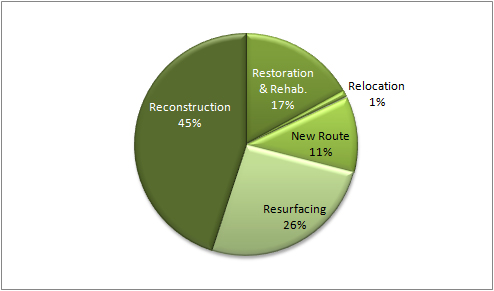
| Restoration & Rehab. | 17% |
|---|---|
| Relocation | 1% |
| New Route | 11% |
| Resurfacing | 26% |
| Reconstruction | 45% |
| Year 2009 = | $31,367,445 |
1/ Data source is the Fiscal Management Information System (FMIS) of the Federal Highway Administration. Major widening is now included in Reconstruction-added capacity. Minor widening is now included in Reconstruction- no added capacity. Reconstruction in these piecharts includes both major widening or minor widening.

