U.S. Department of Transportation
Federal Highway Administration
1200 New Jersey Avenue, SE
Washington, DC 20590
202-366-4000
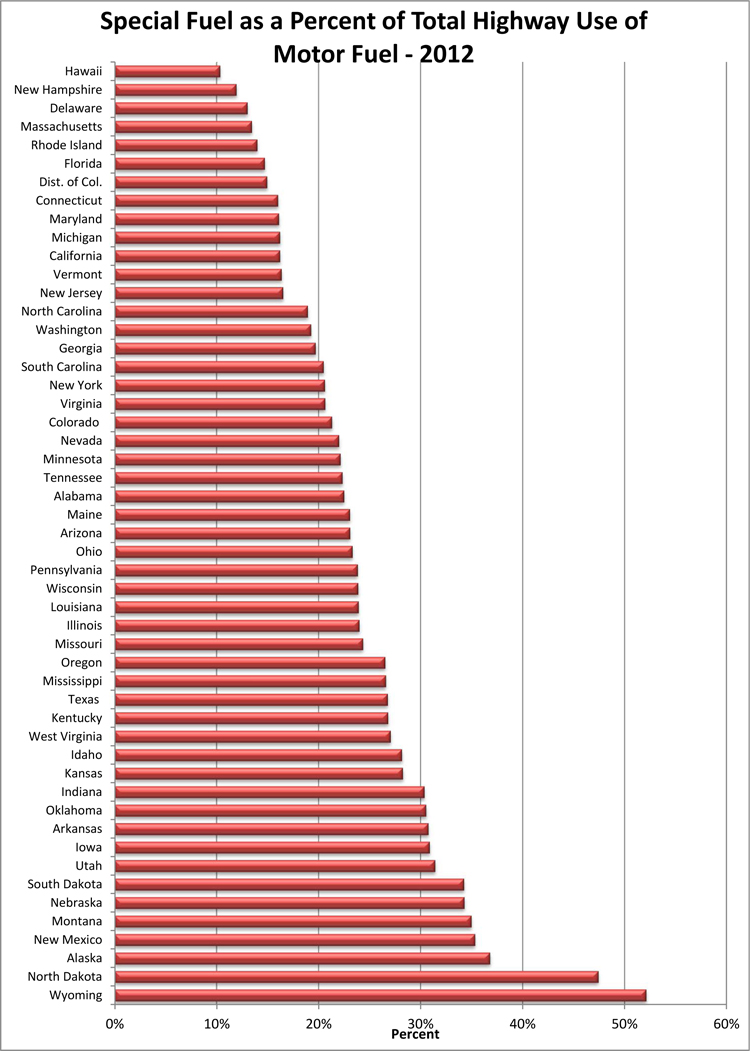
| STATE | % DIESEL |
|---|---|
| Wyoming | 52.11% |
| North Dakota | 47.42% |
| Alaska | 36.79% |
| New Mexico | 35.32% |
| Montana | 34.97% |
| Nebraska | 34.28% |
| South Dakota | 34.24% |
| Utah | 31.40% |
| Iowa | 30.87% |
| Arkansas | 30.74% |
| Oklahoma | 30.52% |
| Indiana | 30.35% |
| Kansas | 28.23% |
| Idaho | 28.14% |
| West Virginia | 27.04% |
| Kentucky | 26.79% |
| Texas | 26.76% |
| Mississippi | 26.57% |
| Oregon | 26.51% |
| Missouri | 24.33% |
| Illinois | 23.97% |
| Louisiana | 23.90% |
| Wisconsin | 23.86% |
| Pennsylvania | 23.81% |
| Ohio | 23.31% |
| Arizona | 23.07% |
| Maine | 23.05% |
| Alabama | 22.48% |
| Tennessee | 22.31% |
| Minnesota | 22.13% |
| Nevada | 21.99% |
| Colorado | 21.29% |
| Virginia | 20.62% |
| New York | 20.60% |
| South Carolina | 20.46% |
| Georgia | 19.69% |
| Washington | 19.24% |
| North Carolina | 18.91% |
| New Jersey | 16.50% |
| Vermont | 16.35% |
| California | 16.20% |
| Michigan | 16.19% |
| Maryland | 16.09% |
| Connecticut | 15.99% |
| Dist. of Col. | 14.92% |
| Florida | 14.69% |
| Rhode Island | 13.96% |
| Massachusetts | 13.44% |
| Delaware | 13.00% |
| New Hampshire | 11.91% |
| Hawaii | 10.33% |

