Performance Evaluation of One-Coat Systems for New Steel Bridges
CHAPTER 2. EXPERIMENTAL PROCEDURES
2.1 COATING SYSTEMS
Table 1 lists the 10 coating systems evaluated in this study, including eight one-coat systems, a three-coat system, and a two-coat system. The selected eight one-coat systems are the most popular generic types currently used for steel bridge protection. Individual coatings and the selection criteria are discussed below.
Table 1. Summary of coating systems.
| System Number |
System ID |
Coating Type |
| Primer |
Intermediate |
Top |
| 1 |
Three-coat |
Zinc-rich epoxy |
Epoxy |
Polyurethane |
| 2 |
Two-coat |
Zinc-rich moisture-curing urethane |
|
ASP |
| 3 |
One-coat1 |
ASP |
| 4 |
Epoxy mastic (EM) |
| 5 |
High-ratio calcium sulfonate alkyd (HRCSA) |
| 6 |
Glass flake reinforced polyester (GFP) |
| 7 |
High-build waterborne acrylic (HBAC) |
| 8 |
WBEP |
| 9 |
SLX |
| 10 |
Urethane mastic (UM) |
Conventional three-coat systems with epoxy zinc-rich primer, an epoxy intermediate coat, and a polyurethane top coat have been used in steel bridges. They have performed well in the field as well as in previous FHWA studies.(10,11) As a result, a three-coat system was used in this study as one of the two controls.
A two-coat system consisting of a zinc-rich moisture-curing urethane primer and a fast drying aliphatic (AL) polyurea urethane top coat was also selected as the other control because it performed well in a previous FHWA study.(4)
ASP is a new type of coating produced by the reaction of ASP ester compounds (a type of secondary AL amine with AL polyisocyanate).(12) This coating system has a different application procedure and performance properties compared to conventional polyureas. It provides
faster drying time, higher film builds than traditional polyurethanes, and high-quality weatherability. ASP can be applied directly to the surface of metal and can provide
excellent corrosion protection.
EM, or aluminum-pigmented high solid epoxy coating, has high build in one coat and may
have more surface contaminant tolerance while requiring less surface preparation prior to application.(13)
Two waterborne coatings, WBEP and HBAC, were also selected for their low flammability,
low odor, and low volatile organic content. Both are fast drying, high film building
coating systems.
HRCSA is an alkaline coating that provides excellent corrosion resistance due to its ability to neutralize acidity by promoting passivity at the steel surface. It is designed to have hydrophobic properties and develop strong ionic bonding with metal substrates. The strong corrosion resistance and high-build properties of HRCSA make it an attractive one-coat candidate. HRCSA exhibited excellent performance as an overcoat system in a previous FHWA study.(13) In this study, HRCSA-coated test panels did not exhibit any rust creepage after 4,000 h of ALT or during 24 months of seaside exposure.
GFP coatings are fast drying, high-build coatings with promising long-term corrosion protection. They have highly desirable properties because glass flakes reduce shrinkage, increase mechanical strength and water resistance, and possess strong chemical resistance.
A relatively new type of coating is SLX, which is typically designed as an organic-inorganic siloxane hybrid binder. SLX typically consists of inorganic silicon-oxygen (Si-O) groups in combination with organic binders. The Si-O group provides excellent weatherability, while the organic counterpart provides corrosion resistance and durability.(14) In an earlier FHWA coating study, a similar type of organic-inorganic hybrid SLX was tested as the top coat of a waterborne inorganic zinc-rich primer, which demonstrated outstanding performance in both laboratory tests and in ME.(11)
UM is a high-solid, high-build acrylic AL urethane system. This high-performing coating has
the advantage of being resistant to water and solvents. The AL feature provides strong UV radiation resistance.
2.2 PREPARATION OF TEST PANELS
Two sizes of steel test panels were used in this study. The small panels were 4 × 6 × 0.2 inches (10 × 15 × 0.48 cm), while the large panels were 6 × 12 × 0.2 inches (15 × 30 × 0.48 cm) (see figure 1 and figure 2). All test panels were blast cleaned to Society for Protective Coatings (SSPC) specification (SP)-10 with measured anchor profiles in the range of 2.2-2.9 mil
(55-72 μm).(15) Coatings were then applied on the cleaned test panels using an airless spray
method by a professional coating laboratory.
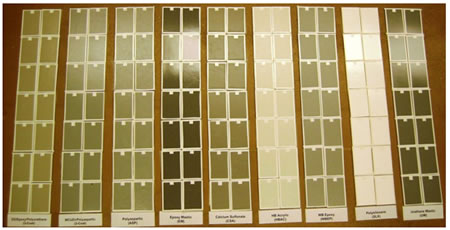
Figure 1. Photo. Composite of small panels.
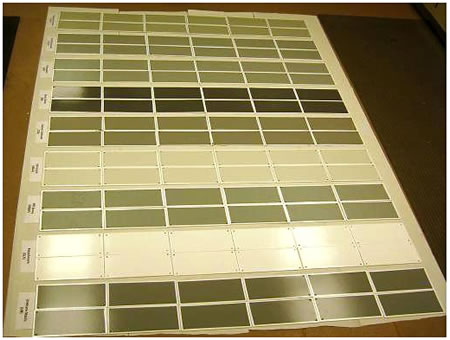
Figure 2. Photo. Composite of large panels.
A total of 222 panels were divided into three groups as shown in table 2. The first group consisted of 54 small panels with each coating system covering six panels that were prepared for ALT. Six additional panels coated with GFP were later included in this group for a total of
60 panels. The second group consisted of 54 small panels that were prepared for oceanfront ME in Sea Isle City, NJ. The third group consisted of 108 large steel panels that were prepared for the outdoor exposure racks at TFHRC. Half of the test panels in each group were scribed diagonally following the instructions specified in ASTM D1654-08, "Standard Test Method for Evaluation of Painted or Coated Specimens Subjected to Corrosive Environments." (16) Figure 3 shows a scribing tool being used at TFHRC. The test panels were scribed 2 inches (50.8 mm) long to study the potential performance of the coating systems at local film damage. The other half of the panels were left unscribed to characterize undamaged conditions and physical properties such as gloss, color, pencil scratch hardness, etc. Two additional panels of each coating system were prepared exclusively for initial adhesion strength and Fourier Transform Infrared Spectroscopy Analysis (FTIR) and were not used in any of the tests.
Table 2. Test panels used for laboratory and outdoor exposure testing.
| System Number |
System ID |
Number of Test Pads |
ALT
(small panels) |
ME
(small panels) |
NW and NWS
(large panels) |
Total |
| Unscribed |
Scribed |
Unscribed |
Scribed |
Unscribed |
Scribed |
| 1 |
Three-coat |
3 |
3 |
3 |
3 |
6 |
6 |
24 |
| 2 |
Two-coat |
3 |
3 |
3 |
3 |
6 |
6 |
24 |
| 3 |
ASP |
3 |
3 |
3 |
3 |
6 |
6 |
24 |
| 4 |
EM |
3 |
3 |
3 |
3 |
6 |
6 |
24 |
| 5 |
HRCSA |
3 |
3 |
3 |
3 |
6 |
6 |
24 |
| 6 |
GFP |
3 |
3 |
0 |
0 |
0 |
0 |
61 |
| 7 |
HBAC |
3 |
3 |
3 |
3 |
6 |
6 |
24 |
| 8 |
WBEP |
3 |
3 |
3 |
3 |
6 |
6 |
24 |
| 9 |
SLX |
3 |
3 |
3 |
3 |
6 |
6 |
24 |
| 10 |
UM |
3 |
3 |
3 |
3 |
6 |
6 |
24 |
| Total |
30 |
30 |
27 |
27 |
54 |
54 |
222 |
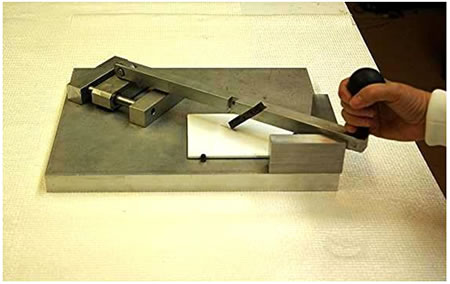
Figure 3. Photo. Example of a scribing tool.
2.3 TEST EXPOSURE CONDITIONS
ALT
The cyclic test method described below was employed in ALT. In total, 19 ALT cycles were conducted for a total test period of 6,840 h. This method is similar to ASTM D5894-05, "Standard Practice for Cyclic Salt Fog/UV Exposure of Painted Metal (Alternating Exposures
in a Fog/Dry Cabinet and a UV/Condensation Cabinet)," with the addition of a freeze cycle
for 24 h.(7)
Each 360-h cycle consisted of the following test conditions in sequence:
-
Freeze for 24 h at -10 °F (-23 °C).
- Undergo UV/condensation for 168 h (7 days).
- Test cycle: 4 h UV/4 h condensation cycle.
- UV lamp: UVA 1.12 × 10⁻⁶ ft (340 nm).
- UV temperature: 140 °F (60 °C).
- Condensation temperature: 104 °F (40 °C).
- Undergo prohesion (cyclic salt-fog test, ASTM G85-09, “Standard Practice for Modified Salt Spray (Fog) Testing”) for 168 h (7 days).(17)
- Test cycle: 1 h wet/1 h dry.
- Wet cycle: A Harrison mixture of 0.35 weight (wt) percent ammonium sulfate and
0.05 wt percent sodium chloride was used. Fog was introduced at ambient temperature.
- Dry cycle: Air was preheated to 95 °F (35 °C) and then purged to the test chamber.
Figure 4 and figure 5 show a salt fog chamber and a weathering tester, respectively. A 16-h salt-fog accumulation test was conducted before each cyclic salt-fog test to check the atomizing and fog quantity as well as the pH of the collected solution. The test panels were evaluated after every test cycle of 360 h and at the termination of each laboratory test.
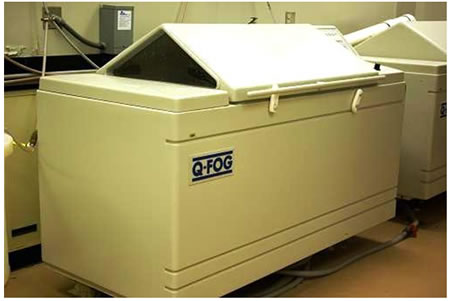
Figure 4. Photo. Salt-fog chamber.
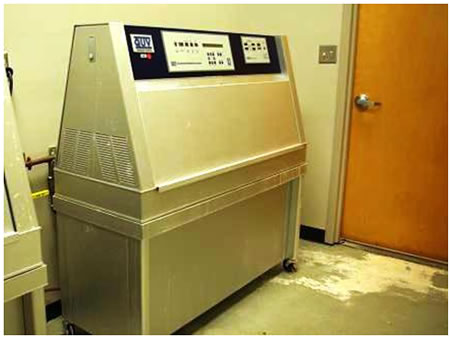
Figure 5. Photo. UV weathering tester.
Oceanfront Exposure
A group of 54 test panels was exposed in Sea Isle City, NJ, at a ME site. All of the test panels were placed on a 45-degree-angle wooden rack facing south as shown in figure 6. The test site is located in a harsh environment with high chloride and high time-of-wetness.(18) Table 3 lists the summary of the environmental factors during the 2-year panel exposure period. The test panels were sent back to TFHRC CCL for performance evaluation every 6 months. The total exposure time was 24 months.
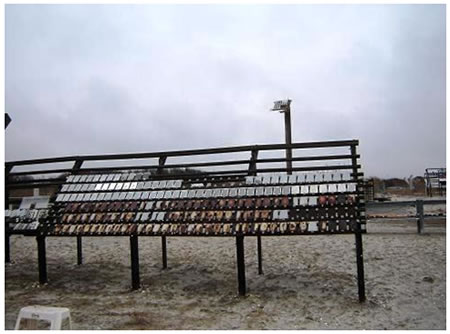
Figure 6. Photo. ME exposure rack in Sea Isle City, NJ.
Table 3. Environmental factors of ME exposure site.
| Environmental Factors |
Measurement |
| Average seawater temperature (°F) |
62 |
| Dissolved oxygen concentration (ppm) |
8 |
| Total rainfall (inches) |
79 |
| Total hours of sunshine |
3,762 |
| Total possible hours of sunshine |
6,857 |
| Atmospheric temperature (average high °F) |
86 |
| Atmospheric temperature (average low °F) |
37 |
| Atmospheric temperature (average °F) |
62 |
| Distance of racks from mean high tide (yard) |
100 |
| Distance of racks from salt marsh (bayside) (yard) |
50 |
NW Test Site at TFHRC
A total of 108 panels (12 panels per coating system) were exposed on two racks (54 panels per rack) at the TFHRC weathering test site in McLean, VA, using wooden racks (see figure 7).
The test panels were placed at a 30-degree angle on two plastic/wooden racks facing south.
The panels on the first rack experienced NW only, and those on the second rack experienced NWS once a day 5 days a week with 15 wt percent sodium chloride solution starting 3 months after initiating the test. The test panels were evaluated every 6 months and at the end of the
18-month test period.
The THFRC exposure site is located in a metropolitan area and was characterized by an annual average precipitation of 32.28 inches (82 cm) in 2007 and 43.31 inches (110 cm) in 2008. Additionally, the annual average salt fall was 0.65 psi (4.48 kPa) chlorine in 2007 and
1.27 psi (8.75 kPa) chlorine in 2008 as measured at the National Oceanic and Atmospheric Administration (NOAA) National Atmospheric Deposition Program/National Trends Network site in Beitsudle, MD. The average annual temperature was 55.4 °F (13°C) in 2007 and 56.5 °F (13.6 °C) in 2008 as measured at a nearby NOAA weather station.
2.4 COATING CHARACTERIZATION TESTS AND PERFORMANCE EVALUATION TECHNIQUES
A series of characterization tests was conducted on the wet coating and dried test panels before ALT and the outdoor exposure tests. The performance of these coating systems in terms of surface defects, rust creepage, and physical and chemical property changes was evaluated during the tests and soon after completion of the tests.
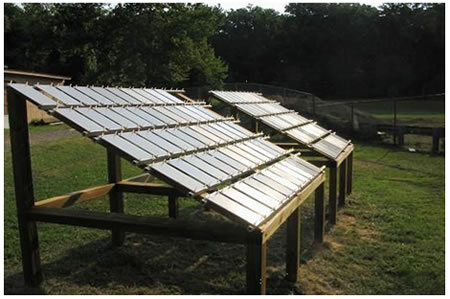
Figure 7. Photo. Mild NW exposure rack at TFHRC
Volatile Content and Solid Content
The volatile and solid content of each of the one-coat systems were obtained following ASTM D2369-10, "Standard Test Method for Volatile Content of Coatings." (19) A sample of certain weight was heated to evaporate volatile components. Volatiles of the coating materials were then calculated from weight loss after heating the raw coating samples. The weight percentage of the solid was calculated by dividing the weight of the solid left after heating by the weight of the coating sample. Two replicates were tested for each coating system, and the mean value was reported.
Pigment Content
The pigment content of each solvent-based one-coat system was determined following
ASTM D2371, "Standard Test Method for Pigment Content of Solvent-Reducible Paints." (20) The pigment fractions were isolated from coating materials by a centrifuge. The solvent used for centrifuge extraction was a mixture of methyl ethyl ketone and toluene in a volume ratio of 1:1. The isolated pigment was then heated to dry. The pigment content was calculated by dividing the pigment weight by the sample weight. The pigment content of two waterborne coatings, HBAC and WBEP, was determined following ASTM D3723-05e1, "Standard Test Method for Pigment Content of Water-Emulsion Paints by Low-Temperature Ashing." (21) The weighed coating sample was added and dispersed in an aluminum dish containing a few milliliters of deionized water. The dish with the sample was initially heated to 221 °F (105 °C) for 1 h followed by another heat treatment at 842 °F (450 °C) for 1 h to burn out the organic binder. The pigment content was then calculated by dividing the solid weight left after heating by the weight of coating sample. Two replicates were tested for each coating system, and the mean value
was reported.
Elemental Pigment Analysis
The elemental content of extracted coating pigment in each coating system was analyzed using scanning electron microscopy/energy dispersive x-ray spectrometry technique (SEM/EDS). Characteristic x-rays are produced when a material is bombarded with electrons in SEM. EDS detects the emitted x-rays and converts them into a series of peaks representative of the type and relative amount of each element in the sample. A quantitative analysis method with standards was used to obtain the relative amount of each element in the extracted pigments of the
one-coat systems.
These preliminary analyses were conducted to screen the elements present in each of the one-coat systems. A series of standard pellets with material containing the detected elements was made and used as calibration standards. Standard pellets were made by weighing and mixing
the chemicals containing the detected elements, using a mortar and pestle, and compacting the mixture powders using a hand press. Test samples were also grinded and pressed into pellets
for quantitative analysis of EDS. Figure 8 shows a sample grinding tool and hand press kit.
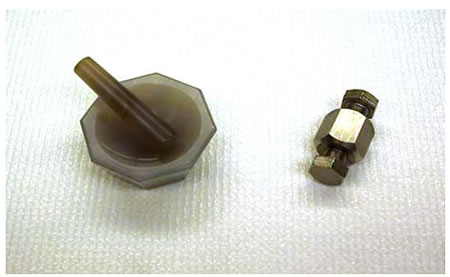
Figure 8. Photo. Simple grinding tool and hand press kit.
It is important to note that even after calibration with standards, the amount of each element determined from SEM/EDS analyses was semiquantitative because of the limitation of the EDS technique and the practical limitation of users when making qualitatively similar standards.
FTIR Analysis
FTIR spectra of the test panels were obtained before and after the laboratory testing and outdoor exposure. FTIR produces an absorption spectrum that provides information about the chemical bonds and functional groups present in the molecules. Typically, a FTIR spectrum is equivalent to the "fingerprint" of the material and can be compared with cataloged FTIR spectra to identify the chemical composition of the material.
Samples for analysis were collected from the surface of coating panels using a knife scratch technique. Single reflection horizontal attenuated total reflectance spectra were obtained using
a diamond accessory. Two samples for each coating system were collected from the unscribed test panels. The relative amount of aromatics to aliphatics (AR/AL) of binder was estimated
from the ratio of the peak area at a wave number of 3,100 cm-1 to that at a wave number of 3,000-2,800 cm-1. The reported AR/AL ratios were the mean value of the data obtained from
two replicates. Top coat samples were collected and analyzed for the two-coat and three-coat systems by carefully scratching the top coat layers.
Sag Resistance
Sag resistance of the coatings was determined following ASTM D4400-99, "Standard Test Method for Sag Resistance of Paints Using a Multinotch Applicator (Method A-Horizontal Test Method)." (22) Coating was applied to a test chart with a multinotch applicator and was hung vertically with the drawdown strips horizontal and the thinnest strip at the top. Drawdown was examined after drying, and it was rated for sagging.
Drying Time
Drying time of the coatings was determined using ASTM D1640-03, "Standard Test Methods for Drying, Curing, or Film Formation of Organic Coatings at Room Temperature." (23) Coating with manufacturer-recommended wet film thickness was placed on clean glass plates using a doctor blade. Dry-to-touch time was determined by lightly touching the film using a finger, immediately placing the finger against a piece of clean and clear glass, and examining the glass for any paint that was transferred. The dry-through (or dry-to-handle) time was determined by firmly pressing the film using a thumb and visually inspecting the film to see if it exhibited any wrinkling or physical damage. The sampling plates were placed in a walk-in environmental chamber immediately after the film was placed. The temperature and the relative humidity of the environmental chamber were 77 ±33.8 °F (25 ±1 °C) and 50 ± 2 percent, respectively.
Dry Film Thickness (DFT)
DFT of the coatings was measured before ALT and the outdoor exposure tests using an electronic gauge using the SSPC paint application SP-2, "Measurement of Dry Coating Thickness with Magnetic Gauges." (24) Three DFT spot readings were obtained from each one of the test panels. Additionally, three spot readings for each of the small test panels and six spot readings for each of the large test panels were obtained. The reported DFT of each coating system was the mean of the data obtained from all of the test panels.
Gloss
Gloss is the perception of a shiny surface by human eyes. Specular gloss compares the luminous reflectance of a test specimen to that of a standard specimen under the same geometric condition.(25) Measurements by this test method correlate with visual observations of surface shininess made roughly at the corresponding angles. Measured gloss ratings are obtained by comparing the specular reflectance from the specimen to that from a black glass standard. The measured gloss ratings change as the surface refractive index changes because specular reflectance depends on the surface refractive index of the specimen.
Gloss of all of the one-coat system coatings was measured following ASTM D5230-08, "Standard Test Method for Specular Gloss." (26) The 60-degree geometry measurements were conducted on the selected unscribed test panels prior to laboratory and outdoor exposure tests. Three gloss readings for each of the small test panels and six readings for each of the large test panels were recorded. The reported gloss of each coating system per test condition was the mean of the readings obtained from all unscribed test panels.
Color
The color of the coatings was measured using a 45-degree/zero-degree colorimeter following ASTM D2244-09A, "Standard Test Method for Calculation of Color Differences from Instrumentally Measured Color Coordinates." (27) This technique is based on the calculation from instrumentally measured color coordinates based on daylight illumination of color tolerances and small color differences (ΔE) between opaque coated panels. The International Commission on Illumination (CIE) lab color system (CIE (L*, a*, b*)) was used for color measurement. L*, a*, and b* represent the three coordinates of the three-dimensional lab color space. These parameters are defined based on the following high and low values they represent to identify colors:
- L* = 0 represents black, and L* = 100 represents diffuse white.
- Positive values of a* indicate green, and negative values indicate magenta.
- Positive values of b* indicate blue, and negative values indicate yellow.
- The asterisk (*) is used to differentiate the CIE (L*, a*, b*) system from (L, a, b) parameters of the original Hunter 1948 color space.
Colors were measured for unscribed test panels only before and after ALT and the outdoor exposure tests. Three color readings were obtained for each of the small test panels, and six color readings were obtained for each of the large test panels. E of the test panels before and after the test was calculated using the following equation:
ΔE=[(ΔL*)2 + (Δa*)2 + (Δb*)2]1/2
Where:
ΔL* = L* after test - L*before test-
Δa* = a* after test - a*before test-
Δb* = b* after test - b*before test-
The data used in the above equation were the mean of the data obtained from all the unscribed test panels of each coating system.
Pencil Scratch Hardness
The pencil scratch hardness of all coating systems was determined following ASTM D3363-05, "Standard Test Method for Film Hardness by Pencil Test." (28) In this test, a pencil hardness gauge installed with pencils of various grades of hardness was used to scratch the coating film. The grade of the hardest pencil that did not scratch the film was referred to as the pencil scratch hardness of the particular coating system. Two unscribed test panels of each coating system were tested before and after ALT and the outdoor exposure tests. The mean of the two readings was used as the nominal hardness of a coating system.
Adhesion
The adhesion strength of the coating systems was determined using the pull-off adhesion testers following ASTM D4541-09, "Standard Test Method for Pull-Off Strength of Coatings Using Portable Adhesion Testers." (29) A loading fixture, commonly known as a dolly or stub, was affixed to the panel surface by an adhesive. A load provided by the adhesion tester was increasingly applied to the dolly until it was pulled off. The force required to pull the dolly off yielded the tensile strength in pounds per square inch or megapascals. Failure occurs along the weakest plane(s) within the testing system comprised of the dolly, adhesive, individual layers of the coating system, and substrate.
The surface of coated test panels and the base of the dollies were cleaned with detergent water and were lightly roughened with an abrasive pad. The dollies were glued to the test panel surface using a high-strength epoxy adhesive. The cut through the coating around the edge of the dolly was performed using a drill press after the complete cure of the adhesive shown in figure 9. The initial adhesion strength was measured by two pull-off methods: the hydraulic method and the pneumatic method. The final adhesion strengths of coating systems were measured using the hydraulic method. Figure 10 shows the hydraulic adhesion tester used to pull off the dollies for adhesion strength testing. Three pull-off adhesion tests were performed after exposure on each test panel except for some UM and ASP test panels due to their severe surface failures after ALT. No adhesion tests were performed on scribed UM and ASP test panels, while two adhesion tests were performed on unscribed UM panels.
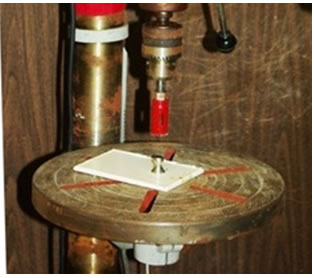
Figure 9. Photo. Drill press to score a test area around a dolly.
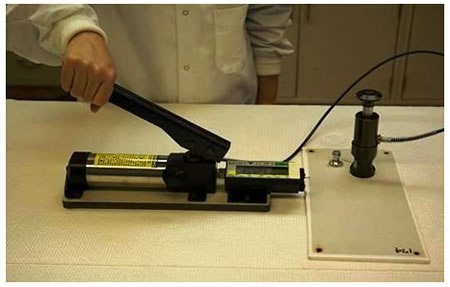
Figure 10. Photo. Hydraulic adhesion tester.
For every panel, the average adhesion strength of three locations was calculated. If the coefficient of variance (CV) of each test panel was more than 20 percent, the test panel and adhesion failure mode were carefully examined to see if the variation was caused by test operation. Repeat tests were performed for quality assurance. If more than 50 percent of a glue failure occurred, the test was repeated. The reported adhesion strength for each coating system was the mean of the data obtained from tests conducted on all test panels of the coating system. The remaining DFT at the pull-off spots was measured and recorded. The adhesion failure mode of every spot was also documented using digital photographs.
Detection of Coating Defects
The coating defects were identified using ASTM D5162-08, "Standard Practice for Discontinuity (Holiday) Testing of Nonconductive Protective Coating on Metallic Substrates." (30) This technique utilizes a low voltage holiday detector to determine the presence of electrically conductive coating defects including holidays and pinholes (invisible defects), voids, and metal particles protruding through the coating. The reported number of defects after each test cycle was the cumulative number of defects. In addition to using a holiday detector to determine the number of such defects, test panels were visually examined using ASTM D714-02, "Standard Test Method for Evaluating Degree of Blistering of Paints" and ASTM D610-08, "Standard Test Method for Evaluating Degree of Rusting on Painted Steel Surfaces." (31,32) The reference standards were employed to grade the rust pits and surface blisters on the panels.
Digital Microscopic Examination
When unusual surface failures were detected by the holiday detector, the panels were examined using a stereomicroscope or a high-power digital microscope. The surface conditions were documented via microphotographs.
Digital Photography
Every test panel was photographed to document initial surface conditions before initiating the tests. The test panels were also photographed after each test cycle for both ALT and the outdoor exposure tests.
Rust Creepage Measurement
The rust creepage at the scribe was measured following ASTM D7087-05A, "Standard Test Method for An Imaging Technique to Measure Rust Creepage at Scribe on Coated Test Panels Subjected to Corrosive Environments." (33) The rust creepage area from the scribe line on the coating panel was traced using a thin marker and a transparent plastic sheet. The tracing image was scanned and analyzed using imaging software to obtain the creepage areas and the creepage distances. Two traces for each test panel were obtained, and the mean creepage distance was reported as the nominal creepage for the coating system.
Electrochemical Impedance Spectroscopy (EIS)
The impedance of the coating systems was measured using an electrochemical instrument equipped with a potentiostat. This technique involves applying a small amplitude alternating current signal into a body of material over a wide range of frequencies and measuring the responding current and its phase angle shift. The output from the EIS instrument is an impedance spectrum of the material, typically ranging from 100 to 0.001 Hz. EIS data are analyzed by the equivalent circuit modeling technique, which can produce appropriate models to evaluate the coating deterioration process. The mechanism of corrosion occurred at the interface between the substrate and the coating.
Linear Regression Analysis
Correlation among test parameters, such as color or gloss, for the tested coating systems can aid in developing one or more relationships that can provide better understanding of interactions among test variables. This correlation would be specific to the type of exposure condition involved such as ALT or outdoor exposure testing.
Another type of relationship that could be understood with numerical correlation is how variation of performance evaluation parameters, such as color or gloss, with time in one exposure condition compares to the variation of the same parameter in another exposure condition. One such example would be to correlate color variation in ALT with color variation in an outdoor exposure condition. This type of correlation can help explain how one exposure condition would compare to or simulate the other.
Regression analysis has been performed on the performance data of all of the one-coat systems to identify and understand the above relationships. Panels with the GFP coating system were not available for outdoor testing; therefore, the GFP system was excluded from regression analysis.
Exposure Conditions
The following exposure conditions were employed to evaluate the performance of the
10 coating systems:
|


