U.S. Department of Transportation
Federal Highway Administration
1200 New Jersey Avenue, SE
Washington, DC 20590
202-366-4000
Federal Highway Administration Research and Technology
Coordinating, Developing, and Delivering Highway Transportation Innovations
 |
| This report is an archived publication and may contain dated technical, contact, and link information |
|
Publication Number:
FHWA-RD-03-089
|
Previous | Table of Contents | Next
In this project, four bents of three east Texas highway bridges were tested with modal vibration. The Trinity River Relief Bridge Number 4, located on old U.S. Highway 90 east of Houston near Liberty, TX, was a common type of flat concrete slab bridge built in the 1920s. The Texas DOT (TxDOT) was in the process of demolishing and replacing the bridge because of excessive differential settlements, which provided an excellent opportunity to investigate the bridge substructure’s response to the effects of simulated scour and seismic events through dynamic modal vibration. After testing the initially sound pile bent substructures, the testing was accomplished by intentionally excavating soil from around selected piles to simulate scour, and then breaking piles and piles with footing foundations to simulate earthquake damage.
Two newer prestressed concrete slab-on-girder bridges that cross Texas State Highway 6 near College Station and Bryan, TX, also were included in the research. The Woodville Road Bridge and the Old Reliance Road Bridge are typical of 1960s bridge construction in the United States based on of the American Association of State Highway Officials (AASHO) standard 1965 specifications. These two bridges are similar in structural design except for different foundation types. The Woodville Road Bridge has a concrete spread footing; the Old Reliance Road Bridge has steel piles below a concrete pile cap. Thus, testing for this project included both an old and two newer bridges and shallow and deep foundations. The following section discusses bridge details for the three test bridges.
The Trinity River Relief Bridge, located on U.S. Highway 90 just west of Liberty, TX, was built in the 1920s. It consisted of four bridge structures. For this testing, a Vibroseis truck belonging to the Geotechnical Engineering Center of the University of Texas at Austin was used to excite the bridge substructures with vertical vibration force. Bents 2 and 12 of the western-most relief structure 4 were selected for dynamic testing. Figure 3 shows the Vibroseis truck over bent 2. At the time of these field tests, the bridge structure was being demolished and replaced because of excessive differential settlements of the concrete pile foundations, as shown in figure 4.
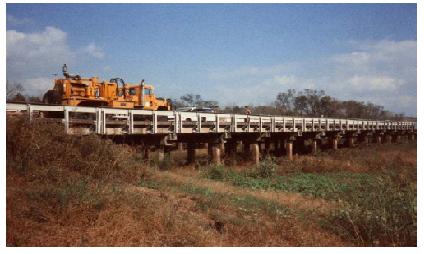
Figure 3. Photo. Relief structure 4 of the Trinity River Relief Bridge with the Vibroseis truck over bent 2.
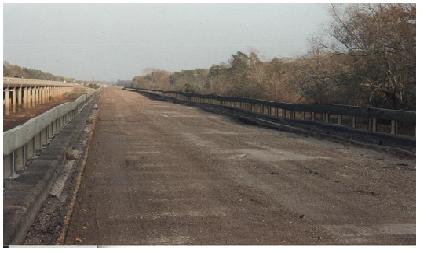
Figure 4. Photo. Excessive differential settlements on relief structure 4, Trinity River Relief Bridge.
Relief structure 4 had a 6.1-meter (m) (20-foot (ft))-wide roadway. The structure consisted of 151 reinforced concrete slab panels directly supported by 66 concrete pile bents with spans of 5.49 m (18 ft). The nominal thickness of these concrete slab panels was 0.41 m (1.34 ft). The concrete slabs were reinforced with number 7 steel bars at a spacing of 1.53 m (5.02 ft) in the longitudinal direction and number 4 steel bars at a spacing of less than 0.61 m (2 ft) in the transverse direction. The concrete panels had one fixed end and a free expansion end, resulting in both fixed and roller connections sitting on each intermediate bridge bent. The asphalt topping had been removed to the concrete slab level at the time of the field tests.
Bents 2 and 12 were tested because they had the same superstructures with different foundation types. Bent 2 was the second pile bent to the east from the west abutment of relief structure 4. Bent 2 was composed of a concrete beam cap supported by four concrete piles with a concrete strip footing that had been added at ground level in an attempt to minimize further differential settlement. The beam cap on top of the 7.63-m (25-ft)-long piles was 7.17 m (23.52 ft) by 0.61 m (2 ft) by 0.737 m (2.42 ft) (length by width by height) while the pile/columns had a cross section of 0.356 m (1.17 ft) by 0.356 m (1.17 ft). The beam cap was reinforced longitudinally with seven number 7 steel bars, while there were number 4 steel stirrups at spacing of 0.458 m (1.5 ft) in the transverse direction. The concrete pile/columns spanned 1.93 m (6.33 ft) symmetrically. Each pile/column had four number 8 steel bars at four corners of its cross section with number 2 steel hoops at variable spacing from 5.08 to 15.24 centimeters (cm) (2 to 6 inches) along the column. The pile/column length between the top of the concrete strip footing and the bottom of the concrete beam cap was 2.21 m (7.25 ft). A 7.08 m (23.22 ft) by 1.22 m (4 ft) by 0.61 m (2 ft) (length by width by thickness) concrete strip footing surrounded the four concrete piles. No concrete reinforcing details were available for the concrete strip footing. Below the concrete strip footing, the four concrete piles continued. The concrete piles had a 0.356-m by 0.356-m (14-inch by 14-inch) square cross section at the top by the beam and tapered to 0.203-m by 0.203-m (8-inch by 8-inch) square cross section at the pile tip. The details of bent 2 are illustrated in figure 5. (Figure 5 reflects the excavation of the piles that is described in chapter 4, and it does not show the concrete footing that was just below ground level.) The embedded length of the concrete piles was 4.80 m (15.74 ft) from the bottom of the concrete strip footing to the concrete pile tips for a total pile/column length of 7.63 m (25 ft).
Bent 12 was the twelfth pile bent to the east from the west abutment of relief structure 4. Bent 12 had the same structural components as bent 2, except there was no concrete strip footing at ground level. As a result, the exposed pile/column length between the ground level and the bottom of the beam cap was 2.14 m (7 ft), and the embedded length of the concrete piles was 5.49 m (18 ft) from ground level to the pile tips—a total length of 7.63 m (25 ft).
Figure 5. Diagram. Geometric details of bent 2, structure 4, of the Trinity River Relief Bridge.
Construction design details for the mid-1920s bridge called for steel in tension to be designed for a working stress of 110,240 kilopascals (kPa) (16,000 poundforce per square inch (lbf/inch2, or psi) while concrete in compression was designed to have a working stress of 4,479 kPa (650 psi). The concrete mixture designs were 1:2:4 with maximum aggregate of 2.54 cm (1 inch) for beam caps and slabs and 1:2:3 with maximum aggregate of 1.905 cm (0.75 inch) for columns and piles. The concrete of bents 2 and 12 showed little deterioration after more than 70 years of service, and only minor cracks and honeycombing were observed at the time of field tests.
Field ultrasonic pulse velocity (UPV) tests on bent 12 for this project revealed an average pulse velocity of 4,148 meters per second (m/s) (13,600 feet per second (ft/s). Assuming normal weight concrete, about 2,323 kilograms per cubic meter (kg/m3) (145 pounds per cubic foot (lb/ft3)), and a Poisson’s ratio of 0.25, this velocity corresponds to a Young’s modulus of 33.07 E+6 kPa (4.8 E+6 psi). See the UPV method in the American Concrete Institute (ACI) Manual of Concrete Practice.(132)
The seismic properties of the subsurface soils of all three bridges were investigated with the spectral analysis of surface wave (SASW) method at the time of field tests for this project. The seismic velocity data were used in dynamic modeling studies. The method is illustrated in figure 6, and a photo of the testing is shown in figure 7. The ACI Manual of Concrete Practice also gives details on the SASW method.(132)
Figure 6. Diagram. SASW method.
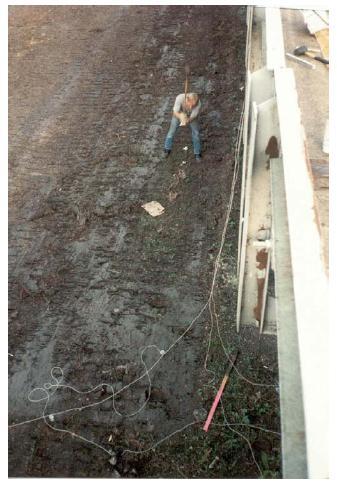
Figure 7. Photo. SASW tests at bent 12, structure 4, Trinity River Relief Bridge.
SASW tests involve measuring the variation of surface wave velocity versus wavelength (the dispersion curve) without drilling borings. The SASW experimental results were theoretically matched using the WinSASWsoftware of the Geotechnical Engineering Center of the University of Texas at Austin. The soil layer thickness and shear and compression wave velocity profiles were determined from this theoretical matching for use in modeling of the bents. The SASW results indicated that the shear wave velocity profile consists of four soil layers with shear wave velocities varying from 76.25 m/s (250 ft/s) to 244 m/s (800 ft/s). Based on the SASW results and assumed values of Poisson’s ratio and density for the clay soils, the shear wave velocity profile was determined. The results are shown in table 1.
Table 1. Shear wave velocity profile results from the Trinity River Relief Bridge site.
| Soil Shear Wave Velocity from WinSASW Model (m/s (ft/s)) | Layer Thicknesses from Ground Level with Increasing Depth (m (ft)) | Unit Weight (kg/m3 (lb/ft3)) | Assumed Value of Poisson’s Ratio |
|---|---|---|---|
| 76.2 (250) | 1.8 (6) | 1762 (110) | 0.35 |
| 121.9 (400) | 2.4 (8) | 1842 (115) | 0.35 |
| 213.4 (700) | 2.4 (8) | 1922 (120) | 0.30 |
| 243.8 (800) | 3.0 (10) | 1922 (120) | 0.30 |
Woodville Road Bridge crosses Texas State Highway 6 between College Station and Bryan in Brazos County, TX. Built in the 1960s, it consists of four bridge spans with an equal span length of 24.4 m (80 ft). The first intermediate bent from the southwest end of the bridge, illustrated in figure 8, was selected for dynamic testing. At the time of field tests, this four-lane bridge carried two lanes eastbound and two lanes westbound over State Highway 6.
The Woodville Road Bridge has a 7.93-m (26-ft)-wide roadway; its superstructure consists of a 16.51-cm (6.5-inch)-thick reinforced concrete slab supported by four prestressed concrete I girders for each span. The spacing between two adjacent girders at each span is 2.24 m (7.35 ft). For each span, the reinforced concrete slab is constructed compositely with the four prestressed concrete girders, but four span composites of the slab and the girders are separated from each other at the three intermediate bents. The prestressed concrete girders are 1.07 m (3.5 ft) high and 0.560 m (1.84 ft) wide with a 20.32-cm (8-inch)-wide web and two 19.05-cm (7.5-inch)-thick flanges. There are two end diaphragms and two interior diaphragms for each span. The interior diaphragms are posing at one-third points of the spans. The prestressed concrete girders are resting directly on the beam caps through polystyrene bearing pads. The extension of the girder ends into the beam caps is 0.267 m (10.5 inches); therefore, the connections between the bents and the girders can be modeled as pinned ends.
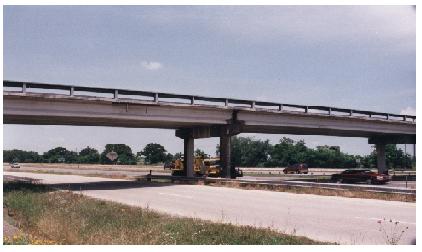
Figure 8. Photo. Western pier of the southwestern span of the Woodville Road Bridge.
The tested bent is composed of a reinforced concrete beam cap supported by two concrete columns with two concrete spread footings at approximate 1.83 m (6 ft) below the ground level. The concrete beam cap is 7.7 m (25.5 ft) by 0.839 m (2.75 ft) by 0.839 m (2.75 ft) (length by width by height); the two concrete columns have a cross section 0.763 m (2.5 ft) in diameter. The concrete beam cap is reinforced longitudinally with four number 11, eight number 10, two number 9, and two number 5 steel bars; there are number 5 steel stirrups at variable spaces from 12.7 cm (5 inches) to 0.407 m (1.33 ft) in the transverse direction. The two concrete pier columns are spaced 4.88 m (16 ft) apart. Each concrete column has eight number 9 steel bars in the vertical direction with a number 3 spiral at a 15.24-cm (6-inch) pitch along the concrete column. Each concrete column extends at least 0.686 m (2.25 ft) into the concrete beam cap, creating a fixed connection between the concrete column and the concrete beam cap. The concrete column length between the top of the concrete spread footing and the bottom of the concrete beam cap is 6.38 m (20.93 ft), but the distance between the bottom of the concrete beam cap and ground level is about 4.58 m (15 ft). The column axial design load is 128,936 kg (284,000 lb) per column. The concrete spread footings are 2.14 m (7 ft) by 2.14 m (7 ft) square reinforced concrete with a thickness of 0.763 m (2.5 ft). For each concrete spread footing, there are seven number 9 steel bars in each direction on the bottom. Eight number 9 steel bars extend 0.864 m (2.83 ft) from the concrete footing bottom into the concrete column. These dowels are bent to 90 degrees and extend 0.43 m (1.42 ft) horizontally away from the concrete columns. As a result, the concrete spread footing can be considered as having a fixed connection with the concrete columns.
This bridge was designed according to AASHO 1965 standard specifications and interim revisions. All concrete was designed to be Class C; however, no field measurements for construction material properties were conducted for this bridge.
The soil layer profiles at the Woodville Road Bridge were investigated by the SASW method at the time of field tests for this project. Based on the SASW results and assumed values of the Poisson’s ratio and density for the clay to sand soils, the shear wave velocity profile was determined as shown in table 2. The SASW results indicated that the shear velocity profile consisted of five soil layers with the shear wave velocities of soil varying from 122 m/s (400 ft/s) to 366 m/s (1,200 ft/s).
Table 2. Shear wave velocity profile results from the Woodville Road Bridge site.
| Soil Shear Wave Velocity from WinSASW Model (m/s (ft/s)) | Layer Thicknesses from Ground Level with Increasing Depth (m (ft)) | Unit Weight (kg/m3 (lb/ft3)) | Assumed Value of Poisson’s Ratio |
|---|---|---|---|
| 137.2 (450) | 0.6 (2) | 1602 (100) | 0.35 |
| 243.8 (800) | 2.4 (8) | 1842 (115) | 0.35 |
| 121.9 (400) | 2.4 (8) | 1602 (100) | 0.35 |
| 274.3 (900) | 6.1 (20) | 1922 (120) | 0.30 |
| 365.8 (1,200) | 6.1 (20) | 2002 (125) | 0.28 |
The Old Reliance Road Bridge is similar to the Woodville Road Bridge except that Old Reliance has steel pilings under the intermediate bents below concrete pile caps. This bridge is also located on State Highway 6 between College Station and Bryan in Brazos County, TX. This 7.93-m (26-ft )-wide bridge, built in the 1960s, consists of four bridge spans. Two end spans are 18.3 m (60 ft) long; the two center spans are 30.5 m (100 ft) long. The first intermediate bent from the northeast end of the bridge was selected for dynamic testing. At the time of field tests, this four-lane bridge carried two lanes eastbound and two lanes westbound over State Highway 6. The bridge is shown in figure 9.
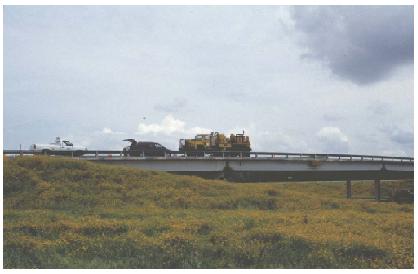
Figure 9. Photo. Vibroseis truck over the east pier, Old Reliance Bridge.
The bridge superstructure consists of a 16.51-cm (6.5-inch)-thick reinforced concrete slab supported by four prestressed concrete girders for each span. The spacing between two adjacent girders at each span is 2.26 m (7.41 ft). The abutments and intermediate bents are skewed by 15 degrees from being transverse to the traffic direction. For each span, the reinforced concrete slab is constructed compositely with the four prestressed concrete girders, but the four span sections of the slab and the girders are separated from each other by joints at the three intermediate bents. The prestressed concrete girders are 1.37 m (4.5 ft) high and 0.381 m (1.25 ft) wide. Two end diaphragms for each span are parallel to the abutments and the intermediate bents, but the interior diaphragms for each span are perpendicular to the roadway; they have a 15-degree skew to the abutments and the intermediate bents. The two interior diaphragms for the 18.3-m (60-ft) end spans are at the one-third points of the spans, while the three interior diaphragms for the 30.5-m (100-ft) center spans are at the one-quarter points of the spans. The prestressed concrete girders are resting directly on the concrete beam caps through polystyrene bearing pads. The extension of the prestressed concrete girder ends into the concrete beam caps is 26.7 cm (10.5 inches); therefore, the connections between the intermediate bents and the prestressed concrete girders can be modeled as pinned ends.
The tested bent is composed of a reinforced concrete beam cap supported by two concrete columns with deep foundations. The concrete beam cap is 8.08 m (26.5 ft) by 0.839 m (2.75 ft) by 0.839 m (2.75 ft) (length by width by height), while the two concrete columns have a 0.763-m (2.5-ft)-diameter cross section. The concrete beam cap of the Old Reliance Road Bridge has the same structural design as that of the Woodville Road Bridge except that the concrete pier columns are supported by concrete pile caps on 10 steel pilings per column. The concrete column length between the top of the concrete footing and the bottom of the concrete beam cap is 5.82 m (19.1 ft), but the distance between the bottom of the concrete beam cap and the ground level is about 4.73 m (15.5 ft). The nominal designed column axial loading is 128,936 kg (284,000 lb) per column. The concrete pile caps are 1.98 m (6.5 ft) by 2.23 m (7.5 ft) T-shaped (in plan view) reinforced concrete with a thickness of 0.763 m (2.5 ft). Eight number 9 steel bars extend 0.864 m (2.83 ft) from the concrete footing bottom into the concrete column; therefore, the concrete pile caps can be considered as having a fixed connection with the concrete columns. The steel pilings underneath the concrete footings are HP (bearing piles) 12 by 53 piles with varying lengths from 6.1 m (20 ft) to 7.47 m (24.5 ft). The properties of the HP 12 by 53 steel piles can be found in the American Institute of Steel Construction, Inc., manual.(133)
This bridge was designed according to AASHO 1965 standard specifications and interim revisions. All concrete was designed to be Class C.
The soil layer profiles at the Old Reliance Road Bridge were investigated by the SASW method at the time of field tests in this project. Based on the SASW results and assumed values of the Poisson’s ratio and density for the clay to sand soils, the shear wave velocity profile was determined, as shown in table 3. The SASW results indicated that six shear wave velocity profile layers existed with the shear wave velocities of soil varying from 91.5 m/s (300 ft/s) to 518.5 m/s (1,700 ft/s).
Table 3. Shear wave velocity profile results from the Old Reliance Road Bridge site.
| Soil Shear Wave Velocity from WinSASW Model (m/s (ft/s)) | Layer Thicknesses from Ground Level with Increasing Depth (m (ft)) | Unit Weight (kg/m3 (lb/ft3)) | Assumed Value of Poisson’s Ratio |
|---|---|---|---|
| 121.9 (400) | 0.6 (2) | 1602 (100) | 0.35 |
| 91.5 (300) | 0.6 (2) | 160 (10) | 0.35 |
| 365.8 (1,200) | 0.6 (2) | 1922 (120) | 0.30 |
| 213.4 (700) | 6.1 (20) | 1762 (110) | 0.33 |
| 457.5 (1,500) | 6.1 (20) | 1922 (120) | 0.28 |
| 518.5 (1,700) | 6.1 (20) | 2002 (125) | 0.27 |

