U.S. Department of Transportation
Federal Highway Administration
1200 New Jersey Avenue, SE
Washington, DC 20590
202-366-4000
Federal Highway Administration Research and Technology
Coordinating, Developing, and Delivering Highway Transportation Innovations
 |
| This report is an archived publication and may contain dated technical, contact, and link information |
|
Publication Number:
FHWA-RD-03-089
|
Previous | Table of Contents | Next
The Trinity River Relief Bridge was initially tested on November 19, 20, and 21, 1996, and retested on September 4, 5, and 6, 1997. The first field tests on this bridge were performed to better understand the frequency ranges involved and help in the selection of the appropriate sources and receivers. During the process of demolishing and replacing this bridge, the second field tests were performed for three foundation conditions on bent 12 (piles only) and bent 2 (piles through strip footing). The three foundation test conditions were forced vibration measurements with existing, undamaged bridge bent conditions; forced vibration measurements with the surrounding soil excavated and two piles partially exposed in each bent; and forced vibration measurements with two piles excavated and one outside pile broken in each bent. The Woodville Road Bridge (footing) was tested on May 13 and 14, 1997, and the Old Reliance Road Bridge (pile cap footing on H-piles) was tested on May 15, 1997. This chapter discusses the dynamic testing instrumentation and field test procedures.
The modal vibration tests were conducted primarily using a geophysical vibrator truck (Vibroseis) to excite the bridge bents from the bridge deck level. Limited tests were also done from the bridge decks using small vibrator and impulse sledge hammer energy sources. The vibration responses of the bridges were measured with seismic accelerometer transducers. All data were recorded on a PC-based dynamic signal analyzer. The following sections discuss the Vibroseis source, accelerometer transducers, and dynamic signal analyzer recording equipment.
The Vibroseis truck, shown in figure 10, was used as the primary dynamic source in this project. It is a large (gross weight of about 22,246 kg (49,000 lb)) truck with a servo-hydraulic vibrator mounted on it. The vibrator has a 3,405-kg (7,500-lb) reaction mass that is capable of generating vertical dynamic forces above 311,500 newtons (N) (70,000 poundforce (lbf)) over a frequency range from 1 Hz to120 Hz. The type of dynamic loading functions can be steady state (frequency range from 5 Hz to 100 Hz), swept frequency, random noise, or transient. The vibrator has a loading frame with single or dual points in contact with the structure being tested.
The vibrator is separated from the truck through a system of air springs, shown in figure 11. The dead weight of the vibrator itself, including the reaction mass and the load frame system, is about 9,080 kg (20,000 lb); however, a static holddown force ranging up to 218,050 N (49,000 lbf) can be applied at the loading points by adjusting the hydraulic pressure control. This static holddown force provides the base reaction for generating dynamic forces at the desired levels. Typical dynamic peak-to-peak forces ranged from 2,225 to 151,300 N (500 to 34,000 lbf) in the up-and-down vertical excitation direction. As the resonance of the loading system is about 12 Hz, this results in the generation of even higher force output levels around this frequency.
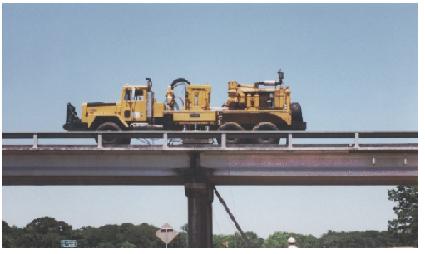
Figure 10. Photo. Vibroseis truck over Woodville Road Bridge pier.
The separation between the vibrator and the truck implies that the gross mass of the truck excluding the mass of the vibrator is part of the tested bridge; but, the vibrator itself adds an additional DOF to the tested bridge. It is important to note out that the reaction mass and servo-hydraulic system, rather than the gross weight of the truck, controls the static and dynamic force outputs. The dynamic force output actually comes from the inertial force created by the reaction mass moving at the excitation driving frequencies from the dynamic signal analyzer.
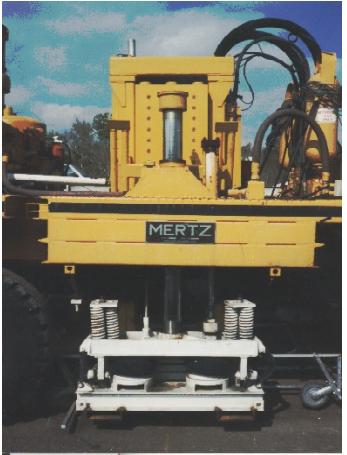
Figure 11. Photo. Vertical vibrator mechanism of Vibroseis truck.
Model 393C seismic accelerometers were selected to be the vibration response transducers because of their excellent response over the excitation frequency range of 3 Hz to about 80 Hz. This sensitive quartz accelerometer contains a built-in microelectronic amplifier that converts high impedance voltage signals from the quartz crystals to a low impedance (less than 100 ohm) voltage, imparting the ability to drive long coaxial cables (hundreds of meters/feet) for remote monitoring with no appreciable degradations of sensitivity and resolution. The internal amplifier is protected against blowout from excessive mechanical shocks up to 100 G.
The Model 393C seismic accelerometer uses a 0.454-kg (1-lb) stainless steel mass coupled to a sensitive quartz element with a design to minimize transverse vibration coupling effects (maximum transverse sensitivity less than 5 percent to excitations along the measurement axis). The seismic accelerometer has a nominal sensitivity of 1.0 volt per G (1 G equals 9.8 m/s2 (386 inches/s2)). The seismic accelerometer has a discharge time constant of 20 seconds (s), nominally. This gives a low frequency cutoff (–3 decibels (dB)) of 0.08 Hz. The 5 percent down response frequency ranges from 0.025 Hz to 800 Hz and the output (for ±2.5 volts) ranges ±2.5 G with resolution of 0.0001 G. The seismic accelerometer has its resonant frequency in excess of 3,500 Hz, and it works well in the temperature range of from –73.3 °C (–100 °F) to 93.3 °C (200 °F).
The seismic accelerometer is designed for ground-isolated operation. The mounting stud port is electrically isolated from case ground so that the seismic accelerometer can be mounted to a surface, with or without the mounting base, by using an insulating tape. The accelerometer can be mounted in any direction such as upright, horizontal, or inverted. The accelerometer is connected to a power unit by a coaxial cable or a regular twisted pair cable during field tests. Battery-powered units were used in the field because of their low inherent noise. The noise from the accelerometer is broadband; therefore, selective frequency filtering can help increase resolution. The accelerometer and power supply unit used in this project are shown in figure 12.
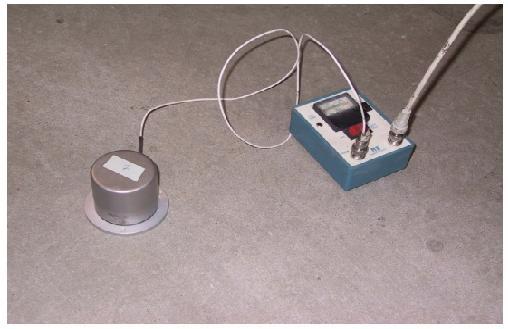
Figure 12. Photo. Seismic accelerometer and power supply unit.
A portable field computer with two Data Physics SignalCalc™ DP420™ multichannel signal analyzer cards, shown in figure 13, was used as the data acquisition system for this project. The four-channel system has four input and four output channels. The DP420 hardware configuration consists of two FFT signal processor boards, four analog input/analog output (AIAO) modules, two interface pods and one synchronizing daisy chain cable. The accompanying FFT analyzer software controls the vibrator driving operations, and it collects up to four channels of time-domain test data. The DP420 also allowed for field processing of the time-domain data into modal transfer-function frequency-domain results.
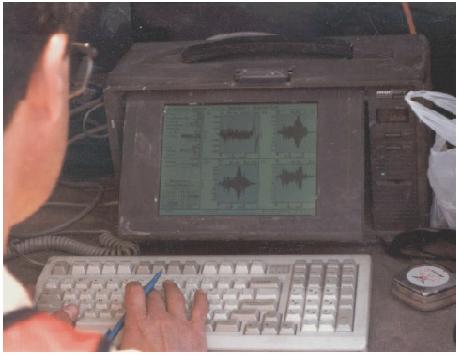
Figure 13. Photo. DP420 dynamic signal analyzer in portable PC.
The channel assignments of the DP420 generally were kept the same throughout this project. Input channel 1 was always connected to the Vibroseis load cell vibrator. The rest of input channels 2, 3, and 4 were always connected to the seismic accelerometers as the response channels. Output channel 1 functioned as the excitation driving and control channel; it was directly connected to the control unit of the vibrator. The field computer was linked with the vibrator and the seismic accelerometers by lead cables as long as 30.5 m (100 ft).
The test and processed data in the time and frequency domains were recorded and saved in the field on the hard drive of the field computer, depending on the FFT analyzer software setups. Later in the office, these field test data were recalled and saved with different file names because the commercial software used for modal analysis in this project requires the test data to be in the frequency domain with specified data formats. The field test procedures are discussed in the next section.
In general, the Vibroseis truck was placed on the top of the bridge deck over the concrete beam cap of each of the three tested bridges. After the truck was moved to a designated loading location, the vibrator was released and separated from the truck. At this time, the air springs were the only connection between the truck and the vibrator. A load cell was then placed between the vibrator and the bridge slab. Next, the weight of the truck was lifted up by hydraulic cylinders on the truck. As a result, the static holddown force was applied to the vibrator through the air springs, which provided the base reaction for generating dynamic forces at the desired levels. After the reaction load of the truck was in place, the load-cell reading was reset to be zero before dynamic testing began. Therefore, the recorded excitation force that was applied and measured through the load cell was the actual dynamic force that was directly applied to the tested bridge bents.
The load cell force was recorded on channel 1 of the DP420 analyzer along with the seismic accelerometer outputs in time on channels 2, 3, and 4. The DP420 then calculated the linear frequency response functions, also known as TFs, of the tested bridge bents for acceleration, velocity, and displacement, divided by the excitation force as a function of frequency.
The seismic accelerometers were attached to aluminum triaxial mounting blocks that were bolted with concrete anchors to the columns and beams of the tested bridge bents. The installation of the concrete anchors was accomplished by drilling small holes at the designated locations and setting concrete anchors into the drilled holes as shown in figure 14. The seismic accelerometers were mounted upright on the tops of the aluminum blocks for the vertical response measurements and attached horizontally to the sides of the aluminum blocks for the horizontal response measurements (see figure 15).
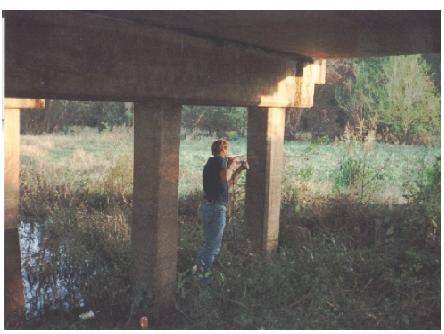
Figure 14. Photo. Drilling concrete holes to mount seismic accelerometers on bent 2 of structure 4, Trinity River Relief Bridge.
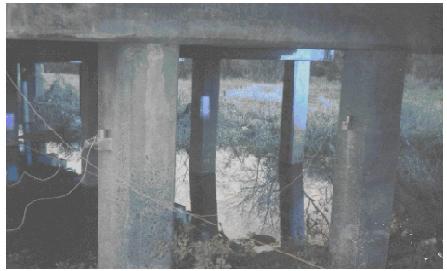
Figure 15. Photo. Seismic accelerometers on blocks bolted to piles of bent 2 of structure 4, Trinity River Relief Bridge.
The DP420 was connected with the vibrator and the seismic accelerometers by coaxial cables. Battery-powered power units were used as the power supply and amplifier units for the load cell and the seismic accelerometers. Because each power unit conditioned one input channel, four units were used.
In addition, the vibrator excitation frequency was controlled by the DP420 output channel 1 of the analog signal interfaces. The maximum input voltage of the DP420 analyzer channels was 10 volts. The Vibroseis typically was swept by a chirp pulse (increasing frequency sine wave) from the DP420 from a frequency of 3 Hz to about 80 Hz for 5 to 6 cycles. The loads applied to the bridge bents ranged from 44,500 N (10,000 lbf) to 445,000 N (100,000 lbf) of peak-to-peak force. Most loads were between 89,000 and 178,000 N (20,000 and 40,000 lbf) of peak-to-peak force to minimize nonlinear excitation effects on the soil-pile system.
Two series of field tests were conducted at the Trinity River Relief Bridge. The first test series was done to work out field test procedures and gather initial data. The second series was done before and during controlled damage to the two tested bents of the bridge as bridge demolition was proceeding.
In the first tests on the bridge in November 1996, bents 2 and 12, located east of the west abutment of bridge structure 4, were selected for testing. The primary purposes of the first field tests were to better understand the frequency ranges involved and select the dynamic sources and receivers. Several dynamic excitation sources and receivers were evaluated, including a 1.36-kg (3-lb) instrumented impulse hammer, a 5.45-kg (12-lb) impulse drop hammer, a 45.4-kg (100-lb) vibrator, the Vibroseis truck, and different types of PCB accelerometers.
The DP420 initially was set to be from 0 to 320 Hz and 500 spectral lines, which resulted in a frequency resolution of 0.64 Hz. Most of the testing was done within a frequency range of 0 to 80 Hz and 500 spectral lines for improved frequency resolution of 0.16 Hz. Five impulse hammer impacts or chirped vibrator excitation forces were applied on the bridge deck slab at about the one-third points of the beams between the four piles. The corresponding acceleration responses of the bridge bents were averaged and saved in the field computer for each test configuration. The PCB accelerometer receivers were installed at either the bottom of the beam cap or on the northern/southern sides of the concrete piles/columns.
A 1.36-kg (3-lb) instrumented impulse hammer (built-in force transducer) with a black or gray tip was used on bent 2 at first. Higher dynamic forces with higher frequencies can be generated from the hard plastic black tip than from the soft rubber gray tip because of the differences in both tip hardness and associated impact-contact time. Next, a 45.4-kg (100-lb) vibrator, shown in figure 16, was applied to the same loading point on the bridge deck as it was for the 1.36-kg (3-lb) hammer, which was 0.305-m (1-ft) north of the northern pile of bent 2. A 5.45-kg (12-lb) impulse hammer, shown in figure 17, was used at different loading locations on bent 12. The field data from these relatively small hammers and vibrator showed that not enough energy was generated to vibrate the bridge bents at the desired lower frequencies of down to a few Hz. For these sources, the useable frequency ranges were above 50 Hz to 200 Hz, according to the coherence of the TFs. Coherence is related to signal-to-noise ratio: A value of 1.0 indicates the response resulted from the input; good data have coherences of 0.9 to 1.0; however, the frequencies of interest in this modal testing needed to be as low as 3 Hz and up to 100 Hz, which indicated that a large vibrator such as the Vibroseis, with low frequency output, was essential for the research. The Vibroseis is shown in chapter 3, figure 3.
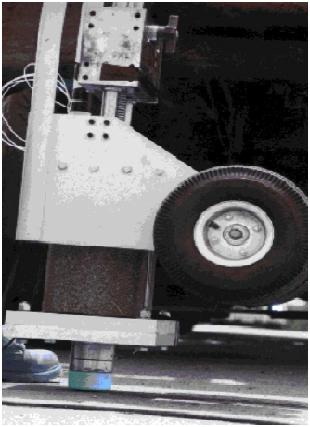
Figure 16. Photo. One-hundred-pound vibrator with dynamic load cell on bent 2.
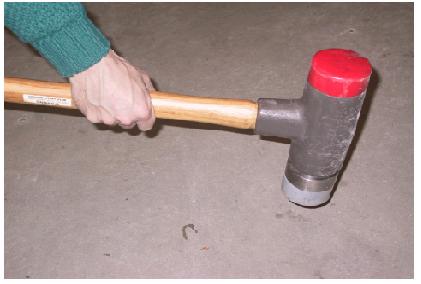
Figure 17. Photo. Twelve-pound impulse sledge hammer with soft gray rubber tip.
Consequently, the Vibroseis truck with a dual-wheel loading pattern system, see figures 18 and 19, was used on bents 2 and 12 for all of the field tests. The truck, facing east, was placed at three loading locations at the midpoints between adjacent piles on the top of the bridge deck. The dynamic forces from the Vibroseis were swept from 2 Hz to 92 Hz with a chirp pulse from the DP420 and varied in magnitude from 124,600 N (28,000 lbf) to 623,000 N (140,000 lbf) peak-to-peak (upward to downward forces) to determine the force levels at which the bridge responses changed from linear to nonlinear for the bents. The results of these tests showed that force levels less than 178,000 N (40,000 lbf) peak-to-peak were still linear.
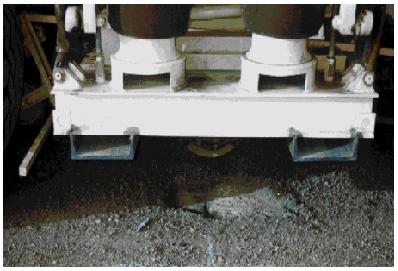
Figure 18. Photo. Closeup of the vibrator frame of the Vibroseis truck.
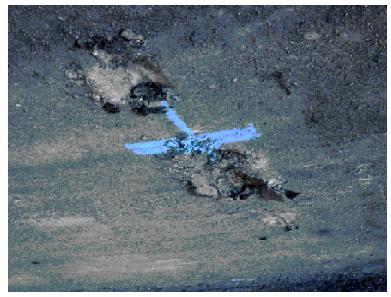
Figure 19. Photo. Dual-wheel depressions in asphalt overlay on deck over bent 2.
The final field tests were conducted on the Trinity River Relief Bridge in September 1997, before and during the bridge demolition operations. The Vibroseis loading and receiver locations tested on bents 2 and 12 were labeled the same, and the nodes were located as shown in figure 20. The Vibroseis truck with a single-point-plate loading pattern system was used as the sole dynamic excitation source at this time, and it was positioned on top of the deck at nodes 2, 4, and 6 for modal tests. The accelerometer receivers were positioned in a biaxial arrangement (vertical and in-plane horizontal accelerometers at each node during the testing) on the underside of the beam cap at nodes 2, 4, and 6, and on the pile (column) sides at nodes 8 (north) through 15 (south).
Figure 20. Diagram. Loading points and accelerometer receiver locations on bents 2 and 12, Trinity River Relief Bridge.
A round steel plate 0.305 m (1 ft) in diameter and 2.54 cm (1 inch) thick was placed between the bridge deck and the Beowulf load cell as shown in figure 21. The DP420 data recording setup ranged up to 80 Hz with 500 lines, resulting in a frequency resolution of 0.16 Hz. Five chirp pulses generated vertical vibration forces at frequencies from 1 Hz to 76 Hz. The corresponding dynamic responses of the tested bridge bents were averaged and all data saved in the field computer for each excitation test series. The magnitudes of the output forces from the Vibroseis were controlled at two levels of around 89,000 N (20,000 lbf) and 178,000 N (40,000 lbf) peak-to-peak so that the tested bridge bents behaved linearly. The seismic accelerometer receivers were installed at either the western/eastern sides of the beam caps or the western/eastern sides of the concrete piles/columns.
Field tests of bents 2 and 12 were conducted for three bent conditions: (1) existing, undamaged bridge bents, (2) with the surrounding soil excavated so that the two southern piles were partially exposed for each bent (scour simulation), and (3) with the two southern piles excavated and the most southern pile sheared or broken (earthquake damage simulation). For the first 2 cases, 3 dynamic loading and 11 receiver locations were used for each bridge bent. Only 2 dynamic loading and 10 receiver locations were used for the third case because of safety concerns about placing the Vibroseis directly over the damaged piles at node 6.
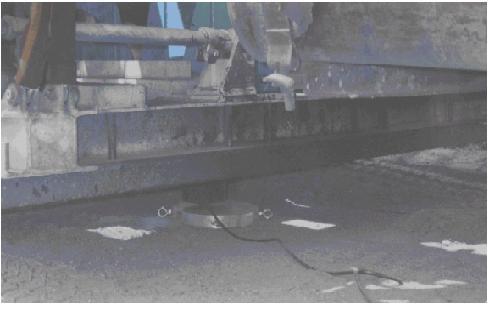
Figure 21. Photo.Vibroseis single-point-plate loading system.
As shown in figure 21, the single-point-plate loading system was used exclusively in the final tests. This allowed for point loading of the bridge deck and cap beam at the three loading points (nodes 2, 4, and 6). This load setup better matched the theoretical modeling of the bridge responses than did the dual-wheel two-point loading used initially.
The excavation and damage to the piles were performed by the general contractor on the project. The equipment was onsite for demolition of the bridge, as shown in figure 22.
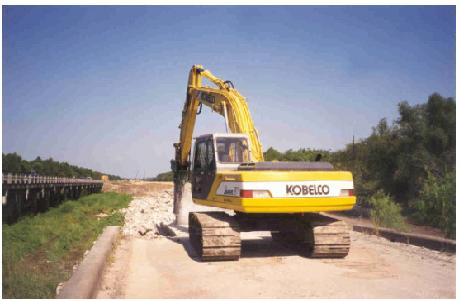
Figure 22. Photo. Demolition of structure 4, Trinity River Relief Bridge.
For settlement and safety concerns, the settlements of undamaged piles that supported bents 2 and 12 were monitored during the field tests with strings strung between adjacent bents and marks on a pile of each bent. A final settlement of 0.397 cm (0.16 inch) was measured for the south pile and column of bent 2 after the Vibroseis truck had been operated on the south side of bent 2 for about 1 hour. Bent 12 showed a slightly smaller settlement of about 0.318 cm (0.125 inch).
After the field tests were completed for the case of existing, undamaged bridge conditions, 3.05-m (10-ft)-deep excavations were dug completely around the most southern piles of bents 2 and 12 using a backhoe, shown in figure 23. Ground water eventually came into the excavation of bent 2 just below the strip footing, shown in figure 24.
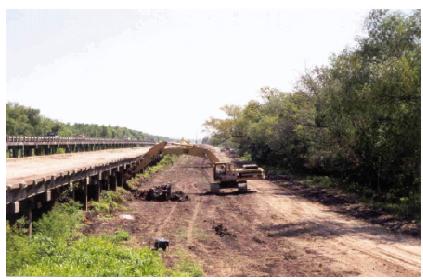
Figure 23. Photo. Backhoe excavation at bent 12, Trinity River Relief Bridge.
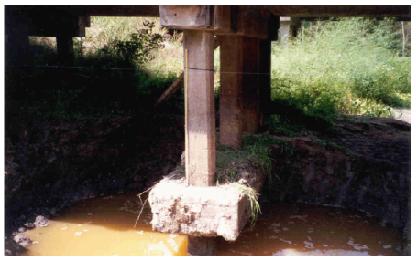
Figure 24. Photo. Ground water in excavation of bent 2, Trinity River Relief Bridge.
The excavations extended to the center-south piles, resulting in the upper 2.75 m (9 ft) around the center-south piles being exposed on the south, east, and west pile sides, with soil still against the north sides of the piles, as shown in figures 25 and 26 for bents 2 and 12, respectively. After the excavations were completed, the field modal vibration tests were then performed for the two southern-most piles that were being excavated at each bent.

Figure 25. Photo. Pile of bent 2 just after excavation
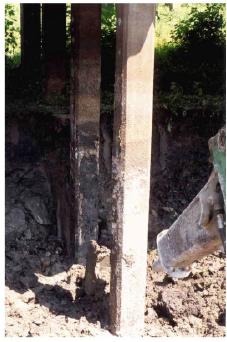
Figure 26. Photo. Piles of bent 12 just after excavation.
Finally, the south piles or columns of bents 2 and 12 were sheared or broken using a vibrating breaker point on a backhoe (figures 27 and 28).
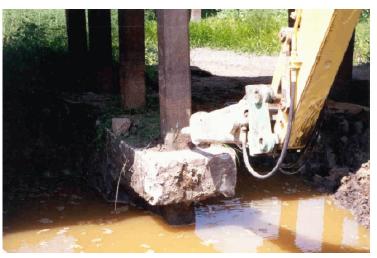
Figure 27. Photo. Shearing of pile of bent 2.
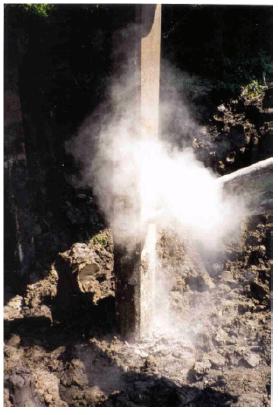
Figure 28. Photo. Shearing of pile of bent 12.
Because the seepage of ground water into the excavation around bent 2 resulted in a water level near the bottom of the strip footing (see figure 29), the south column/pile of bent 2 was sheared just above the strip footing at ground level. Four number 8 steel rebars of the south column/pile of bent 2 were exposed; one was completely broken, as shown in figure 30.
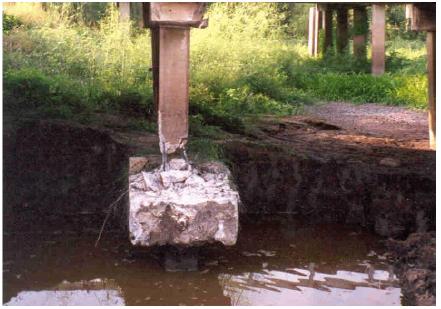
Figure 29. Photo. Sheared south pile of bent 2 with ground water seepage.
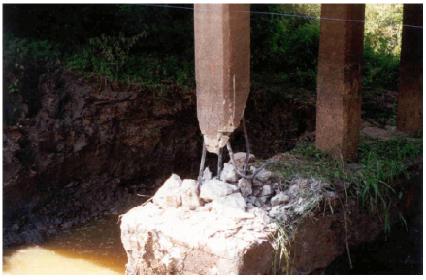
Figure 30. Photo. Bent and broken rebars of south column of bent 2.
Because no seepage of ground water occurred around bent 12 after excavation, the south column/pile of bent 12 was sheared at about 2.44 m (8 ft) below the pile beam cap. Four number 8 steel rebars of the south pile of bent 12 were exposed, but none was broken even after 0.305 m (1 ft) of the entire concrete cross section of the pile was removed, as shown in figures 31 and 32. The field tests under conditions of the south piles sheared after excavation were performed at the center and northern loading locations (nodes 2 and 4) for each bridge bent to accommodate safety concerns about positioning the truck over the damaged piles.
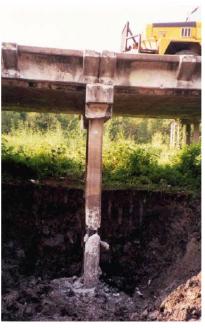
Figure 31. Photo. Sheared south pile of bent 12.
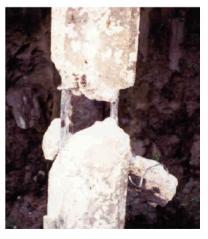
Figure 32. Photo. Rebars of south column of bent 12.
The dynamic field tests on the west pier of the Woodville Road Bridge (figure 33) were performed in May 1997. Figure 34 shows the dynamic loading and accelerometer receiver locations. The Vibroseis truck with a dual-wheel loading pattern system that was used in the first field test on the Trinity River Relief Bridge was the dynamic excitation source. The Vibroseis truck was placed at two outside lane locations on top of the bridge deck approximately over the north and south columns. No center loading position was possible because of the need to maintain traffic on the bridge.
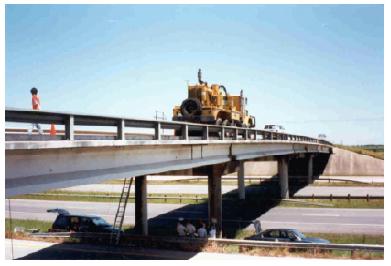
Figure 33. Photo. Vibroseis truck over west pier of Woodville Road Bridge.
Figure 34. Diagram. Woodville Road Bridge, loading points and accelerometer receiver locations.
The seismic accelerometer receivers were installed on the west sides of the concrete beam cap and two concrete columns of the west pier as shown in figures 35, 36, 37, and 38. The DP420 setup was set to be 80 Hz and 500 spectral lines, resulting in the frequency resolution of 0.16 Hz. Six to 20 chirp forces from 1 Hz to 80 Hz and corresponding dynamic responses of the bridge bents were averaged and saved in the field for each test run. The magnitudes of the output forces from the Vibroseis were set to be at two levels of around 89,000 N (20,000 lbf) and 178,000 N (40,000 lbf) to verify that the tested bridge bents behaved in a linearly elastic fashion.
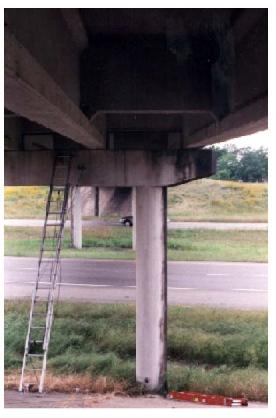
Figure 35. Photo. Accelerometers on column and beam cap of west pier, Woodville Road Bridge.
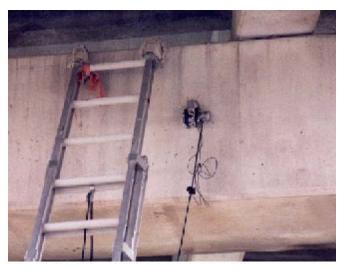
Figure 36. Photo. Biaxial accelerometer mount with vertical and horizontal accelerometers, west pier, Woodville Road Bridge.
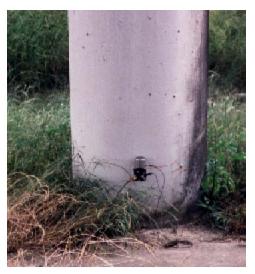
Figure 37. Photo. Vertical accelerometer at base of column of west pier, Woodville Road Bridge.
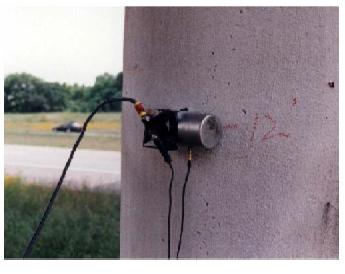
Figure 38. Photo. Horizontal accelerometer on side of column of west pier, Woodville Road Bridge.
The Old Reliance Road Bridge was tested with the same test equipment and test setups as the Woodville Road Bridge. Again, only two dynamic loading locations were available in the outside lanes at the top of the bridge deck because of the need to maintain traffic on the bridge. The seismic accelerometer receivers were installed on the east sides of the concrete beam cap and north and south columns of the east pier. Figure 39 shows the dynamic loading and receiver locations on the Old Reliance Road Bridge.
Figure 39. Diagram. Old Reliance Road Bridge, loading points and accelerometer receiver locations.

