U.S. Department of Transportation
Federal Highway Administration
1200 New Jersey Avenue, SE
Washington, DC 20590
202-366-4000
Federal Highway Administration Research and Technology
Coordinating, Developing, and Delivering Highway Transportation Innovations
 |
| This report is an archived publication and may contain dated technical, contact, and link information |
|
Publication Number:
FHWA-HRT-05-159
|
Previous | Table of Contents | Next
This chapter presents a description of the equipment and methods used during pile driving operations at the CA/T project in the selected contracts. This includes a general overview of impact hammers, how a pile is installed, and how to tell when a pile has reached the desired capacity. Construction issues associated with pile driving during this project are also presented. Pile heave was identified as an issue during construction of the arrivals tunnel at Logan Airport, which required a significant number of piles to be redriven. At another site at the airport, soil heave resulting from pile driving caused significant movement of an adjacent building and required changes to the installation process, including preaugering the piles to a depth of 26 m.
Impact hammers were used to drive all of the piles for the CA/T project. An impact hammer consists of a heavy ram weight that is raised mechanically or hydraulically to some height (termed "stroke") and dropped onto the head of the pile. During impact, the kinetic energy of the falling ram is transferred to the pile, causing the pile to penetrate the ground.
Many different pile driving hammers are commercially available, and the major distinction between hammers is how the ram is raised and how it impacts the pile. The size of the hammer is characterized by its maximum potential energy, referred to as the "rated energy." The rated energy can be expressed as the product of the hammer weight and the maximum stroke. However, the actual energy transferred to the pile is much less a result of energy losses within the driving system and pile. The average transferred energies range from 25 percent for a diesel hammer on a concrete pile to 50 percent for an air hammer on a steel pile.(17)
Three types of hammers were used on the selected contracts: (1) a single-acting diesel, (2) a double-acting diesel, and (3) a single-acting hydraulic. The manufacturers and characteristics of the hammers used in these contracts are summarized in table 4, along with the pile types driven. Schematics of the three types of hammers are shown in figures 9 through 11.
| Make and Model | Type | Action | Rated Energy (kN-m) | Pile Types Driven | Contracts | Designation |
|---|---|---|---|---|---|---|
Delmag™ D 46-32 |
Diesel | Double | 153.5 |
41-cm PPC | C07D1 |
I |
HPSI 2000 |
Hydraulic | Single | 108.5 |
41-cm PPC | C07D1, C07D2 |
II |
ICE 1070 |
Diesel | Double | 98.5 |
31-cm PPC, 41-cm PPC, 41-cm pipe | C08A1, C09A4 |
III |
HPSI 1000 |
Hydraulic | Single | 67.8 |
41-cm PPC | C19B1 |
IV |
Delmag D 19-42 |
Diesel | Single | 58.0 |
32-cm pipe | C19B1 |
V |
Delmag D 30-32 |
Diesel | Single | 99.9 |
32-cm pipe | C19B1 |
VI |
A single-acting diesel hammer (figure 9) works by initially raising the hammer with a cable and then releasing the ram. As the ram free-falls within the cylinder, fuel is injected into the combustion chamber beneath the ram and the fuel/air mixture becomes pressurized. Once the ram strikes the anvil at the bottom of the cylinder, the fuel/air mixture ignites, pushing the ram back to the top of the stroke. This process will continue as long as fuel is injected into the combustion chamber and the stroke is sufficient to ignite the fuel.
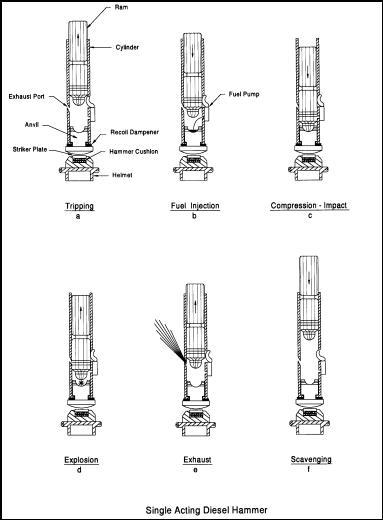
Figure 9. Single-acting diesel hammer.(17)
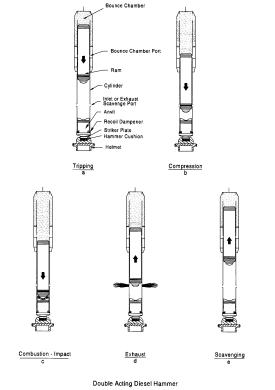
A double-acting diesel hammer (figure 10) works like the single-acting diesel hammer except that the system is closed at the top of the ram. As the ram rebounds to the top of the stroke, gasses are compressed in the bounce chamber at the top of the hammer. The bounce chamber temporarily stores and redirects energy to the top of the ram, allowing the stroke height to be reduced and the blow rate to be increased. Bounce chamber pressure is monitored during pile driving because it is correlated with hammer energy. The stroke of the hammer, and thus the energy, is controlled using the fuel pump. This is effective for avoiding bouncing of the hammer during the upstroke, which can lead to unstable driving conditions and damage to the hammer.(17)
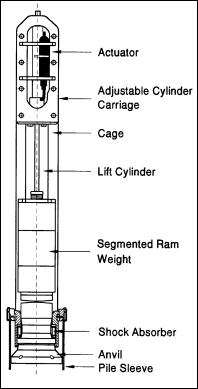
A single-acting hydraulic hammer (figure 11) uses a hydraulic actuator and pump to retract the ram to the top of the stroke. Once the ram is at the top of the stroke, the ram is released and free-falls under gravity, striking the anvil. An advantage of hydraulic hammers is that the free-fall height, and thus the energy delivered to the pile, can be controlled more accurately.
|
|
Figure 10. Double-acting diesel hammer.(17) |
Figure 11. Single-acting hydraulic hammer.(17) |
In preparation for driving, a pile is first hoisted to an upright position using the crane and is placed into the leads of the pile driver. The leads are braces that help position the piles in place and maintain alignment of the hammer-pile system so that a concentric blow is delivered to the pile for each impact. Once the pile is positioned at the desired location, the hammer is lowered onto the pile butt. A pile cushion consisting of wood, metal, or composite material is placed between the pile and the hammer prior to driving to reduce stresses within the pile during driving.
Once the pile is in position, pile driving is initiated and the number of hammer blows per 0.3 m of penetration is recorded. Toward the end of driving, blows are recorded for every 2.5 cm of penetration. Pile driving is terminated when a set of driving criteria is met. Pile driving criteria are generally based on the following: (1) the minimum required embedment depth, (2) the minimum number of blows required to achieve capacity, and (3) the maximum number of blows to avoid damage to the pile. All information that is associated with pile driving activities (e.g., hammer types, pile types, pile lengths, blow counts, etc.) is recorded on a pile driving log.
A typical pile driving log is shown in figure 12. This particular record is for the installation of a 24-m-long, 41-cm-diameter PPC pile installed at the airport as part of contract C07D2. A hydraulic hammer with an 89-kN ram and a 1.2-m stroke was used. The number of blows per 0.3 m of driving was recorded from an embedment depth of 9.5 m to a final depth of 16.5 m. At a depth of 16.5 m, the hammer blows required to drive the pile 2.5 cm were recorded in the right-hand column of the record. Driving was stopped after a final blow count of 39 blows per 2.5 cm was recorded.
Once a pile has been installed, the hammer may be used to drive the pile again at a later time. Additional driving that is performed after initial installation is referred to as a redrive or restrike. A redrive may be necessary for two reasons: (1) to evaluate the long-term capacity of the pile (i.e., pile setup or pile relaxation), or (2) to reestablish elevations and capacity in piles that have been subject to heave. Both of these issues were significant for the CA/T project, and they are discussed in the next section.
Figure 12. Typical pile driving record.
Pile heave is a phenomenon where displacement of soil from pile penetration causes vertical or horizontal movement in nearby, previously driven piles. Pile heave generally occurs in insensitive clays that behave as incompressible materials during pile driving.(17) In these soils, the elevation of adjacent piles is often continuously monitored during driving to look for heave. If a pile moves in excess of some predetermined criterion, the pile is redriven to redevelop the required penetration and capacity. From a cost perspective, pile heave is important because redriving piles can require significant additional time and effort.
Of the contracts reviewed, pile heave was an issue during construction of the arrivals tunnel at Logan Airport (contract C07D2). The location of the C07D2 site is shown in figure 1. A plan view of the arrivals tunnel structure showing the pile locations is shown in figure 13. The tunnel structure is approximately 159 m in length and is located where ramp 1A-A splits from the arrivals road. The tunnel was constructed using the cut-and-cover method, and thus a portion of the overburden soil was excavated prior to pile driving.
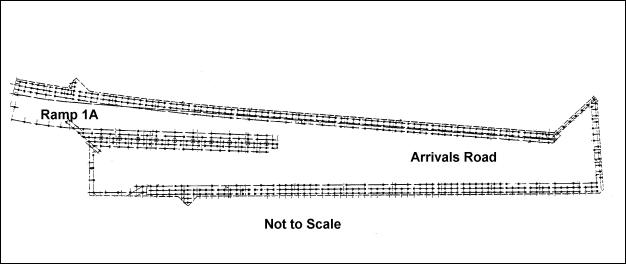
Figure 13. Site plan, piling layout for the arrivals tunnel at Logan Airport.(18)
Approximately 576 piles were driven beneath the alignment of the tunnel structure. The piles, consisting of 41-cm-diameter PPC piles, were designed to support a concrete mat foundation in addition to a viaduct located above the tunnel. They were generally installed in a grid-like pattern, with a spacing of approximately 1.2 m by 1.8 m center to center (figure 13).
The general subsurface conditions based on borings advanced in the area prior to excavation consist of approximately 3 to 6.1 m of cohesive and/or granular fill, overlying 1.5 to 3 m of organic silt and sand, overlying 12.2 to 42.7 m of soft marine clay, overlying 0.9 to 2.8 m of glacial silts and sands, underlain by bedrock.(6) Excavation was accomplished into the clay layer, resulting in a clay layer thickness of about 6.1 m at the southeastern end of the structure to around 3.7 m at the northwestern end.(19)
The piles were designed for end bearing in the dense glacial silts and sands, and were preaugered to about the bottom of the marine clay layer to minimize heave and displacement of these soils. The preauger depths were approximately 30 to 70 percent of the final embedment depths of the piles. Preaugering was done using a 46-cm-diameter auger, which is the equivalent circular diameter of the 41-cm square pile. The piles were driven using an HPSI 2000 hydraulic hammer.
Pile heave was monitored during construction by field engineers. As described in the Massachusetts State building code and project specifications, piles identified with vertical displacement exceeding 1.3 cm required redriving. According to field records, 391 of the 576 piles (68 percent) installed required redriving. Of those 391 piles, 337 piles (86 percent) were driven in one redrive event, 53 piles (14 percent) required a second redrive event, and 1 pile required a third redrive event. The impact on the construction schedule or costs was not identified. Despite the use of partial preaugering, a significant portion of the piles showed excessive heave and required substantial redrive efforts. Heave is attributed to the displacement of the underlying glacial soils that were not preaugered.
Pile heave issues were not identified on the other CA/T contracts. Since partial preaugering was used on the majority of these contracts, the difference may be related to the spacing between piles. Table 5 summarizes the pile spacing used on the selected contracts. As shown in table 5, the pile spacing of 1.2 m used at the arrivals tunnel structure is significantly less than the spacing used for structures of comparable size. Therefore, it is anticipated that a pile spacing of greater than about 1.8 m may limit pile heave to within the 1.3-cm criterion.
| Contract | Structure | Foundation | Bent Spacing(m) | Pile Spacing (m) |
|---|---|---|---|---|
C07D1 |
Ramp ET |
Slab |
2.7 |
2.7 |
Pile cap |
1.4 |
1.4 |
||
Egress Ramps |
Pile cap |
1.8 |
1.8 |
|
C07D2 |
Arrivals Tunnel |
Pile cap |
1.8 |
1.2 |
Pile cap |
1.8 |
1.2 |
||
Pile cap |
1.4 |
1.2 |
||
C08A1 |
South Abutment |
Pile cap |
3.05 |
1.8-2.4 |
East Abutment |
Pile cap |
1.1–2.7 |
1.4–2.6 |
|
West Abutment |
Pile cap |
1.1–2.1 |
1.4–2.7 |
|
C09A4 |
Utilities |
Pile cap |
2.0–2.7 |
1.8 |
Approach No. 1 |
Slab |
3.7 |
5.6 |
|
Pile cap |
1.4 |
2.6 |
||
Pile cap |
NA |
1.4 |
||
Pile cap |
NA |
1.5 |
||
Approach No. 2 |
Slab |
4.57 |
3.1–4.6 |
|
Approach No. 5 |
Slab |
3.7–4.9 |
2.1–4.3 |
|
C19B1 |
NS-SN |
Slab |
3.7 |
4.9 |
Ramp CT |
Slab |
3.1 |
4.6 |
|
Ramp LT |
Slab |
2.9–3.2 |
2.4–3.1 |
NA = not applicable or available
Soil heave caused by pile driving was primarily responsible for the significant movement observed at a building adjacent to the construction of the east abutment and east approach to ramp ET at Logan Airport (contract C07D1). Shortly after the start of pile driving, settlement in excess of 2.5 cm was measured at the perimeter of the building and cracking was observed on the structure itself. These observations prompted the installation of additional geotechnical instrumentation, installation of wick drains to dissipate excess pore pressure generated during pile driving, and preaugering of the piles to reduce soil displacement. Despite these efforts, heave continued to a maximum vertical displacement of 8.8 cm. (See references 20, 21, 22, and 23.)
The location of the project in relation to the building is shown in figure 14. The portion of the east approach that is adjacent to the building consists of two major structures, including an abutment and a pile-supported slab. Both structures are supported by 41-cm-diameter PPC piles. The layout of the pile foundation system is also shown in figure 14. The piles for the slab are arranged in a grid-like pattern with a spacing of about 2.7 m center to center. A total of 353 piles support the structures.
Figure 14. Site plan showing locations of piles, building footprint, and geotechnical instrumentation.
Prior to construction activities, five deformation monitoring points (DMPs) were installed along the front perimeter of the building closest to the work area. The DMPs consisted of 13-cm-long hex bolts fixed to the building. These points, designated DMP-101 through DMP-105, were monitored for vertical movement. The DMPs were monitored initially by the contractor and subsequently monitored by an independent consultant.
The subsurface conditions based on borings advanced in the area consist of approximately 3 to 4.6 m of fill, overlying 3 to 6.1 m of organic silt and sand, overlying 27.4 to 33.5 m of soft marine clay, overlying 6.1 to 12.2 m of glacial silt and sand, underlain by bedrock. The piles were designed as end bearing piles to be driven into the dense underlying glacial materials. The glacial soils were encountered at depths of approximately 39.6 to 45.7 m below the ground surface and bedrock was encountered at a depth of approximately 48.8 m.
Pile driving for the east approach was executed in two phases. The first phase began on April 5, 1995, and concluded on June 10, 1995. The second phase began on July 13, 1995, and concluded on August 17, 1995. The piles were driven using a Delmag D46-32 single-acting diesel hammer. The extent of the first phase of pile driving is shown in figure 15. This first phase of work was performed no closer than 27.4 m from the building. The majority of the piles for the slab were installed from the west side of the site working toward the east during the periods of April 5 to April 23, and May 15 to June 2. The majority of the piles for the abutment were installed at the west end of the site during the period of April 23 to May 15.
Settlement data obtained by the contractor during the first phase of pile driving are shown in figure 15. On April 21, 1995, after approximately 2 weeks of pile driving on the west side of the site, initial heave displacements of 0.9 and 0.7 cm were measured in DMP-102 and DMP-103, respectively. Notable heave was observed at DMP-101 and DMP-104 on May 1, which registered displacements of 1.3 and 0.8 cm, respectively. An initial heave displacement of 0.4 cm was measured in DMP-105 on May 9. The heave increased steadily to maximum values as pile driving commenced toward the east side of the site.
Figure 15. Settlement data obtained during first phase of pile driving.
A summary of the maximum heave values attributed to the first phase of driving is given in table 6. The greatest amount of heave occurred in DMP-103, which was centrally located relative to the pile grid. On June 2, 1995, 1 week before completion of construction, the heave measured in DMPs 101 through 103 began to level off and subside.
| Construction Phase | DMP 101 | DMP 102 | DMP 103 | DMP 104 | DMP 105 |
|---|---|---|---|---|---|
| Phase I | 2.5 |
3.5 |
4.3 |
3.8 |
1.6 |
| Phase II | 3.6 |
4.8 |
5.3 |
3.7 |
1.3 |
As a result of the excessive heave (greater than 2.5 cm) observed in the first phase of pile driving, mitigation measures were implemented for the second phase of work. This was critical considering that the second phase involved driving piles even closer to the building. The geotechnical consultant recommended three approaches to limiting heave based on schedule and cost constraints.(24) These included: (1) installation and monitoring of pore pressures in the clay during driving and adjusting mitigating measures as appropriate; (2) installation of wick drains between the Hilton and the work area to intercept and aid in the reduction of pore pressures beneath the Hilton that may be generated from pile driving; and (3) based on the performance of the wick drains, preauger phase II piles to limit soil displacement.
Prior to the start of the second phase of pile driving, three double-nested vibrating wire piezometers (VWPZ) were installed to measure pore pressures. These piezometers were installed in close proximity to three of the existing deformation monitoring points (DMP-102 through DMP-104). Additional instrumentation was also installed following the start of the second phase of work, including a multipoint heave gauge (MPHG) to measure vertical movement with depth and an inclinometer to measure lateral movement. The locations of the additional geotechnical instrumentation are shown in figure 14.
The second phase of pile driving began on July 13, 1995, and concluded on August 17, 1995. The extent of the work area is also shown in figure 14. Pile driving generally progressed from the west side of the site toward the east. The location of the second phase of work was no closer than 15.2 m from the existing building.
Shortly after the start of driving, 200 wick drains were installed from July 20 to July 28, 1995, around the western and northern perimeters of the work area. The drains were installed through the clay layer at a spacing of 1.2 m center to center.
Settlement data for the second phase of work, shown in figure 16, demonstrate that heave began to increase at DMP-101 through DMP-104 approximately 1 week after the start of pile driving. Based on the review of initial settlement data, preaugering was implemented from August 4, 1995, through the completion of construction. Preaugering was accomplished using a 41-cm-diameter auger to a depth of 26 m, which is approximately 50 to 60 percent of the pile's final embedment depth. The auger diameter is 11 percent less than the 46-cm equivalent circular diameter for a 41-cm square pile.
As shown in figure 16, heave continued to increase even after preaugering was initiated. Net heave values of 3.3 to 13.5 cm (table 6) were observed from the start of preaugering to the completion of pile driving, resulting in total heave values ranging from 2.6 to 8.8 cm.
Figure 16. Settlement data obtained during second phase of pile driving.
Data from the multipoint heave gauge showed that the magnitude of the heave was relatively constant within the upper 30 m, as shown in figure 17. However, vertical displacement decreases dramatically below this depth to approximately zero at the bedrock depth of approximately 50 m. The maximum heave of approximately 5.1 cm at a depth of 3 m below the ground surface is also consistent with the maximum value of 5.3 cm recorded at DMP-103.
Figure 17. Multipoint heave gauge data obtained during second phaseof pile driving.
The excess pore pressures recorded during the second phase of pile driving are presented in figure 17. The six gauges shown in figure 18 correspond to three pairs (55894–55895, 55896–55897, and 55898–55899) located adjacent to DMP-102, DMP-103, and DMP-104, respectively. There was an increase in the excess pore pressures throughout the pile driving, with maximum values ranging from 0.6 to 12.8 m of head with an average of 5.9 m. The greatest head was measured in VWPZ-55896 at a location nearest DMP-103. These data suggest that the wick drains were not effective in dissipating all excess pore pressures generated during pile driving.
Figure 18. Pore pressure data obtained during second phase of pile driving.
The inclinometer data that were obtained adjacent to the building are shown in figure 19. These data showed increasing lateral movement in the direction of the building during pile driving. The maximum net lateral deformations were relatively constant with depth within the upper 30 m of the profile. A maximum deformation of approximately 6 cm was recorded at a depth of approximately 34 m. Similar to the vertical deformations, the lateral deformations decreased sharply below this depth to zero at the bedrock depth. These data suggest that the lateral deformations are of the same magnitude and behavior as the vertical deformations.
Figure 19. Inclinometer data obtained during second phase of pile driving.
Soil heave was recognized early on as a potential problem and following phase I driving in contract C07D1, several mitigation efforts were initiated. These included installing wick drains to promote rapid dissipation of excess pore pressures and preaugering piles through a portion of the soft clay layer to a depth of 26 m. Additional instrumentation was installed, including piezometers, MPHG, and an inclinometer. Despite these efforts, heave during phase II pile driving continued to increase to a maximum displacement of 8.8 cm. The piezometer data indicate that the wick drains were not effective in rapidly dissipating pore pressures generated during pile driving. The deformation data indicated that soil heave can still occur in piles that are preaugered over a portion of their embedded depth.