Assessing Stream Channel Stability At Bridges in Physiographic Regions
3. FIELD OBSERVATIONS
Numerous stream-bridge intersections were observed across the United States
to develop and test the stability assessment method. The streams were to reflect a broad range of stream types and physiographic regions; thus, 57 site visits were conducted in
13 physiographic regions and subregions, including Pacific Coastal, Basin and
Range, Trans Pecos, southern Rocky Mountains, Great Plains, Central Lowlands,
Interior Lowlands, Ozark-Ouachita Plateau, Appalachian Plateau, Valley and Ridge,
Piedmont regions, and Atlantic Coastal Plain.
In addition to collecting
observations at streams covering a variety of erosion issues, sizes, and
physiographic regions, the following criteria also were used in selecting
appropriate sites:
- All channels were alluvial or partially alluvial(occasional rock outcrops were acceptable).
- Engineered (straightened or widened) channels were included, although manmade canals were not.
- The streams had to be wade-able or partly wade-able.
- The streams and bridges had to be safely accessible.
- A reasonable level of personal physical safety had to be satisfied.
- The streams were located within a reasonable distance of the travel corridor.
The
data for each of the streams are summarized in tables 5-7. Streams that are named
N# in table 5 are unnamed on topographic maps. Table 5 provides the locations
and global positioning system (GPS) coordinates of the bridges, the
physiographic Province, land use, and stream classification. Each of the
channels was classified according to the Montgomery-Buffington scheme. The
Montgomery-Buffington scheme does not include engineered or altered channels. However,
this method is still useful as a basic descriptor of the primary processes in
the stream (e.g., transport versus response) and is, therefore, included. To
include altered streams, the USACE method (10) and a simple
observation of channel pattern (based on both field observation and aerial
photos) also were used to classify or categorize the stream types. The
resulting stream type is provided as a combination of these methods in table 5.
The Rosgen classification method was not considered because it is unnecessarily
data intensive for the purposes of assessing channel stability in the vicinity
of a bridge. Table 6 provides the bed and bar material, the percent of sand (Fs), and any controls
observed in the banks or on the bed. Table 7 provides observations made on the
banks, including vegetation, bank material, bank height, and any erosion
characteristics. In the next section, observations made in each of the
physiographic regions are described.
Table 5. River data summary.
| River |
Map Location |
GPS Location |
Physiographic Province |
M-B/USACE Class* |
Land Use |
Channel Pattern |
| N. Latitude (deg) |
W. Longitude (deg) |
1. Saline |
U.S. Rt. 183 22.5 kilometers (km) N of Hays, KS |
39.0973 |
99.3055 |
Great Plains |
D/MA |
Cultivated |
Meandering |
| 2. S. Fork Solomon R. |
U.S. Rt. 283 1.6 km S of Hill City, KS |
39.3506 |
50.8457 |
Great Plains |
D/MA-BR |
Cultivated |
Meandering to braided |
| 3. N. Rush Cr. |
State Route (S.R.) 71, S of Limon, CO |
39.0609 |
103.7035 |
Great Plains |
D/MA |
Managed/grass |
Meandering |
| 4. Arkansas R. |
S.R. 291, N of Salida, CO |
38.6127 |
106.0618 |
Rocky Mtn. |
R/MA |
Natural/ cultivated |
Meandering |
| 5. Tomichi Cr. |
S.R. 114, 12.9 km E of Gunnison, CO |
38.5202 |
106.7852 |
Rocky Mtn. |
R/MA,MO |
Cattle pasture |
Meandering |
| 6. Murietta Cr. |
Main St., Temecula, CA |
33.4924 |
117.1499 |
Pacific Coastal |
D/MA-BR, MO |
Suburban |
Meandering |
| 7. Jacalitos Cr. |
Jayne Ave., 9.7 km E of U.S. Interstate
(I)-5 exit to Coalinga, CA |
36.1369 |
120.2771 |
Pacific Coastal |
D/MA-BR |
Cattle grazing |
Meandering to braided |
| 8. Dry Cr. |
Dry Creek Road, CA |
38.4114 |
122.4513 |
Pacific Coastal |
C/MT- MA |
Wooded |
Irregular |
| 9. Dutch Bill Cr. |
Bohemian Hwy., 9.7 km E of Oakville, Napa Valley, CA |
38.4239 |
122.9569 |
Pacific Coastal |
R-C/MA-MT |
Wooded |
Irregular |
| 10. Buena Vista Cr. |
S.R. 58 1.6 km E of Buttonwillow, CA |
35.3995 |
119.5321 |
Pacific Coastal |
B/MA-BR |
Cattle grazing |
Meandering to braided |
| 11. Mojave R. |
1st Ave., Barstow, CA |
N/A |
N/A |
Basin and Range |
B/BR |
Rural/industrial |
Braided |
*C = cascade, S = step pool, P = plane bed, R = pool-riffle, D = dune-ripple, B = braided, MT = mountain torrent, MA = meandering, MO = modified, S.R = State Route, Cr. = Creek, R. = River
Table 5. River data summary, continued.
| River |
Map Location |
GPS Location |
Physiographic Province |
M-B/USACE Class* |
Land Use |
Channel Pattern |
| N. Latitude (deg) |
W. Longitude (deg) |
| 12. Rt. 66 Wash |
Rt. 66, E of Ludlow, CA |
34.7160 |
116.1053 |
Basin and Range |
B/AR |
Natural |
Arroyo/braided |
| 13. Sacramento Wash |
S.R. 68, 27.4 km E of Lauchlin, AZ |
35.2250 |
114.2800 |
Basin and Range |
R-B/MA-BR |
Rural/mining |
Meandering to braided |
| 14. Rio San Jose |
S.R. 6, 1.6 km S of I-40, Exit 126, NM |
34.9675 |
107.1749 |
Trans Pecos |
R/MA,MO |
Grazed/natural |
Meandering, channelized |
| 15. Rio Puerco |
S.R. 6, 24.2 km E of Los Lunas, NM |
34.7966 |
106.9905 |
Trans
Pecos |
R/MA,MO |
Grazed/natural |
Meandering, channelized |
| 16. W. Elk Cr. |
E. Third St. (Rt. 66), W of Elk City, OK |
35.4119 |
99.4522 |
Central Plains |
R/MA,MO |
Suburban, cattle |
Meandering, channelized |
| 17. Beaver Cr. |
U.S. Rt. 183, ~1.6 km N of Arapahoe, OK |
35.5941 |
98.9602 |
Central Plains |
R/MA,MO |
Agricultural, cattle |
Meandering |
| 18. Brush Creek |
U.S. Rt. 62, 1.6 km E of Jacktown, OK |
35.5068 |
96.9862 |
Central Plains |
R/MA |
Agricultural, grazed |
Meandering |
| 19. Unnamed |
U.S. Rt. 62, 1.6 km E of Boley, OK |
35.4862 |
96.4594 |
Central Plains |
R/MA |
Natural, grazed, rural |
Meandering |
| 20. Little Skin Cr. |
U.S. Rt. 64, 1.6 km W of Muldrow, OK |
35.3982 |
94.6211 |
Ozark-Ouachita Highlands |
R/MA |
Natural, rural |
Meandering |
| 21. Unnamed |
U.S. Rt. 64, at Dyer, AR |
35.4964 |
94.1363 |
Ozark-Ouachita Highlands |
R/MA, MO |
Rural |
Meandering, straightened |
| 22. Little Cypress Cr. |
S.R. 59, 1.6 km S of I-40, Exit 35 |
35.3402 |
89.5018 |
Coastal Plain |
R/MA |
Agricultural, rural |
Meandering |
*C = cascade, S = step pool, P = plane bed, R = pool-riffle, D = dune-ripple, B = braided, MT = mountain torrent, MA = meandering, MO = modified, S.R = State Route, Cr. = Creek, R. = River
Table 5. River data summary, continued.
| River |
Map Location |
GPS Location |
Physiographic Province |
M-B/USACE Class* |
Land Use |
Channel Pattern |
| N. Latitude (deg) |
W. Longitude (deg) |
| 23. Unnamed |
U.S. Rt. 70, 10.5 km W of Jackson, TN |
35.6148 |
88.9909 |
Coastal Plain |
R/MA |
Agricultural, rural |
Meandering |
| 24. Unnamed |
U.S. Rt. 79, 3.2 km SE of Milan, TN |
35.8910 |
88.8105 |
Coastal Plain |
R/MA |
Agricultural, rural |
Meandering |
| 25. Honey Run |
S.R. 76, 0.8 km E of White House, TN |
36.4779 |
86.6397 |
Interior Low Plateau |
P/MA |
Rural |
Slightly meandering |
| 26. South Fork |
S.R. 84 just NE of intersection with Rt.
357 |
37.5430 |
85.7685 |
Interior Low Plateau |
P/MA |
Agricultural, rural |
Meandering |
| 27. East Fork |
S.R. 55 at intersection with U.S. Rt.
62, 3.2 km S of Bloomfield, KY |
37.8816 |
85.3029 |
Interior Low Plateau |
P/MA |
Agricultural, rural |
Meandering |
| 28. Unnamed |
U.S. Rt. 60 3.2 km E of I-40, Exit 101, ~ 9.7 km W of Sterling, KY |
38.0443 |
83.9933 |
Interior Low Plateau |
P/MA |
Rural, grazed |
Meandering |
| 29. McKnown Cr. |
U.S. Rt. 119 N at Robinson Rd., 2.4 km S of Walton, WV |
38.5934 |
81.3792 |
Appalachian Plateau |
P/MA |
Rural |
Meandering |
| 30. Wolf Run |
U.S. Rt. 199 N, 0.8 km S of Gandeville, WV |
38.6896 |
81.3886 |
Appalachian Plateau |
R/MA |
Rural |
Meandering |
| 31. Alligator Cr. |
S.R. 765, S of Punta Gorda, just S of US Rt. 41 |
26.8884 |
82.0213 |
Coastal Plain |
D/MA |
Suburban |
Meandering |
| 32. Peace R. |
S.R. 70, 1.6 km W of Arcadia, Florida |
27.2213 |
81.8766 |
Coastal Plain |
D/MA |
Suburban |
Meandering |
*C = cascade, S = step pool, P = plane bed, R = pool-riffle, D = dune-ripple, B = braided, MT = mountain torrent, MA = meandering, MO = modified, S.R = State Route, Cr. = Creek, R. = River
Table 5. River data summary.
| River |
Map Location |
GPS Location |
Physiographic Province |
M-B/USACE Class* |
Land Use |
Channel Pattern |
| N. Latitude (deg) |
W. Longitude (deg) |
| 33. Blackrock Run |
Stringtown Road off S.R. 25, N of Butler, MD |
39.5437 |
76.7331 |
Piedmont |
R/MA |
Suburban, agricultural, natural |
Meandering |
| 34. Indian Run |
Benson Mill Rd, off S.R. 25, N of Butler, MD |
39.5691 |
76.7445 |
Piedmont |
R/MA |
Natural, agricultural, rural |
Meandering |
| 35. Middle Patuxent R. |
S.R. 108, N of Columbia, MD |
39.2290 |
76.9173 |
Piedmont |
R/MA |
Natural, suburban |
Meandering |
| 36. Hammond Branch |
Stephens Rd., 2.4 km N of Laurel, MD |
39.1318 |
76.8449 |
Coastal Plain |
R/MA |
Suburban, agricultural |
Meandering |
| 37. Atherton Tributary |
Seneca Dr., Columbia, MD |
39.1871 |
76.8629 |
Piedmont |
R/MA |
Suburban |
Meandering |
| 38. Stocketts Run |
Sands Rd., 4.8 km SW of Davidsonville, MD |
38.8831 |
76.6638 |
Coastal Plain |
R/MA |
Natural, rural |
Meandering |
| 39. Mill Stream Branch |
S.R. 213, just S of Centreville, MD |
39.0401 |
76.0722 |
Coastal Plain |
R6D/MA, MO |
Agricultural, rural |
Meandering |
| 40. Kent County Tributary |
S.R. 446 (Broadneck Rd.), SW of Chestertown, MD |
39.2039 |
76.1235 |
Coastal Plain |
R6D/MA |
Agricultural |
Meandering |
| 41. Morgan Creek |
Kennedyville Rd., 1.6 km E of Kennedyville, MD |
39.2969 |
75.9845 |
Coastal Plain |
D/MA |
Agricultural |
Meandering |
| 42. Little Elk Cr. |
Little Elk Rd, 1.2 km N of PA-MD line, 2.4 km S of Hickory Hill, PA |
39.7271 |
75.9078 |
Piedmont |
P6R/ MA |
Agricultural, rural |
Meandering |
*C = cascade, S = step pool, P = plane bed, R = pool-riffle, D = dune-ripple, B = braided, MT = mountain torrent, MA = meandering, MO = modified, S.R = State Route, Cr. = Creek, R. = River
Table 5. River data summary.
| River |
Map Location |
GPS Location |
Physiographic Province |
M-B/USACE Class* |
Land Use |
Channel Pattern |
| N. Latitude (deg) |
W. Longitude (deg) |
| 43. Big Beaver Cr. |
Kuntz Mill Rd., off U.S. Rt. 222, 6.4 km N of Quarryville, PA |
39.9411 |
76.2204 |
Piedmont |
R/MA |
Agricultural |
Meandering |
| 45. Roaring Run |
PA Rt. 445, E of Nittany, PA |
40.9810 |
77.5442 |
Ridge and Valley |
S/MT |
Natural |
Step-pool |
| 44. Buffalo Run |
Fillmore Rd. (S.R. 3008) near State College, PA |
40.8595 |
77.8769 |
Ridge and Valley |
P/MA, MO |
Agricultural/ rural |
Meandering/ straightened |
| 46. Potter Run |
S.R. 144 at Potters Mills, PA |
40.8013 |
77.6257 |
Ridge and Valley |
S/MT |
Natural/rural |
Step-pool to meandering |
| 47. Bentley Cr. |
S.R. 4013 (Berwick Turnpike), about 1.6 km S of Bentley Creek, PA |
N/A |
N/A |
Glaciated Appalachian Plateau |
R/MA, MO |
Rural residential |
Meandering to braided |
| 48. N 48 |
S.R. 58, 1.6 km W of Allegheny R., PA, S of I-80, |
41.1340 |
79.6944 |
Appalachian Plateau |
P, M/MT |
Natural/rural |
Plane bed, meandering |
| 49. Reids Run |
S.R. 68, S of I-80 at Reidsburg, PA |
41.1469 |
79.4020 |
Appalachian Plateau |
P, M/MT |
Natural, agricultural, rural |
Plane bed, meandering |
| 50. Piney Creek |
S.R. 66, 0.8 km S of Limestone, PA |
41.1281 |
79.3277 |
Appalachian Plateau |
P, M |
Rural, agricultural |
Plane bed, meandering |
| 51. Little Sandy Cr. |
S.R. 3011 at East Branch Station, PA |
41.0327 |
79.0509 |
Appalachian Plateau |
P, M |
Agricultural, rural |
Meandering |
| 52. Trout Run |
S.R. 310, 1.6 km S of Reynoldsville, PA |
41.0787 |
79.9016 |
Appalachian Plateau |
P, M |
Natural, agricultural, rural |
Meandering |
*C = cascade, S = step pool, P = plane bed, R = pool-riffle, D = dune-ripple, B = braided, MT = mountain torrent, MA = meandering, MO = modified, S.R = State Route, Cr. = Creek, R. = River
Table 5. River data summary, continued.
| River |
Map Location |
GPS Location |
Physiographic Province |
M-B/USACE Class* |
Land Use |
Channel Pattern |
| N. Latitude (deg) |
W. Longitude (deg) |
| 53. Pootatuck R. |
Walnut Tree Hill Rd. near Sandy Hook, CT |
41.4376 |
73.2702 |
New England |
P-R, MA |
Suburban, natural |
Meandering |
| 54. Mill R. |
Judd Rd., N of Easton Reservoir, CT |
41.3017 |
73.2760 |
New England |
P, MA, MO |
Natural |
Meandering, straightened |
| 55. Aspetuck R. |
Silver Hill Rd. at Easton, CT |
41.2596 |
73.3249 |
New England |
P, MA, MO |
Natural, rural |
Meandering, straightened |
| 56. W. Br. Saugatuck R. |
Stonebridge Rd. at Wilton, CT |
41.1949 |
73.3875 |
New England |
P, MA |
Natural, suburban |
Meandering |
| 57. Mianus R. |
June Rd., N of Merritt Pkwy, Stamford, CT |
41.1048 |
73.5867 |
New England |
P, MO |
Natural, suburban |
Meandering, straightened |
*C = cascade, S = step pool, P = plane bed, R = pool-riffle, D = dune-ripple, B = braided, MT = mountain torrent, MA = meandering, MO = modified, S.R = State Route, Cr. = Creek, R. = River
Table 6. River channel data.
| River |
w/y |
Bed Controls |
Bank Controls |
Fs (%) |
Bed Material |
Bar Type |
Bar Material |
Bar Width |
Bar Vegetation |
| 1. Saline |
20 |
None |
Abutments |
80 |
Sand |
Alternate |
Sand |
1/2 W |
Grasses |
| 2. S. Fork Solomon R. |
17 |
None |
Abutments |
100 |
Sand |
Alternate |
Sand |
1/3 W |
None/grass |
| 3. N. Rush Cr. |
15 |
None |
None |
80 |
Sand |
None |
None |
N/A |
N/A |
| 4. Arkansas R. |
14 |
Gravel and cobble armor |
Boulders, gravel armor, bridge abutments |
30 |
Cobbles |
Point bars, midchannel |
Very coarse gravel-cobbles |
1/5 W |
Minimal |
| 5. Tomichi Cr. |
19 |
None |
Right bank riprapped |
50 |
Very fine gravel |
Midchannel (d/s only) |
Unknown |
< 1/5 W |
Shrubs |
| 6. Murietta Cr. |
9 |
– None |
None |
100 |
Sand |
Alternate |
Sand |
1/2 W |
Heavily vegetated |
| 7. Jacalitos Cr. |
23 |
– None |
Riprap at both bridge abutments |
90 |
Sand |
Irregular/ combo |
Coarse sand |
> 1/6, collectively very wide |
Minimal |
| 8. Dry Cr. |
11 |
– Boulders and occasional bedrock |
Occasional bedrock and abutments |
10 u/s |
Cobbles |
None u/s;
Alternate/ irregular d/s |
Sand |
1/2-2/3 W |
None |
| 9. Dutch Bill Cr. |
10 |
– None u/s |
Bridge abutments |
50 u/s |
Fine gravel |
Point bars |
Gravel |
2/3 W |
None |
| 10. Buena Vista Cr. |
7.5- 15 |
– None |
None |
100 |
Sand |
Irregular |
Sand |
1/2 W |
None |
| 11. Mojave R. |
6.7 |
– None |
Piers, abutments |
100 (fine) |
Sand |
Braided |
Sand |
Wide |
None |
Fs = portion of sand, u/s = upstream, d/s = downstream, W = width, R. = River, Cr. = Creek
Table 6. River channel data, continued.
| River |
w/y |
Bed Controls |
Bank Controls |
Fs (%) |
Bed Material |
Bar Type |
Bar Material |
Bar Width |
Bar Vegetation |
| 12. Rt. 66 Wash |
10 |
Boulders |
Boulders, bridge protection, abutments |
70 |
Sand, gravel |
Irregular |
Sand, gravel |
Moderate |
None |
| 13. Sacramento Wash |
20 |
None |
Bridge protection, piers, abutments |
75 |
Clay, silt, sand, gravel |
Irregular |
Sand and gravel |
Moderate |
None |
| 14. Rio San Jose |
5 |
None |
Riprap, piers, abutments |
70 |
Clay, silt, sand |
None |
N/A |
N/A |
N/A |
| 15. Rio Puerco |
16 |
None |
Clay/silt cliffs, piers, bank stabilization |
20 |
Silt, clay, sand |
Alternate, point |
Silt, clay |
Wide |
Grasses |
| 16. W. Elk Cr. |
9 |
Water line, debris |
None |
100 (silt) |
Silt |
None |
N/A |
N/A |
N/A |
| 17. Beaver Cr. |
< 4 |
None |
Bridge protection, soil blocks |
100 (silt) |
Clay, silt |
Irregular |
Clay/silt |
Moderate |
None |
| 18. Brush Creek |
5 |
Boulders from riprap |
Bridge protection, bank stabilization |
100 (silt, sand) |
Clay, silt, sand |
Irregular |
Sand, silt, little gravel |
None |
Narrow |
| 19. Unnamed |
15 |
Boulders |
Boulders, bridge protection, cliffs |
100 |
Silt, sand |
Irregular |
Very fine sand |
Wide |
None, grasses |
Fs = portion of sand, u/s = upstream, d/s = downstream, W = width, R. = River, Cr. = Creek
Table 6. River channel data, continued.
| River |
w/y |
Bed Controls |
Bank Controls |
Fs (%) |
Bed Material |
Bar Type |
Bar Material |
Bar Width |
Bar Vegetation |
| 20. Little Skin Cr. |
12 |
Beaver dams, debris |
Bedrock, bridge protection |
40 |
Sand, gravel |
Alternate bars |
Gravel |
Grasses, shrubs |
Moderate |
| 21. Unnamed |
5 |
Debris |
Bars, debris |
80 |
Silt, sand, gravel |
Only under bridge |
Sand |
N/A |
N/A |
| 22. Little Cypress Cr. |
9 |
Few boulders |
Bridge abutments and pier |
80 |
Sand w/ silt, gravel |
Irregular |
Sand |
Narrow |
None |
| 23. Unnamed |
9 |
Bridge protection |
Debris, bridge protection |
100 |
Sand |
Irregular |
Sand |
Wide |
None |
| 24. Unnamed |
9 |
Grade control |
Bridge protection, piers |
100 |
Sand |
Irregular d/s only (u/s pooled) |
Sand |
Wide |
None |
| 25. Honey Run |
12 |
Outcrop |
Piers, bars |
30 |
Gravel |
Alternate |
Gravel |
Narrow |
Grass/none |
| 26. South Fork |
9 |
None |
Piers |
30 |
Gravel |
None |
N/A |
N/A |
N/A |
| 27. East Fork |
9 |
Boulders, gravel armor |
Bridge protection |
50 |
Sand, gravel |
None |
N/A |
N/A |
N/A |
| 28. Unnamed |
12 |
Occasional bedrock, boulders |
Occasional bedrock, abutments |
20 |
Sand, gravel, cobbles |
None |
N/A |
N/A |
N/A |
| 29. McKown Cr. |
6 |
Gravel armor |
Bridge protection |
10 |
Gravel |
None |
N/A |
N/A |
N/A |
Fs = portion of sand, u/s = upstream, d/s = downstream, W = width, R. = River, Cr. = Creek
Table 6. River channel data, continued.
| River |
w/y |
Bed Controls |
Bank Controls |
Fs (%) |
Bed Material |
Bar Type |
Bar Material |
Bar Width |
Bar Vegetation |
| 30. Wolf Run |
5-8 |
Gravel armor, occasional bedrock, grade control at bridge |
Clumps of failed bank material |
10 |
Gravel |
Irregular (mostly from failure material) |
Gravel |
Moderate |
None |
| 31. Alligator Cr. |
24 |
None |
Confined left bank concrete wall or rock lined |
18 |
Silt |
None |
N/A |
N/A |
N/A |
| 32. Peace R. |
20 |
– None |
Gravel armor (bank protection), bridge riprap, debris |
100 |
Very fine sand |
Irregular/ combination |
Very fine sand |
Wide, 1/2 W |
Grasses, reeds, trees |
| 33. Blackrock Run |
5.5-17 |
– Bedrock |
Bedrock, abutments |
65 |
Sand, gravel |
Irregular |
Sand, gravel |
Narrow |
None |
| 34. Indian Run |
5 |
Debris |
Bridge riprap, abutments, fiber logs, debris |
50 |
Sand, gravel, cobbles |
Irregular |
Sand, gravel |
Wide |
Grasses |
| 35. Middle Patuxent R. |
16 |
Gravel armor |
Bedrock, gabions, riprap at bridge |
20 |
Sand, gravel |
Mid, point |
Sand, gravel |
Narrow |
None |
| 36. Hammond Branch |
7 |
Boulders |
Bridge protection, abutments, riprap |
60 |
Sand, gravel |
None |
N/A |
N/A |
N/A |
Fs = portion of sand, u/s =
upstream, d/s = downstream, W = width, R. = River, Cr. = Creek
Table 6. River channel data, continued.
| River |
w/y |
Bed Controls |
Bank Controls |
Fs (%) |
Bed Material |
Bar Type |
Bar Material |
Bar Width |
Bar Vegetation |
| 37. Atherton Tributary |
16 |
Bedrock, boulders |
Boulders, abutments |
40 |
Sand, gravel, boulders |
Irregular |
Sand |
Narrow |
None |
| 38. Stocketts Run |
16 |
None |
Abutments |
50 |
Sand, gravel |
Point |
Sand, gravel |
Moderate |
None |
| 39. Mill Stream Branch |
13-16 |
None |
Abutments, debris |
100 |
Sand |
Alternate |
Sand |
Narrow |
None |
| 40. Kent County Tributary |
3 |
None |
Abutments, concrete slabs |
80 |
Silt, sand, gravel |
Irregular |
Silt, sand |
Wide |
Grasses |
| 41. Morgan Cr. |
10 |
None |
Riprap, abutments |
80 |
Silt, sand |
None |
N/A |
N/A |
N/A |
| 42. Little Elk Cr. |
20 |
Boulders |
Bedrock, boulders, bridge protection,
abutments |
20 |
Sand, gravel, cobbles, boulders |
Point |
Gravel, cobbles |
Narrow |
None/grasses |
| 43. Big Beaver Cr. |
20-29 |
Gravel armor (d/s) |
None |
20 |
Silt, sand, gravel, cobbles |
Midchannel (u/s), point (d/s) |
Silt (u/s), sand, gravel (d/s) |
Wide |
None |
| 44. Buffalo Run |
10 |
Gravel armor, u/s weir |
Bridge protection |
30 |
Sand, gravel |
None |
N/A |
N/A |
N/A |
| 45. Roaring Run |
20 |
Boulders, riprap from failed bridge protection |
Bridge protection, bank stabilization |
10 |
Gravel, cobbles, boulders |
Alternate (d/s only; u/s step-pool) |
Gravel, cobbles |
Moderate |
None |
Fs = portion of sand, u/s = upstream, d/s = downstream, W = width, R. = River, Cr. = Creek
Table 6. River channel data, continued.
| River |
w/y |
Bed Controls |
Bank Controls |
Fs (%) |
Bed Material |
Bar Type |
Bar Material |
Bar Width |
Bar Vegetation |
| 46. Potter Run |
15 |
Gravel/cobble armor |
Bridge abutments, bank stabilization |
30 |
Sand, gravel, cobbles |
None |
N/A |
N/A |
N/A |
| 47. Bentley Cr. |
32 |
None |
Abutments |
60 |
Gravel |
Point, midchannel |
Gravel |
1/4-2/3 W |
None |
| 48. N 48 |
15 |
Gravel/cobble armor |
Boulders, abutments, bank stabilization |
10 |
Gravel, cobbles |
None |
N/A |
N/A |
N/A |
| 49. Reids Run |
15 |
Gravel/cobble armor, boulders |
Boulders, abutments |
10 |
Gravel, cobbles, boulders |
None |
N/A |
N/A |
N/A |
| 50. Piney Creek |
10 |
Gravel armor |
Bridge protection, abutments, bank
stabilization |
< 20 |
Gravel, cobbles |
Point bar |
Gravel |
Moderate |
None |
| 51. Little Sandy Creek |
18 |
Gravel armor |
Abutments |
< 20 |
Gravel, cobbles, boulders |
Midchannel |
Gravel |
Grasses |
Narrow |
| 52. Trout Run |
10 |
Gravel armor |
Bridge protection, abutments |
30 |
Gravel, cobbles |
None |
N/A |
N/A |
N/A |
| 53. Pootatuck R. |
28 |
Bedrock, boulders, gravel armor |
Boulders, abutments |
10 |
Gravel, cobbles, boulders |
Irregular |
Gravel, cobbles |
Narrow |
None |
Fs = portion of sand, u/s = upstream, d/s = downstream, W = width, R. = River, Cr. = Creek
Table 6. River channel data, continued.
| River |
w/y |
Bed Controls |
Bank Controls |
Fs (%) |
Bed Material |
Bar Type |
Bar Material |
Bar Width |
Bar Vegetation |
| 54. Mill R. |
13 |
Gravel armor, beaver dam d/s |
Abutments |
50 |
Sand, gravel |
Alternate d/s |
Sand, gravel |
Narrow |
None |
| 55. Aspetuck R. |
19 |
Gravel riffles |
Boulders, bridge protection, bank
stabilization |
60 |
Sand, gravel |
Alternate d/s (minor) |
Sand |
Narrow |
None |
| 56. W. Br. Saugatuck R. |
45 |
Boulders |
Boulders, abutments, debris jams,
islands |
40 |
Sand, gravel, cobbles |
Midchannel, islands |
Sand, gravel, cobbles |
Moderate |
Shrubs, trees |
| 57. Mianus R. |
13 |
Gravel armor (d/s of dam) |
Boulders, abutments, bank stabilization |
40 |
Gravel, cobbles |
None |
N/A |
N/A |
N/A |
Fs = portion of sand, u/s = upstream, d/s = downstream, W = width, R. = River, Cr. = Creek
Table 7. River bank data.
| River |
Material |
Bank Angle (deg) |
Bank Height (m) |
Vegetation |
Erosion Location |
Bank Failure Locations |
Exposed or Bare Banks |
| 1. Saline R. |
Silty clay loam |
30-60 |
0.9 |
Grass, deciduous trees; single dense
and continuous band; healthy, vertically oriented |
None |
None |
Minimal |
| 2. S. Fork Solomon R. |
Sand |
30-60 |
0.6 |
Grass, reeds; no trees on channel banks; but in flood plain |
Opposite and behind bars; adjacent to structures |
No mass wasting |
Frequent, but no cohesion |
| 3. N. Rush Cr. |
Loam/sand |
60-80 |
0.9 |
Grasses |
General fluvial; outside meander bends |
Outside meanders |
Outside meanders high, vertical |
| 4. Arkansas R. |
Sand, gravel, cobbles, silt |
30-60 |
1.8 |
Grass, shrubs, deciduous and coniferous
trees, healthy, vertical |
Along straight reaches |
Minor |
Minor |
| 5. Tomichi Cr. |
Silty clay |
Vertical |
0.9 |
Grass, few deciduous trees (riparian, not bank) |
Minor |
None |
None |
| 6. Murietta Cr. |
Sandy silty clay |
60-80 |
1.5-2.4 |
Reeds, sparse deciduous trees well back from bank in flood plain, vertical |
General, along channel banks |
General; bank slides visible |
Frequent, but sand so collapse |
| 7. Jacalitos Cr. |
Sand, gravel |
30-60 (Vertical at outside bends) |
0.9 |
Grass, deciduous trees |
General fluvial, outside meanders |
Outside meanders, recent slides |
Occasional |
| 8. Dry Cr. |
Silty clay |
Vertical |
0.6-4.6 |
Dense deciduous trees; healthy,
diverse, some leaning 30E |
Outside meander; upstream of structure |
General where too steep |
Minor |
| 9. Dutch Bill Cr. |
Silt |
Vertical |
0.9-6.1 (incised) |
Deciduous trees, some in channel (lateral migration) |
Fluvial outside meander |
Minimal |
Some u/s of right abutment |
LB = left bank, RB = right bank, u/s = upstream, d/s = downstream, R. = River, Cr. = Creek
Table 7. River bank data, continued.
| River |
Material |
Bank Angle (deg) |
Bank Height (m) |
Vegetation |
Erosion Location |
Bank Failure Locations |
Exposed or Bare Banks |
| 10. Buena VistaCr. |
Sand/silt |
60-90 |
0.6 |
Sparse shrubs |
General, irregular |
Slides in sand |
Frequent |
| 11. Mojave R. |
Sand |
60-90 |
1.8 |
None |
General |
Continual slides |
Continual |
| 12. Rt. 66 Wash |
Clay, silt, sand |
70-90 |
0.6-1.8 |
None |
General |
Frequent |
Continual |
| 13. Sacramento Wash |
Clay, silt, sand, gravel |
60-90 |
0.9 |
Few shrubs |
General |
Frequent slides, slumps |
Continual |
| 14. Rio San Jose |
Clay, silt, sand |
60-90 |
1.8 |
Desert shrubs |
Outside meanders, general |
Outside meanders |
Continual |
| 15. Rio
Puerco |
Clay, silt |
80-90 |
1.5 |
Grasses, shrubs (desert) |
Outside meanders, general |
Outside meanders |
Continual |
| 16. W. Elk Cr. |
Clay, silt |
70-90 |
1.5 |
Grasses, shrubs, few trees |
General |
Where hoof damage, steep banks |
Continual |
| 17. Beaver Cr. |
Silt |
90 |
2.4 |
Grasses, few bushes |
General |
Both banks-overheightened |
Continual |
| 18. Brush Creek |
Silt |
80 |
1.2-9.1 (top) |
Sparse trees |
General |
Minor, both banks |
Continual |
| 19. Unnamed |
Clay, silt, sand |
40-60 |
1.2-4.6 |
Sparse trees, grass, shrubs |
Outside meander bends |
RB |
Frequent |
| 20. Little Skin Cr. |
Clay, silt |
60 |
1.5 |
Grass, shrubs, trees (moderately dense) |
Outside meander bend, general |
Mostly d/s |
Occasional |
LB = left bank, RB = right bank, u/s = upstream, d/s = downstream, R. = River, Cr. = Creek
Table 7. River bank data, continued.
| River |
Material |
Bank Angle (deg) |
Bank Height (m) |
Vegetation |
Erosion Location |
Bank Failure Locations |
Exposed or Bare Banks |
| 21. Unnamed |
Clay, silt (main), sand |
70-90 |
0.9 |
Grass, shrubs, dense trees |
General |
None |
Minor |
| 22. Little Cypress Cr. |
Clay, silt |
90 |
0.9-3.7 |
Grass, dense trees |
General |
Outside bend |
Continuous |
| 23. Unnamed |
Clay, silt, sand |
80 |
2.4 |
Grass, dense trees |
General, outside bends |
General-overheightened banks |
Frequent |
| 24. Unnamed |
Clay, silt |
60-70 |
4.6 (levee) |
Grass, dense trees |
General |
None |
Occasional |
| 25. Honey Run |
Clay, silt |
60-90 |
0.9-1.8 (top of mass wasting) |
Grass, dense trees |
General |
Along RB, especially where vegetation removed |
Occasional |
| 26. South Fork |
Clay, silt |
70-80 |
2.4 |
Shrubs, sparse trees |
General |
Along both banks |
Frequent |
| 27. East Fork |
Clay, silt |
70 |
1.2 |
Grass |
Outside bend, general |
None |
Occasional |
| 28. Unnamed |
Clay, silt |
60-90 |
0.8 |
Shrubs, dense trees |
General (minor u/s) |
None |
Occasional |
| 29. McKown Cr. |
Clay, silt |
60-90 |
1.2 (u/s), 0.8 (d/s) |
Grass u/s, d/s grass on left bank, one row of trees on right |
General |
U/s only along banks |
Occasional |
| 30. Wolf Run |
Clay, silt, gravel |
60-90 |
1.2 |
Grass |
General, outside, inside bends |
Both banks |
Frequent |
| 31. Alligator Cr. |
Silt, sand |
LB vertical, RB moderate |
0.8 |
LB grass, RB dense trees |
LB none (concrete), RB outside meander bend (minor) |
None |
None |
LB = left bank, RB = right bank, u/s = upstream, d/s = downstream, R. = River, Cr. = Creek
Table 7. River bank data, continued.
| River |
Material |
Bank Angle (deg) |
Bank Height (m) |
Vegetation |
Erosion Location |
Bank Failure Locations |
Exposed or Bare Banks |
| 32. Peace R. |
Sand |
Steep outside bend, moderate elsewhere |
3 |
Dense trees |
Opposite bar, outside meander bends |
Left bank, outside bends |
Minor both banks |
| 33. Blackrock Run |
Clay, silt, sand |
50-80 |
0.9-2.7 |
Shrubs, trees |
Outside meander, opposite bar |
General-overheightened banks |
Occasional |
| 34. Indian Run |
Clay, silt |
40-80 |
0.8-1.8 |
Sparse trees LB, grass RB |
General, opposite obstructions |
RB where no vegetation |
Occasional |
| 35. Middle Patuxent R. |
Clay, silt |
40-60 |
1.5-1.8 |
Shrubs, dense trees in good condition |
Outside meander bends, general |
Limited on RB where high banks slough |
Frequent on both banks |
| 36. Hammond Branch |
Clay, silt |
60-80 |
1.5 |
Grasses, sparse trees, falling into stream, poor condition |
Outside meander, general |
Minor |
Continuous |
| 37. Atherton Tributary |
Clay, silt |
60-80 |
2.5-6 |
Sparse trees LB, dense trees RB, falling trees both banks |
Outside meander |
None u/s, RB d/s where trees removed |
Occasional |
| 38. Stocketts Run |
Clay, silt |
30-50, 80-90 outside bends |
0.8-1.8 |
Shrubs, dense trees, falling on either
side |
Outside meander, general |
None |
Frequent |
| 39. Mill Stream Branch |
Clay, silt |
40-60 |
0.9-2.4 |
Sparse falling trees LB, dense falling trees RB |
General |
None |
Occasional |
LB = left bank, RB = right bank, u/s = upstream, d/s = downstream, R. = River, Cr. = Creek
Table 7. River bank data, continued.
| River |
Material |
Bank Angle (deg) |
Bank Height (m) |
Vegetation |
Erosion Location |
Bank Failure Locations |
Exposed or Bare Banks |
| 40. Kent Co. Tributary |
Clay (minor gravel toward bottom) |
30-80 (lower where bank failed) |
2.4 |
Grasses, sparse falling trees |
General |
Both banks, continuous |
Frequent |
| 41. Morgan Cr. |
Clay, silt |
30-80, ragged |
0.9 |
Shrubs, sparse trees, trees upright on both banks |
General, ragged, irregular banks |
Minor |
Continuous |
| 42. Little Elk Cr. |
Clay, silt, sand |
25-34 |
0.8-0.9 |
Shrubs, trees, trees upright in good shape |
Outside meander bend |
None |
Occasional |
| 43. Big Beaver Cr. |
Clay, silt, sand |
Vertical u/s, 30-40 d/s |
1.2-2.1 (highly variable) |
Grasses u/s, trees beyond 122 m u/s |
Outside meander, opposite bar/obstruction |
Both banks everywhere for 122 m u/s |
Continuous |
| 44. Buffalo Run |
Clay, silt |
Steep |
0.8 |
Grass, shrubs |
General fluvial |
RB (ragged) |
Frequent on right |
| 45. Roaring Run |
Clay, silt, cobbles, boulders |
Steep |
0.8 (cliff on left) |
Rhododendron, trees upright, good shape |
Outside meander bend |
None |
Rare |
| 46. Potter Run |
Clay, silt |
Moderate to steep |
0.6 |
Trees in good shape on left, grass on
right |
General fluvial on right |
RB along grass |
Where grass only |
| 47. Bentley Cr. |
Silt, sand, gravel |
70-90 |
0.9 |
Grass, few trees |
General fluvial |
Minimal |
Frequent |
| 48. N 48 |
Clay, silt |
Moderate to steep |
0.6 |
Very dense trees, healthy, minor grass |
General, outside meander bend |
None |
Minor along reach |
LB = left bank, RB = right bank, u/s = upstream, d/s =
downstream, R. = River, Cr. = Creek
Table 7. River bank data, continued.
| River |
Material |
Bank Angle (deg) |
Bank Height (m) |
Vegetation |
Erosion Location |
Bank Failure Locations |
Exposed or Bare Banks |
| 49. Reids Run |
Clay, silt, cobbles |
Moderate to steep |
0.9 |
Moderately dense healthy trees; grasses and shrubs |
General |
None |
Minor along reach |
| 50. Piney Cr. |
Clay, silt, sand, gravel |
Moderate to steep |
1.1 |
RB grass only; LB healthy trees and
shrubs |
General |
Minor on RB |
Minor |
| 51. Little Sandy Cr. |
Clay, silt |
Moderate |
0.8 |
Grass within 152.5 m u/s of bridge;
further u/s healthy dense trees |
General |
Along grassy areas |
Moderate under tree roots and along
grass |
| 52. Trout Run |
Clay, silt |
Steep |
0.9 |
Very dense shrubs, dense healthy trees |
General, minor |
None |
None |
| 53. Pootatuck R. |
Clay, silt, sand, gravel, cobbles |
Moderate |
0.8 |
Trees, leaning on RB, good shape
otherwise |
Minor general fluvial |
Some mass wasting where trees removed |
Occasional |
| 54. Mill R. |
Silt, sand, gravel |
Steep |
0.6 |
Grasses, annuals, trees. Trees leaning
slightly, sparse on LB, dense on RB, good shape |
General fluvial |
None |
Occasional |
| 55. Aspetuck R. |
Clay, silt, sand |
Moderate |
1.1 |
Annuals (ferns), trees. Moderate
density in good shape |
General fluvial |
None |
Occasional |
| 56. W. Br. Saugatuck R. |
Clay, silt, sand, gravel |
Moderate |
0.8 |
Annuals, shrubs, trees in good health |
General fluvial, opposite obstructions
(significant) |
None |
Occasional |
| 57. Mianus R. |
Clay, silt, sand, gravel |
Moderate to steep |
0.9 |
Annuals, shrubs, trees moderately dense in good shape |
General fluvial |
None |
Minor |
LB = left bank, RB = right bank, u/s = upstream, d/s =
downstream, R. = River, Cr. = Creek
PHYSIOGRAPHIC REGIONAL OBSERVATIONS
Thirteen physiographic
regions and subregions were included in the data set. A wide variety of land
uses were observed in the various regions, including natural, agricultural,
grazed, rural, and suburban. Width-to-depth ratios also varied widely, from 5
to 24. As expected, the largest ratios were associated with braided or
semibraided channels. Very low width-to-depth ratios were associated with
incised streams or those that had been engineered. Bed materials varied from
very fine materials (silt and very fine sand) in the Midwest
and coastal areas to coarser materials mostly associated with higher elevation
streams. Bank materials varied widely. For example, the banks of the streams in
the Central Plains tend to be made up of fine loess and silt deposits, which erode
easily. In the Appalachian Plateau region, in contrast, the bank materials are
far more cohesive and tend to be less susceptible to high erosion rates even
when bank vegetation was limited.
Although stream types vary
widely within any of the physiographic regions, certain common characteristics
were observed. A general summary of those observations is given here. The
photos of the sites are organized by physiographic region in appendix A. Many,
but not all, of them are referred to in the discussion below.
Pacific Coastal
There are two striking features of stream channels within the border and lower Californian subregions
of the Pacific Coastal region (see appendix A). The first is the wide diversity
in types of channels. Streams range from perennial, cascading channels to
arroyos. The second feature common to most streams in these subregions is the
frequency of human interference and alteration. The channel bed material in
most of the streams (other than first-order streams) was predominantly fine-to-medium
sand, while the channel banks were sandy. The average width-to-depth ratio was
12.1. The streams tend to be very high energy; they are typically ephemeral, so
they carry water only when there is rainfall. Many of these streams (and
arroyos) tend to be naturally unstable, particularly in the lateral direction,
and have relatively high width-to-depth ratios. Because of the high degree of
channel instability and flash flooding in this region, many, if not most, of
the channels in suburban to urban settings were either concrete lined or at
least heavily armored with rock. Channels in the outlying areas were unlined.
Intermontane
Observations at bridge-stream
intersections were collected in the Basin and Range, Colorado Plateau, and
Trans Pecos subregions within the Intermontane physiographic region. Many
channels within the Colorado Plateau are bedrock or semialluvial channels in
which stability is a function of bedrock erosion. In the Basin and Range,
however, where the climate is arid to semiarid over much of the area, the
streams are ephemeral with high energy, flashy flows (see appendix A). The
energy of these streams combined with the highly erosion-prone sand beds and
banks creates unstable channels, particularly at bridges. Due to the high
sediment load carried by these streams, the width-to-depth ratios are
relatively high, with an average of 25.0. Streams in the Trans Pecos region
(see appendix A) tend to have high, steep banks or valley walls, which create
valley side failures and subsequent failure material to the stream. The bed
materials are sand, and banks are comprised of a mix of noncohesive materials,
primarily sand, with minor amounts of cohesive silts and clays. The predominant
bank vegetation was desert shrubs, and mass wasting was a common form of
erosion. The average width-to-depth ratio was 10.5.
Rocky Mountain System
The southern Rocky Mountains were visited in this region (see appendix
A). The channels contain large bed and bank material. The streams tend to be
stable, transport streams that are less disturbed by human activities than in
other physiographic regions. Stream channel banks are a mix of cohesive silts
and clays and noncohesive gravels and larger materials. The average width-to-depth
ratio was 16.5.
Interior Plains
Three subregions-the Great
Plains, Central Lowlands, and Interior
Lowlands-were visited within the Interior Plains. In the Great Plains (see appendix
A), vegetation in riparian areas and in the flood plains was thick, lush, and
dense, except where cattle were permitted to graze. The channel beds were
composed of more than 70 percent sand. Bank material was noncohesive silt,
loam, and sand, but the thick vegetation helped to keep banks stable. The
average width-to-depth ratio was 17.3. Erosion processes within the stream
channels are primarily fluvial; observed channel banks were not sufficiently
high to create significant mass wasting. Slow to moderate degradation occurred
where cattle grazing was permitted.
The Central
Lowlands (see appendix A) had silt and loess banks that eroded easily.
Many of the streams observed had been straightened in addition to having
extensive hoof and/or grazing damage. The channel beds degrade rapidly since
the bed material is predominantly silt with some clay and sand. The silt banks
then become overheightened, and mass failures result. High, failing banks were
common even where a wider riparian buffer existed, but the rate of failure was
slower (for example, see figure 7). The average width-to-depth ratio was much
lower than that observed in the Great Plains,
with an average of 8.3. This may be due in part to channel modifications, such
as straightening.
Streams in the Interior
Lowlands (see appendix A) seemed less fragile than those in the Central Lowlands due to larger bed material (sand and
gravel) and more cohesive materials in their banks (clay and silt). However,
where vegetation had been removed, banks failed even when they were not greatly
overheightened (see figure 8). A single row of trees in the riparian areas
slowed bank failure dramatically. These streams tend to have a low width-to-depth
ratio, with an average of about 10.5, and remain stable even when the
surrounding land has been disturbed. This may be due to the existence of rock
outcrops in the beds and banks.
Interior Highlands
In the combined
Ozark-Ouachita Plateau (see appendix A), bed material was larger, containing
some gravel. The bank material contains a significant percentage of cohesive
clays. Natural erosion occurred at bends with increased mass wasting at bends
where vegetation had been removed. Overheightened banks remained stable when
more than one row of trees was in place. The average width-to-depth ratio was
8.5.
Appalachian Highlands
Within the Appalachian Highlands, the Appalachian Plateau, Valley and Ridge, and Piedmont
regions were visited. In the Appalachian Plateau (see appendix A), bed material
was coarser (mainly very coarse gravel to cobbles), with bank material composed
of cohesive clay, silt, and minor sand. Critical bank heights appeared to be
about 1.5 to 1.8 m, which result in low width-to-depth ratios. For the sites
visited, the average ratio was 11.0. Watersheds are heavily forested where
vegetation is undisturbed. Stream channel erosion and destabilization occurs
through removal of vegetation and/or channel straightening. Overheightened
banks may fail, but heal quickly if vegetation is allowed to re-establish;
thus, stability tends to be fair at worst.
Stream channels within the
Piedmont region (see appendix A) had cohesive banks that could stand at high
angles without failure. Bank vegetation, if undisturbed, was dense and provided
bank stability with about one river width of woody vegetation. Banks with
angles steeper than about 60E tended to have leaning or fallen trees. The potential for debris jams
is high. Occasional bedrock outcropping was noted at all streams that were
visited. Bed material was sand and gravel with occasional larger material. The
average width-to-depth ratio was 15.3.
The Valley and Ridge region
of the Appalachian Highlands is comprised of a series of ridges separated by
stream valleys. The streams in this region are often very steep, especially
coming down from the ridges (see appendix A). Cascade and step-pool
morphologies are common. Thus, bed materials are commonly large, such as
cobbles and boulders, and often armor the bed. Banks are cohesive clays and
silts with some larger materials mixed in, strongly held together by the lush
vegetation found in this area. Disturbance to the banks by removal of
vegetation may result in ragged, scalloped banks, but erosion of the banks is
typically at a relatively slow rate. The average width-to-depth ratio was 15.0.
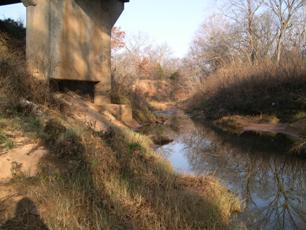
Figure 7. Failing banks in the Central Lowlands.
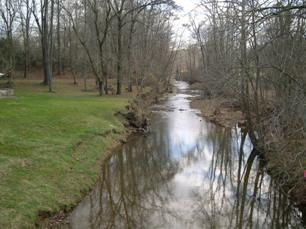
Figure 8. Failing banks in the Interior Lowlands.
Coastal Plain
The Coastal Plain covers a
very large area of the Atlantic and Gulf
coastal areas (see figure 6). Sites were visited along both the Atlantic and Gulf coasts (see appendix A). In both of
these areas, researchers observed moderate rates of bed degradation and bank
failure. A buffer of at least one river width appeared to be sufficient in most
locations to keep banks stable. Where undisturbed, lush vegetation on the banks
held the banks in place, resulting in excellent stability, even when banks were
nearly vertical. Bed material is typically sand with minor amounts of small
gravel, and banks are cohesive with clay, silt, and minor amounts of sand. Because
of the cohesive banks, strong vegetative resistance, and degradation, width-to-depth
ratios tended to be rather low. Streams in this region are often sluggish due
to low slopes and backwater from the bays or estuaries into which they flow. Where
banks or the flood plain are disturbed, debris jams are frequent. The average
width-to-depth ratios were much lower in the Gulf area (9.0) than in the
Atlantic area (13.5).
New England
All of the streams visited in
the New England region were located in Connecticut.
At all streams, the banks were heavily vegetated with large woody vegetation,
providing tremendous stability to the streambanks. The bank materials typically
were comprised of some cohesive materials combined with silt, sand and, in some
places, gravel and larger particles. The bed materials in the New
England region are considerably larger than in the Atlantic
Coastal Plain to the south. The sand, gravel, and cobble beds were often
armored; the width-to-depth ratios reflected this armored condition with an
average value of 24. The channels were all meandering, but with beds
transitional between plane beds and pool-riffle beds.
General Observations of Streams at Bridges
Channel stability is a
function of levels of disturbance to the water and sediment discharges, and
susceptibility of the channels to change. In every physiographic region, the
disturbance that caused the greatest damage to the streams was the combination
of cattle activity, vegetation removal, and channel straightening. The combined
impact of these activities was worst where cattle had direct access to streams.
Also, susceptibility of the channel banks to erosion significantly impacted the
level of damage. Figures 9 and 10 provide examples of this combination of
disturbances. All vegetation has been removed either through farming practices
or by cattle grazing. The channel apparently had been straightened to provide
better drainage and to maximize land for farming. Not only are cattle grazing
in this area, but also they have direct access to the stream. Hoof damage is
extensive. The combined disturbances have resulted in stream channel
destabilization; the channel bed elevation has degraded and the banks have
become overheightened and steepened. Figure 10 shows the eroding channel
beneath the single-span bridge.
In many cases, maintaining a riparian buffer of an appropriate width is all that is needed to preserve channel stability. As discussed in the descriptions of the streams channels
across the physiographic regions, some regions require only a single row of
trees to help maintain stability, while others require a much greater width. This
is due to bank materials and the susceptibility of the banks to failure. In the
cases where channels are degrading because of channel straightening, cattle
grazing, and urbanization effects, a vegetation buffer may not be enough to
maintain stability. When the channel degrades, banks can become overheightened
and fail through mass wasting. In this case, vegetation may help to slow the
rate of failure, but usually cannot prevent collapse of the banks.
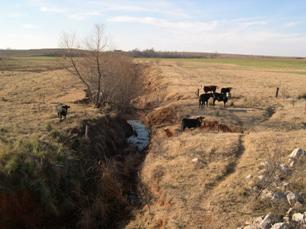
Figure 9. Stream impacts due to
disturbances, including hoof damage,
vegetation removal, and channel straightening.
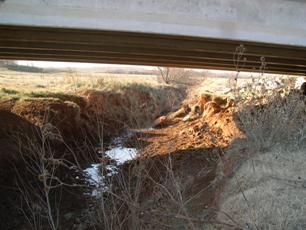
Figure 10. Impacts of disturbances at bridge (from figure 9).
Another observation that was frequently made at sites in all physiographic regions was that there was often
a distinct change in channel stability upstream and downstream of the bridges. This
was caused in every case by a change in property management, as it is common
for a road (and, thus, a bridge) to divide property ownership. As an example,
unnamed stream N 28 is wooded upstream, with a healthy wide band of upright
trees keeping the banks stable (see figure 11). Immediately downstream of the
bridge, all trees and other vegetation have been removed, resulting in
destabilization of the banks (see figure 12).
Aerial photos were examined for each of the sites using http://terraserver-usa.com (these photos are not
included in the report because they are readily available online). The photos were
examined to check a larger view of the river, specifically looking at land use
in the watershed and flood plain, construction areas, the extent of the
riparian buffer, channel straightening, and channel pattern. In most cases, the
aerial photos reinforced observations that were made on the ground. In a number
of cases, the photos helped put the bridge reach into the perspective of the
meander pattern, particularly where the bridge was located between meanders or
just downstream of a tight meander. Old abandoned meanders also could be
detected sometimes, giving an indication of previous lateral movement. Changes
in channel pattern, for example from meandering to braided, can be detected on
aerial photos. Examining the photos before or after visiting a site helped
provide a rating, especially for the watershed condition factor.
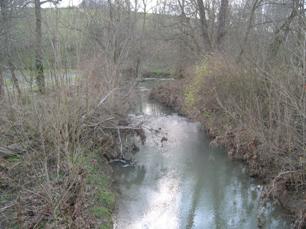
Figure 11. Wooded land upstream of bridge.
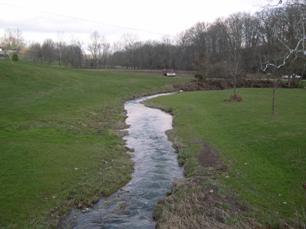
Figure 12. Downstream of figure 11, vegetation removed.
EFFECT OF CHANNEL INSTABILITY ON BRIDGES
Unstable channels can cause a
variety of problems at bridges; however, this is not necessarily the case. For
example, the Mojave River in California
(see figure 13) can be considered to be a naturally unstable channel, primarily
in the lateral direction, in that there is considerable lateral movement of the
channel. The channel bed and banks are noncohesive fine sand that adjust
readily to sudden changes in hydrology from a dry condition to flash flooding. However,
the bridge at the site that was visited spans a wide section of the flood
plain, thus providing room for some lateral migration. In many other sites
visited, lateral migration of meanders was a potential threat to bridge
abutments. In figure 14, lateral migration of a gentle meander bend has forced
the channel against the left abutment. This has, in turn, caused additional
local scour at the abutment and undermining of the abutments, and could result
in an unstable bridge foundation. Lateral and downstream migration of this
meander would have a significant impact on the left abutment.
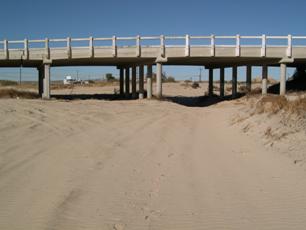
Figure 13. Mojave River, CA.
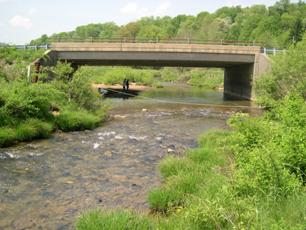
Figure 14. Meander migrationaffecting right abutment, Hammond Branch, MD.
One of the biggest problems
created by channel instability at bridges exists at single-span bridges that
are only as wide as the channel. This allows for no or limited lateral or
vertical adjustments of the channel. As an example, figure 15 shows a single-span
bridge across a channel that is both degrading and widening. Significant
widening will result in undermining of the abutment walls.
Even for channels that are
unstable, the bridge may not be in danger if adequate structural redundancy is
in place. Thus, an observation of channel instability is not a sufficient
condition for impending structural failure. The bridge inspector must consider
what impact, if any, a channel that is deemed unstable will have during the
time period between inspections, especially in the event of a large hydrologic
event.
Channel stabilization
measures at bridges are quite common. Given the small right-of-way at most
bridges, the measures typically are placed directly at the bridge and perhaps a
short distance upstream or downstream. By far, the most common type of
stabilization measure observed at these sites was riprap. In some cases, the
riprap appeared to be effective in holding the bank in place at the bridge. In
other cases, however, riprap did not appear to be effective without significant
maintenance. For example, at S.R. 445 over Roaring Run in Pennsylvania, there
is a high riprap wall composed of graded riprap with a median size of about 152-229
mm (see figure 16). The purpose of the wall is to prevent lateral migration of
the tight meander bend just upstream of the bridge. The wall has a bank angle
of about 70E. This
configuration of loose, undersized riprap in such a steep arrangement has
little chance of withstanding the high shear stresses imposed on it at high
flows as the high gradient stream makes this tight bend. There is already
evidence of riprap wall failure, as much of the stone is deposited in the
stream channel just upstream of the bridge. In other cases, stabilization
efforts seem to work quite well. As an example, a cross vane has been installed
just downstream of the S.R. 144 bridge over Potter Run in Pennsylvania (see figure 17). The cross vane
causes the flow to pool just upstream and under the bridge, slowing the high
velocity and minimizing scour under the bridge and along the banks.
RELATIONSHIP BETWEEN CHANNEL STABILITY AND SCOUR AT BRIDGES
In HEC-18, scour is defined
as having three vertical components: local, contraction, and bed degradation. Local
and contraction scours are caused by the bridge and occur within close vicinity
of the bridge. Bed degradation, on the other hand, is not caused by the bridge
and may be reach-wide or even systemwide. Channel instability includes bed
degradation, but also comprises other components, based on the definition given
previously, such as channel widening, lateral migration, and bed aggradation. At
bridges, channel instabilities can cause:
- Channel bed degradation, which may undermine the bridge foundations.
- Channel widening, which can undermine and outflank bridge abutments and piles in the flood plain.
- Lateral migration, which can undermine abutments and permit local scour to be far more productive as the channel thalweg nears an abutment.
Channel
aggradation in itself is not usually detrimental to the bridge structure, but it
can lead to increased flooding and channel widening. At many of the bridges observed
during this project, narrow, single-span bridges often were impacted more because
small lateral movements of the channel could press the stream thalweg up
against one abutment, increasing the local scour at that abutment.
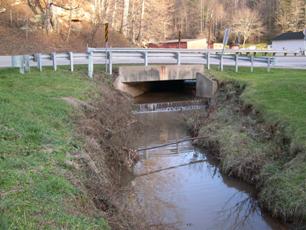
Figure 15. Single-span bridge
over unstable channel.
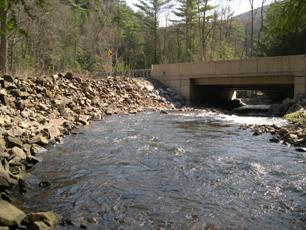
Figure 16. Riprap stabilization wall along Roaring Run, PA.
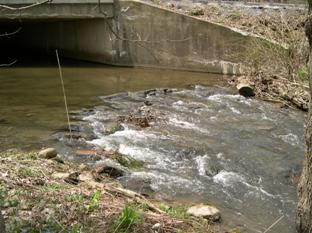
Figure 17. Cross vane downstream of bridge over Potter Run, PA.
Previous | Contents | Next
|


