U.S. Department of Transportation
Federal Highway Administration
1200 New Jersey Avenue, SE
Washington, DC 20590
202-366-4000
Federal Highway Administration Research and Technology
Coordinating, Developing, and Delivering Highway Transportation Innovations
 |
| This report is an archived publication and may contain dated technical, contact, and link information |
|
Publication Number: FHWA-RD-99-156 Date: August 2004 |
Enhanced Abutment Scour Studies for Compound ChannelsCHAPTER 3. EXPERIMENTAL INVESTIGATIONINTRODUCTIONExperiments were conducted in a 4.2-m-wide by 24.4-m-long flume of a fixed slope in the Hydraulics Laboratory of the School of Civil and Environmental Engineering at the Georgia Institute of Technology. Scour depths were measured as a function of discharge, sediment size, and abutment shape and length for two different compound-channel configurations constructed in the flume at two different fixed slopes. Velocity distributions at the bridge approach section and complete water-surface profiles at the beginning and end of scour were measured. The details of the experiments and some typical results are described in this chapter, and the results are analyzed in chapter 4. COMPOUND-CHANNEL AND ABUTMENT GEOMETRYCompound-channel sections were constructed inside the 4.2-m-wide by 24.4-m-long flume for two different series of experiments and are shown in figure 1. Compound channel A was constructed for a series of experiments reported by Sadiq(22) and Sturm and Sadiq.(23) Compound channel A was replaced by compound channel B for use in this study as well as in a separate Georgia DOT study.(78) Compound channel A had a total inside width of 2.13 m and a fixed-bed slope of 0.0050, while compound channel B was 4.21 m wide with a fixed-bed slope of 0.0022 as shown in figure 1. Steel rails on the top of the flume walls were adjusted to serve as a level track for the instrument carriage, which is driven by an electric motor. A pumping system provided the water supply to the flume from a recirculating sump into which the flume discharges. The flume discharge was measured by calibrated bend meters with an uncertainty in discharge of ±0.0003 cubic meters per second (m3/s), and the total capacity of the pumping system was approximately 0.20 m3/s. The tailwater depth in the flume was adjusted with a motor-driven tailgate at the downstream end of the flume. The flume entrance included a head tank and a series of stilling devices to remove the flow entrance effects. The compound-channel section terminated 3.1 m upstream of the tailgate in order to provide a sedimentation tank for the settling of any sediment scoured from the channel. As a result of the length occupied by the head tank and the sedimentation tank, the actual length of the compound channel was 18.3 m. The main-channel bed of compound channel A consisted of concrete having a longitudinal slope of 0.005 with a tolerance of ±0.001 m from the required elevation at any station along the channel. Fine gravel with a mean diameter of 3.3 mm and a geometric standard deviation of 1.3 was used to provide the roughness on the main-channel bed and walls. Gravel was affixed to the main-channel bed and walls with varnish. Roughness in the floodplain was also provided by gravel of the same size. To prevent movement of the gravel in the floodplain for the uniform-flow experiments, the upper 5-centimeter (cm)-thick layer was stabilized by mixing portland cement in the gravel in a ratio of 1:6 by volume. Water was then added until a reasonable workability was achieved to form a fixed bed consisting predominantly of gravel roughness in the resulting matrix. In the case of compound channel B, a lean concrete mix that used the 3.3-mm gravel as aggregate was poured to a constant slope of 0.0022 with a standard error of ±0.002 m in bed elevation. In both compound channels, the bed surfaces were relatively rough as determined by the protruding grains of gravel. 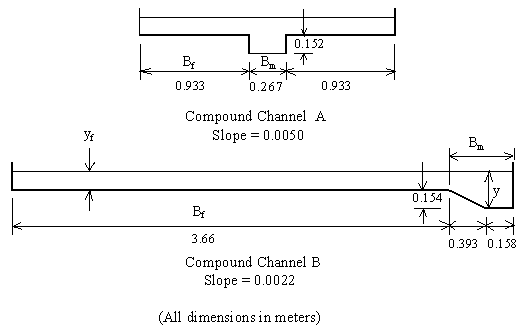 Figure 1. Compound-channel configurations used in scour experiments. In the case of compound channel A, the bridge abutments were formed by a row of rectangular concrete blocks measuring 0.15 m high by 0.15 m wide (in the flow direction) that were fixed to the floor of the flume with cement mortar at station 9.75 located 9.75 m (32 ft) downstream of the flume entrance. In the text that follows in this report flume station refers to the distance from the flume entrance in meters. The abutments for compound channel B were constructed as a row of concrete blocks poured into custom-built forms to create vertical-wall (VW), spill-through (ST), and wingwall (WW) abutment shapes as shown in figure 2. The sideslopes for the wingwall and spill-through shapes were 2:1 (horizontal:vertical) and the wingwall angle was 30 degrees as shown in figure 2. The centerline of the abutment for compound channel B was also located at station 9.75 as it was for compound channel A. The abutment lengths, La, and relative abutment lengths, La/Bf, for both compound channels are summarized in table 1.
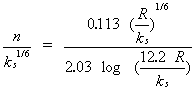
SEDIMENTThree sediments having median sediment grain sizes (d50) of 3.3, 2.7, and 1.1 mm were used in this research as indicated in table 1 where they are referred to as sediments A, B, and C, respectively. The measured size distributions of all three sediments are shown in figure 3. The geometric standard deviation 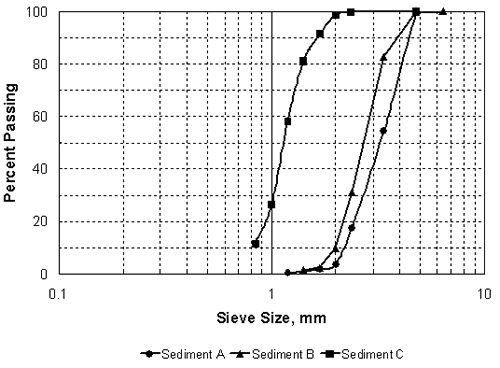 Figure 3. Sediment grain size distributions. WATER-SURFACE PROFILE AND VELOCITY MEASUREMENTSBoth water-surface profiles and velocities were measured in the fixed-bed compound channels just described, first for uniform flow to determine the bed roughness, and then with the abutments in place to obtain the hydraulic conditions at the beginning of scour. In the uniform-flow experiments, stations for measuring the water-surface elevations were fixed at 1.22-m intervals along the length of the channel. The desired discharge was obtained by adjusting the inlet valve, and the tailgate was raised or lowered to achieve the required M1 or M2 profile with no abutments in place, where M1 and M2 are customary textbook symbols for water surface profiles in open channel flow on a mild slope. M1 profile flow decelerates in the downstream direction; M2 profile flow accelerates in the downstream direction. At each station, the water-surface elevation was measured at three points across the compound channel for compound channel A, and at eight points for compound channel B. The mean of these elevations was then used to determine the mean elevation of the water surface at each station. The normal depths were determined by taking the mean of the flow depths at a point where both M1 and M2 water-surface profiles asymptotically approached one another in the upstream direction, which was generally about 6 to 9 m downstream of the channel entrance. The relative depth ratio (yf0/ym0), where yf0 = normal depth in the floodplain and ym0 = corresponding normal depth in the main channel (see figure 1), varied from 0.26 to 0.35 for compound channel A, and from 0.13 to 0.32 for compound channel B. A miniature propeller current meter with a diameter of 1.5 cm was used to measure point velocities averaged over 60 s. In the uniform-flow experiments, station 9.75 was selected for measuring the point velocities across the channel cross section because at this station there were negligible entrance effects, and also because the water surface could be adjusted easily to the normal depth at this station. Depth-averaged velocity distributions were obtained from a point velocity measurement at an elevation above the channel bottom of 0.37 times the flow depth in each vertical profile in the floodplain, and from six to eight point measurements spaced out over each vertical profile in the main channel. Fourteen to 19 vertical profiles were measured at a single cross section to establish the depth-averaged velocity distribution. The resulting measured velocity distributions when integrated over the cross section produced discharges that were within ±4 percent of the discharges measured by the calibrated bend meters in the flume supply pipes for the uniform-flow experimental runs. The separate discharges in the main channel and the floodplains were determined from the point velocities by integration. This information was combined with the measured normal depths to determine the separate main-channel and floodplain roughnesses in the uniform compound-channel flow from Manning's equation. Normal depth was also determined with flow in the main channel alone in order to determine the equivalent sand-grain roughness of the main channel. Measurement of water-surface profiles and point velocities was also conducted with the abutments in place in the fixed-bed channel. Away from the abutments, the water-surface elevations were measured at stations 1.22 m apart as in the uniform-flow case. Close to the abutments, water-surface elevations were measured at stations 0.3 m to 0.6 m apart. The depth of the flow at the downstream end of the channel was set at the normal depth for each discharge by adjusting the tailgate. For the longer abutments, the tailwater was set higher than the normal depth in some instances to limit the maximum scour that could occur. With the abutments in place, and for both a fixed bed at the beginning of scour and a movable bed at the end of scour, detailed point velocity measurements were made across the entire channel cross section at the bridge approach section, which was station 8.5 for compound channel A, and either station 6.7 or station 7.3 for compound channel B, depending on the abutment length. This station was located in the region where the maximum backwater occurred as well as where the floodplain velocities were not retarded by the abutment. In general, this location varied between 67 and 133 percent of the bridge opening width measured upstream of the bridge. Depth-averaged velocities were determined at 17 to 19 positions across the cross section. These data were used to determine the discharge contraction ratio M at the beginning of scour as well as the approach velocity and depth upstream of the end of the abutment. Velocity and depth measurements were also made at the downstream face of the abutment, mostly for compound channel A. At this location, the depth of flow in the floodplain was very small; therefore, the velocities were measured in the main channel only and the discharge was obtained from integration. The discharge in the floodplain was obtained from continuity as the difference between the measured total discharge and the main-channel discharge. Resultant velocities were measured at the upstream face of the bridge for both compound channels A and B for the fixed-bed case. The resultant velocity direction was determined either by flow visualization or by rotating the velocity meter until a maximum reading was obtained. In the case of compound channel B, additional resultant velocities were measured in the bridge opening to find the maximum velocity near the face of the abutment. For the long abutments (La/Bf = 0.88, 0.97, 1.0), an acoustic Doppler velocimeter (ADV) was used to measure three-dimensional velocity components in the main channel at stations beginning at the approach section and extending to the contracted section. The measuring volume for this instrument is a cylinder 9 mm high by 6 mm in diameter located a distance of 5 cm below the probe. The ADV transmits two sound pulses separated by a time lag and receives the reflected signals from particles in the flow at the location of the sampling volume. The instrument measures the Doppler shift between the frequencies of the transmitted and received signals based on the change in phase of the return signal from each pulse, which can be correlated with velocity in the flow. Some limitations associated with this probe include: (1) a minimum water depth of approximately 7 cm is required for submergence of the probe with allowance for the 5-cm distance to the sampling volume; (2) when operating in highly turbulent environments, the signal-to-noise ratio (SNR) may drop below accepted levels; (3) the probe cannot sample a location too close to a boundary because of the size of the sampling volume and possible interference with the boundary; and (4) the maximum sampling frequency is 25 hertz (Hz). The first limitation means that velocities near the free surface cannot be measured and that the probe is not useful for very shallow flows over the floodplain in this investigation. Thus, the ADV was used only in the main channel where depths were on the order of 20 to 25 cm. The center of the sampling volume was limited to a minimum distance of 5 mm from the channel bottom. The SNR varied from 5 to 15 decibels (dB), which is adequate for measuring mean current speed; however, for SNR < 15, the manufacturer does not recommend high-resolution measurements (i.e., sampling at 25 Hz, which is required for turbulence measurements). SCOUR MEASUREMENTSAfter the fixed-bed measurements were completed, a movable-bed section was constructed in the vicinity of the abutments. The cement-stabilized floodplain surface was removed between stations 8.5 and 11.0 for compound channel A, and between stations 6.7 and 12.8 in the case of compound channel B. This resulted in a total length of movable bed for compound channel A of 2.5 m and a length of 6.1 m for compound channel B. The movable-bed floodplain consisted of sediments A, B, or C, with sizes as indicated previously in table 1. In both compound channels A and B for relative abutment lengths less than 0.66, the main channel remained as a fixed bed; for the longer abutments in compound channel B, the main channel was also made into a movable bed. It was formed using a template to produce the same slope as for the fixed bed. The abutments were sealed with cement mortar to the floor of the flume. Scour measurements were made for several discharges at each of the abutment lengths given in table 1. At the start of each experimental scour test, the loose gravel in the movable-bed test section was carefully leveled to the floodplain elevations corresponding to the constant-bed slope. Water was then introduced into the channel very gradually from the upstream and downstream ends of the flume with the tailgate raised so that the movable bed remained undisturbed. Once the whole channel was flooded, the desired discharge was obtained by adjusting the valve on the main inlet pipe. The tailgate was then lowered slowly until the corresponding normal depth was reached at the downstream end of the channel. Scour was allowed to continue for 12 to 16 hours for compound channel A, and for 24 to 65 hours for compound channel B. After equilibrium had been reached, the water-surface profile and the velocity distributions in the approach section and at the downstream face of the abutment were measured in the case of compound channel B. Then the channel was carefully drained and the bed elevations throughout the scour and deposition areas were measured with a point gauge having a scale uncertainty of ±0.03 cm. As a practical matter, the uncertainty in the scour-depth measurements was about ±0.09 cm. In general, bed elevations in the vicinity of the scour hole were measured at approximately 100 spatial locations from which scour contours could be plotted. The time rates of scour measurements were made for sediment A and for the vertical-wall abutment for some experiments. For these runs, scour depth was measured from a scale inscribed on a Plexiglas® block that formed the face of the abutment. The scale could be read from above by the use of a mirror. Only those cases where the maximum scour depth occurred at the upstream corner of the abutment face were suitable for this measurement technique. In general, these cases occurred for the greater discharges for each abutment length. Scour-depth measurements were generally taken at times of 0.08, 0.17, 0.25, 0.50, 0.75, 1, 2, 4, 8, 16, 24, and 36 hours after the beginning of the experiment. RESULTSChannel RoughnessThe experimental results for Manning's n in the main channel and the floodplain with compound-channel flow are shown in figure 4 for sediment A and compound channel B. First, 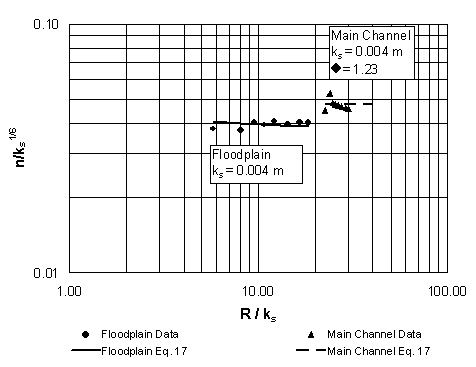 Figure 4. Manning's n in the main channel and floodplain for compound channel B. 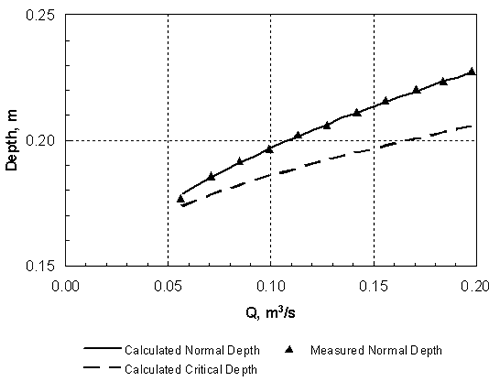 Figure 5. Measured and computed normal depth for compound channel B. the value of the equivalent sand-grain roughness in the main channel was determined from the normal depth measurements for flow in the main channel alone (without overbank flow) with the result that ks = 0.004 m (4.0 mm or 1.2d50). Then the separate discharges were determined in the main channel and the floodplain for overbank flow at several discharges as described previously, and the data points are shown in figure 4 in comparison with Keulegan's equation, given as:
where R = hydraulic radius in meters and ks = equivalent sand-grain roughness in meters. For the separate flow in the floodplain, ks was found to be 0.004 m as in the main-channel flow alone, which is consistent with the fact that the roughness surfaces were identical. In the case of main-channel flow, an additional drag caused by the main channel/floodplain interaction was quantified in terms of a coefficient
where nmc = effective Manning's n in the main channel with overbank flow and nK = Keulegan's value for Manning's n in the main channel with ks = 0.004 m and no interaction with the floodplain (i.e., zero contribution of the interface to the wetted perimeter). The best-fit value of s was 1.23. In effect, the main-channel conveyance was decreased by 23 percent because of the main channel/floodplain interaction. Similar results were found previously for compound channel A by Sadiq(22) and Sturm and Sadiq(40) with Discharge DistributionThe purpose of considering the main channel/floodplain interaction in developing Manning's n values for compound-channel flow is illustrated in figure 6 in which the ratio of the main-channel discharge to the total discharge is given as a function of relative depth in the floodplain. The data in figure 6 were measured in uniform flow without the presence of the abutment. In both compound channels A and B, the calculated discharge distribution agrees well with the measured values. For comparison, the standard WSPRO method of assuming a constant Manning's n and no interaction between the main channel and the floodplain overestimates the relative proportion of main-channel discharge as shown in figure 6 for compound channel A. The correct proportioning of the main-channel and floodplain discharge is necessary to predict the discharge distribution factor M for which experimental values are given in figure 7(a) as a function of relative floodplain depth in the bridge approach section (indicated by a subscript of 1 on the depth).1 The factor M is defined as:
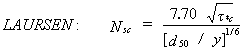
where Qm1 = discharge in the approach main channel, Qf1 = discharge in the approach floodplain, Qobst1 = obstructed floodplain discharge over a length equal to the abutment length in the approach cross section, and Q = total discharge, which is equal to Qm1 + Qf1. While the values of M are primarily a function of the abutment length and the compound-channel geometry, figure 7(a) shows that they decrease slowly with increasing relative depth in the approach cross section. The abutment shape seems to have relatively little influence on M in figure 7(a). Sturm and Janjua(19) have shown that for small depth changes from the approach section to the bridge section, M represents the ratio of discharge per unit width in the approach floodplain to that in the contracted floodplain in the bridge section, qf1/qf2. This discharge ratio has a significant effect on the equilibrium abutment scour depth as will be shown in chapter 4. Alternatively, it can be shown by the same reasoning that M is indicative of the value of the ratio of main-channel discharge in the approach section to that in the contracted section, Qm1/Qm2. The experimental results in figure 7(b) confirm that such a relationship exists. The value of M, and hence qf1/qf2, is not the same as the geometric contraction ratio m, which is defined as the bridge opening width over the total channel width. This is because of the characteristic behavior of compound-channel flow in which some of the approach floodplain flow joins the main-channel flow in the bridge section. The redistribution of flow between the main channel and the floodplain in the contracted bridge section has a significant influence on the scour depth as will be discussed further in chapter 4. Raw experimental results for water-surface profiles, velocity distributions, critical velocity, and equilibrium scour depths, as well as scour contours for compound channel B, are summarized in the following sections of this chapter. 1 In the remainder of this chapter and the rest of the report, the subscript "0" refers to depths, velocities, and discharges measured in uniform flow at the bridge location without the presence of an obstruction. The subscript "1" refers to the approach section upstream of the bridge with the obstruction in place where bridge backwater is at a maximum and where floodplain velocities are not retarded by the embankment. The subscript "2" represents the contracted flow section at the downstream face of the bridge. Main-channel variables are indicated by the subscript "m" and floodplain variables are denoted by the subscript "f." For example, yf1 is the floodplain depth in the approach section with the bridge in place. See figure 23. 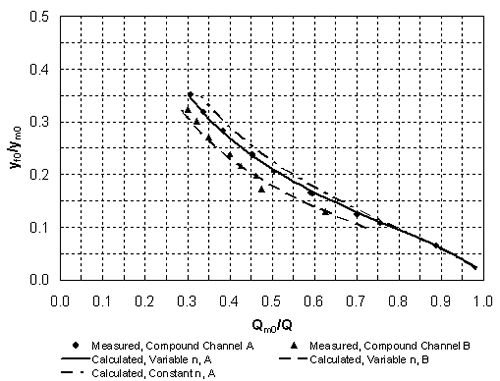 Figure 6. Ratio of main-channel discharge to total discharge as a function of relative normal depth in the floodplain. 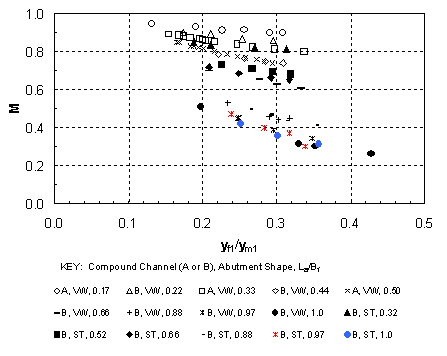 (a) Dependence of M on approach depth and abutment length. 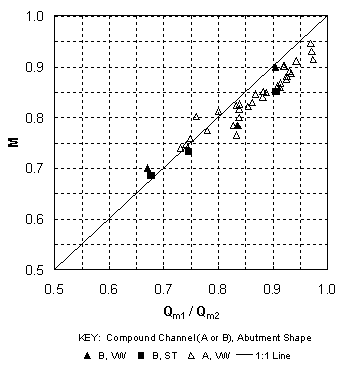 (b) Use of M to reflect main-channel discharge ratio. Figure 7. Dependence and use of discharge distribution factor M. Water-Surface Profiles and Approach Velocity DistributionsMeasured water-surface profiles and corresponding approach-section velocity distributions are shown in figures 8 and 9 for the vertical-wall abutment and the fixed-bed case (beginning of scour). In figure 8, the discharge is held constant at 0.0850 m3/s and the relative abutment length is varied from 0.22 to 0.66. The downstream boundary condition is the same for each profile because it is the normal depth for the given discharge as set by the tailgate. The increasing backwater upstream of the abutment that is caused by increasing abutment length is apparent in figure 8(a). In figure 8(b), the main-channel velocities are higher than those in the floodplain as expected for small floodplain depths in a compound channel. The increasing backwater for longer abutments shown in figure 8(a) causes a general decrease in both the floodplain and main-channel velocities across the full width of the compound channel as shown in figure 8(b). In figure 9, the relative abutment length is held constant at 0.44; however, the discharge is varied from 0.0708 m3/s to 0.0991 m3/s. In this case, the downstream boundary condition of normal depth causes an increasing tailwater depth with increasing discharge as can be seen in figure 9(a). The backwater upstream of the bridge abutment is also observed to increase with increasing discharge as seen in figure 9(a). In contrast to the effect of increasing abutment length at constant discharge, increasing discharge for the vertical-wall abutment of constant length causes an increase in the floodplain velocities as shown in figure 9(b), even though the backwater is increasing. The main-channel velocities also increase, but this occurs chiefly in the sideslope region of the main channel. The increase in the floodplain velocities with increasing discharge is a consequence of a greater proportion of the discharge being carried in the floodplain relative to the main channel as the relative depth increases. The change in flow distribution is also apparent in figure 7(a), in which M decreases with increasing relative floodplain depth because of the decrease in the unobstructed discharge for the same abutment length. Results similar to those of figures 8 and 9 were observed for the spill-through abutments. The relative degree of upstream backwater for vertical-wall and spill-through abutments is most easily summarized in terms of the ratio of the floodplain normal depth, yf0, which would occur with no abutments, to the approach floodplain depth, yf1. This backwater ratio varied from 0.6 to 1.0 as a function of abutment length and shape, and discharge. For the larger abutment lengths, the scour depth increased even at the lowest discharges to the point that it was possible for the scour hole to bottom out on the concrete floor of the flume. To avoid this condition, the tailwater was raised above the normal depth so that the tailwater level became the independent variable for the scour depth while holding the discharge constant for a given abutment length. The effects of variable tailwater on the water-surface profiles and the approach velocity distributions are shown in figure 10. This is the case of the abutment terminating at the edge of the main channel (La/Bf = 1.0) for a constant discharge of 0.0567 m3/s. It is clear from figure 10(a) that the higher the tailwater level, the less backwater upstream of the abutment, where backwater is defined relative to an upstream depth that would occur without the contraction. Beginning at the tailgate, the floodplain depth decreases in the upstream direction as an M1 profile because of boundary resistance both downstream and upstream of the abutment; however, the largest drop in depth occurs through the contracted section. The higher tailwater also causes less difference between the floodplain and main-channel velocities with the velocity distribution becoming nearly uniform for the highest tailwater as shown in figure 10(b). The 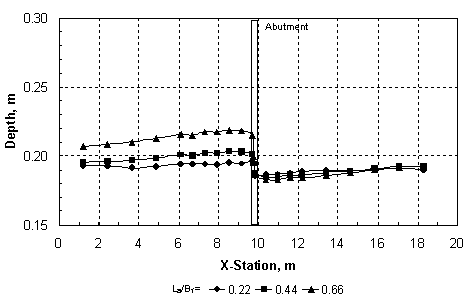 (a) Compound Channel B: Water-Surface Profiles, VW Abutment, Q = 0.0850 m3/s. 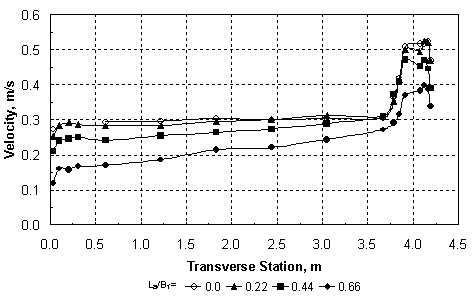 (b) Compound Channel B: Approach Velocity Distributions, Station 7.3 m, VW Abutment, Q = 0.0850 m3/s. Figure 8. Effect of variable abutment length on water-surface profiles and velocity distributions for constant discharge. 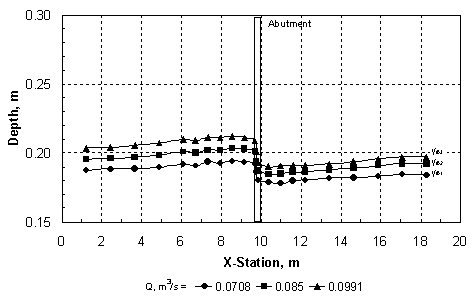 (a) Compound Channel B: Water-Surface Profiles, VW Abutment, La/Bf = 0.44. 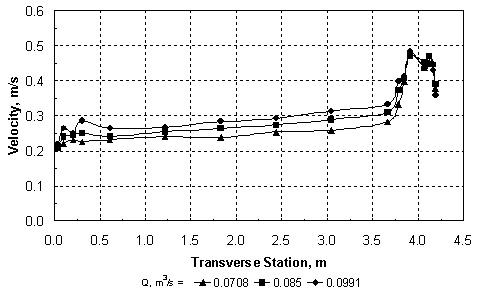 (b) Compound Channel B: Approach Velocity Distributions, Station 7.3 m, VW Abutment, La/Bf = 0.44. Figure 9. Effect of variable discharge on water-surface profiles and velocity distributions for constant abutment length. 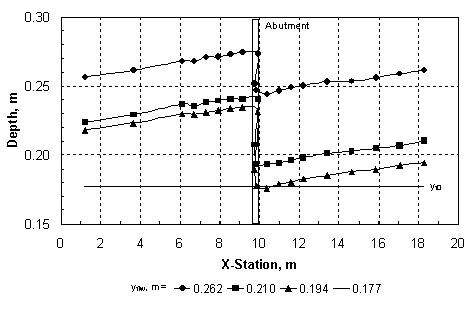 (a) Compound Channel B: Water-Surface Profiles, VW Abutment, La/Bf = 1.0, Q = 0.0567 m3/s. 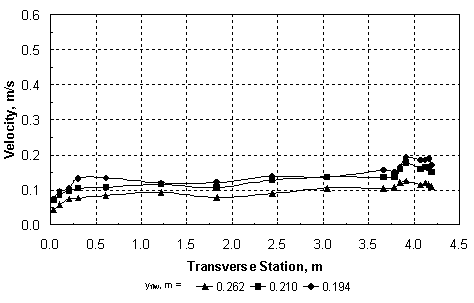 (b) Compound Channel B: Approach Velocity Distributions, VW Abutment, La/Bf = 1.0, Q = 0.0567 m3/s. Figure 10. Effect of tailwater (yftw) on water-surface profiles and velocity distributions for constant discharge. highest tailwater in figure 10 corresponds to a relative floodplain depth of yf/ym = 0.27, at which the floodplain/main-channel velocity interactions become minimal, but the discharge per unit width must still be significantly larger in the main channel than the floodplain because of the larger depths there. Hence, even at these larger depths, the compound channel in these experiments cannot be treated as a rectangular channel in which the discharge per unit width is uniform across the channel. As scour occurs over time, the hydraulic conditions at the contracted section change to the extent that the scour hole is large enough to alter the channel geometry. Water-surface profiles were measured before and after scour and some representative results are compared in figures 11 and 12. The water-surface profiles before scour were measured for a fixed bed of the same sediment as the movable bed, while the water-surface profiles after scour were measured after the scour hole had reached equilibrium. In figure 11, water-surface profiles before and after scour are compared for relative abutment lengths of 0.44 and 0.88. In figure 11(a), the tailwater is equal to the normal depth, while for the longer abutment shown in figure 11(b), the discharge is less and the tailwater is higher than the normal depth. The scour depths in figures 11(a) and 11(b) are 13.4 cm and 20.1 cm, respectively. Thus, the combination of a larger scour depth and wider scour hole in a narrower contracted section causes a marked decrease in the water depths upstream of the abutment after scour as shown in figure 11(b), while the change in the water-surface profile shown in figure 11(a) is much smaller. A similar comparison is shown in figure 12 for abutments that encroach on the main channel (La/Bf = 0.97 and 1.0). In comparison with figure 11(b), the water-surface profile drops much more after scour as shown in figure 12(a), even though the water discharge and the scour depths are the same (20.1 cm). This is probably caused by the increased backwater and narrower contraction as shown in figure 12(a). Upon comparison of figures 12(a) and 12(b), the scour depth in figure 12(b) is 18.3 cm, which is just slightly less than that in figure 12(a). The tailwater has been raised in figure 12(b) and the abutment is slightly longer. Apparently, these differences are sufficient to cause a greater water-surface drop after scour, almost to the level of the tailwater elevation downstream as shown in figure 12(b). All of the scour and all of the flow are forced to occur in the main channel of the contracted section for the conditions of figure 12(b). Main-Channel Centerline Velocity ProfilesThe ADV was used to measure centerline velocity profiles in the main channel starting from the approach section and continuing downstream to the contracted section. Velocities were measured in three dimensions, with the x-coordinate positive in the longitudinal flow direction, the y-coordinate positive upward, and the z-coordinate positive to the right when looking downstream. The x and z components of the velocity, Vx and Vz, are shown in figures 13, 14, and 15 for relative abutment lengths of 0.88, 0.97, and 1.0 as a function of the relative depth y'/ym, where ym = local depth in the main channel and y' = vertical coordinate taken positive upward from the bottom of the main channel. The vertical components of the velocity were positive downward as drawdown occurred toward the contracted section; however, they were an order of magnitude smaller than the z components (lateral components) of the velocity and are not shown in the figures. The stations (STA.) shown in figures 13, 14, and 15 refer to the distance in meters downstream from the channel entrance. The centerline of the abutment is located at STA. 9.8. 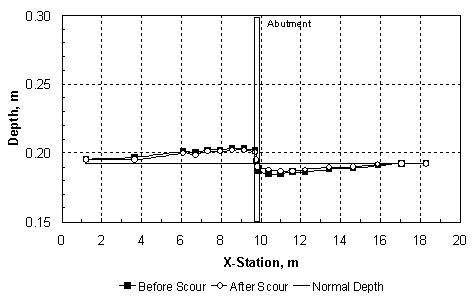 (a) Tailwater equal to normal depth, Compound Channel B: Water-Surface Profiles, VW Abutment, La/Bf = 0.44, Q = 0.0850 m3/s. 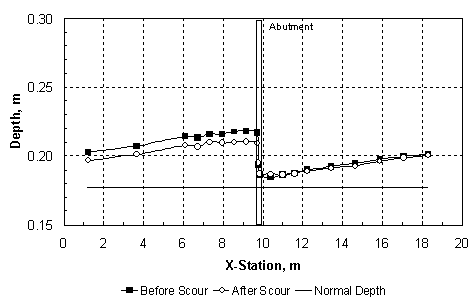 (b) Tailwater greater than normal depth, Compound Channel B: Water-Surface Profiles, VW Abutment, La/Bf = 0.88, Q = 0.0567 m3/s (B). Figure 11. Water-surface profiles before and after scour for La/Bf = (a) 0.44 and (b) 0.88. 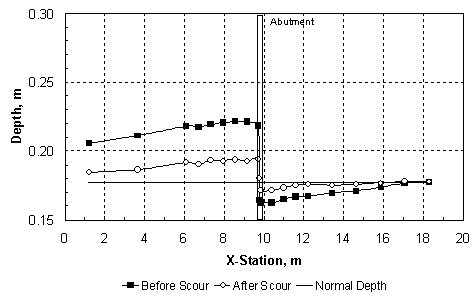 (a) Tailwater equal to normal depth, Compound Channel B: Water-Surface Profiles, VW Abutment, La/Bf = 0.97, Q = 0.0567 m3/s. 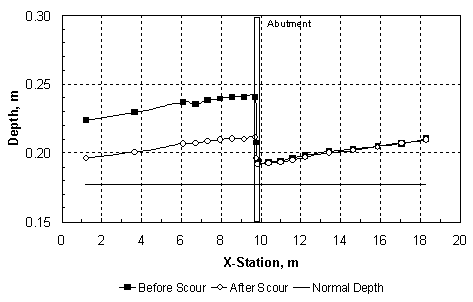 (b) Tailwater greater than normal depth, Compound Channel B: Water-Surface Profiles, VW Abutment, La/Bf = 1.0, Q = 0.0567 m3/s (B). Figure 12. Water-surface profiles before and after scour for La/Bf = (a) 0.97 and (b) 1.0. The longitudinal velocities, Vx, in figures 13(a), 14(a), and 15(a), show that while there is significant acceleration in the main channel from STA. 6.1 to STA. 8.5, most of the acceleration occurs between STA. 8.5 and STA. 9.8. The flow from the floodplain joins the flow in the main channel as the contracted section is approached. This lateral flow is apparent in figures 13(b), 14(b), and 15(b), where its velocity, Vz, is observed to continuously increase as the contracted section is approached. The lateral velocities vary from 10 to 15 percent of the longitudinal velocities. The corresponding water-surface profiles have already been shown as figures 11(b), 12(a), and 12(b), and they show a very gradual increase in depth from STA. 6.1 to STA. 8.5 followed by a leveling off up to the upstream side of the embankment and then an abrupt drop into the contracted section itself. The three-dimensional velocities shown in figures 13, 14, and 15 make it clear that the lateral flux of flow from the floodplain into the main channel creates a driving mechanism for scour in addition to the horseshoe vortexes shed at the upstream edge of the abutment. The magnitudes of the velocities in figures 13, 14, and 15 relative to the critical velocity for the initiation of motion suggest a dilemma for conducting live-bed scour experiments with long abutments in which sediment transport occurs only in the main channel upstream of the abutment. If the critical velocity of the sediment is approximately 50 cm/s, for example, then no sediment transport can occur in the approach section where the velocities in the main channel are approximately 20 cm/s; however, large scour depths can occur in the contracted section where the initial velocities are higher than 50 cm/s. An increase in discharge will increase the velocity in the contracted section and cause more scour; however, it will result in relatively small increases in the approach velocity in the main channel as shown previously in figure 9(b). On the other hand, increases in tailwater to limit the scour depth at the same discharge only serve to increase the critical velocity while decreasing the approach flow velocities. This leaves the alternative of a drastic reduction in sediment size to achieve a critical velocity of less than 20 cm/s, but then the scour depth will become significantly larger if maximum clear-water scour has not been reached, with the danger of bottoming out on the flume floor. Thus, the compound cross section, sediment size, and sediment thickness must be specifically designed for the case of live-bed scour. Critical VelocityCritical velocity for the initiation of sediment motion at the abutment face was measured for all three sediments. The tailwater was raised higher than the normal depth for a given flow rate, the flow rate was set, and then the tailgate was gradually lowered until the normal depth for that flow rate was reached. If sediment motion did not occur, then the tailgate was raised again and the flow rate was increased. This process was repeated until sediment motion had just begun at the face of the abutment. The determination of the conditions for the initiation of sediment motion necessarily involved some qualitative judgment; hence, there is scatter in the data points shown in figure 16. Only for sediment C was it possible to initiate motion on the floodplain with no abutments in place and for uniform flow. This experimental point is also shown in figure 16. Shown for comparison in figure 16 are the various relationships that can be used to calculate the critical conditions in terms of the critical value of the sediment number Nsc: 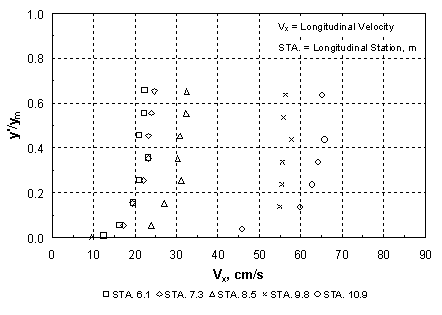 (a) Main-Channel Centerline Velocity-x, VW Abutment, La/Bf = 0.88, Q = 0.0567 m3/s (B). 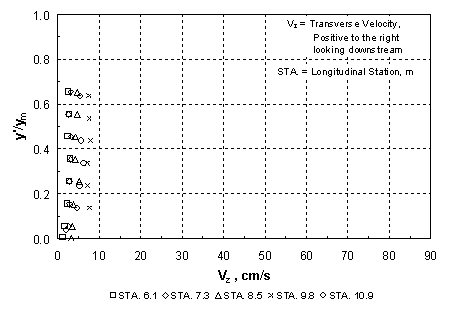 b) Main-Channel Centerline Velocity-z, VW Abutment, La/Bf = 0.88, Q = 0.0567 m3/s (B). Figure 13. Main-channel centerline velocity from approach to contracted section for La/Bf = 0.88. 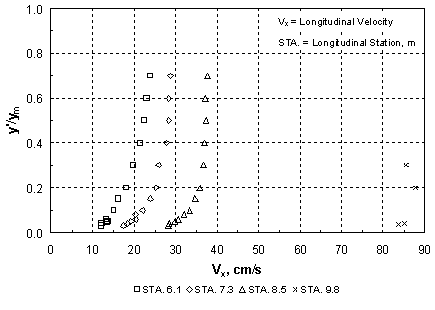 (a) Main-Channel Centerline Velocity-x, VW Abutment, La/Bf = 0.97, Q = 0.0567 m3/s. 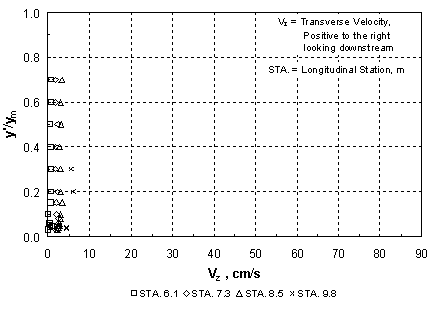 (b) Main-Channel Centerline Velocity-z, VW Abutment, La/Bf = 0.97, Q = 0.0567 m3/s. Figure 14. Main-channel centerline velocity from approach to contracted section for La/Bf = 0.97. 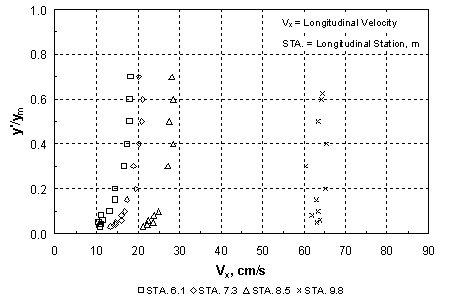 (a) Main-Channel Centerline Velocity-x, VW Abutment, La/Bf = 1.0, Q = 0.0567 m3/s (B). 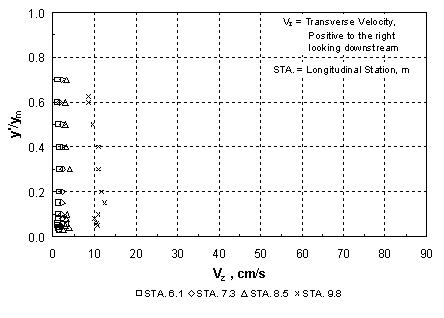 (b) Main-Channel Centerline Velocity-z, VW Abutment, La/Bf = 1.0, Q = 0.0567 m3/s (B). Figure 15. Main-channel centerline velocity from approach to contracted section for La/Bf = 1.0. *Note that for the following equations 20 through 22, N subscript SC is a critical sediment number that equals the quotient that results from dividing the critical velocity by a denominator that consists of the following: the specific gravity of sediment minus 1, which is then multiplied by both the gravitational acceleration and the median sediment grain diameter, and then raised to the power of one-half.
where Nsc = Vc/[(SG - 1)gd50]1/2, Vc = critical velocity, SG = specific gravity of sediment, d50 = median sediment grain diameter, y = flow depth, and Equations 20, 21, and 22 can be used in either SI or U.S. units. Equation 20 is an empirical fit of the data taken by Parola on rock riprap in a laboratory channel as reported by Pagan-Ortiz,(85) while equation 22 follows directly from Keulegan's equation, with ks = 2d50 and the definition of the critical shear velocity in terms of Shields' parameter. However, the assumptions embedded in equation 21 can be clarified by outlining its derivation. As shown by Sturm and Sadiq,(23) expressing shear stress in terms of slope from the assumption of uniform flow and substituting for the slope from Manning's equation results in: where Cn = 1.486 in U.S. units and 1.0 in SI units; kn = constant in Strickler-type relationship for Manning's n (n = knd501/6), which is equal to 0.0340 in U.S. units and 0.0414 in SI units; SG = specific gravity of the sediment;
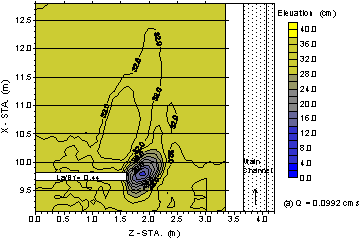
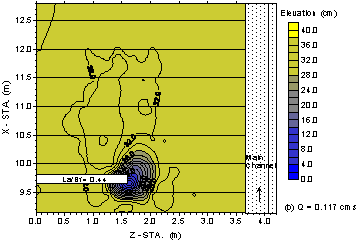
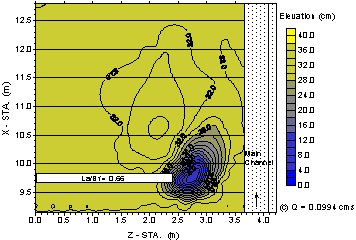
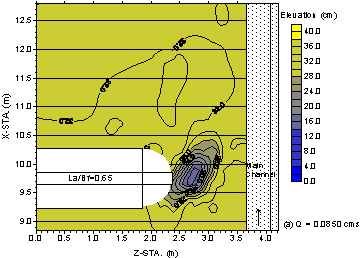
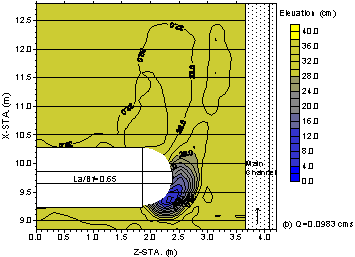
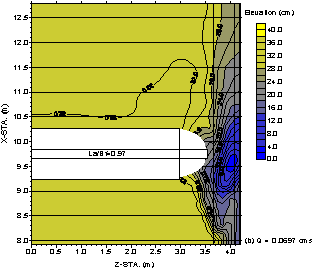
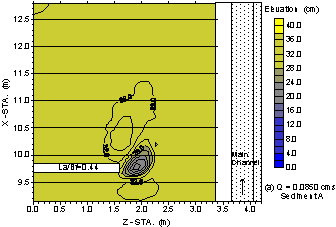
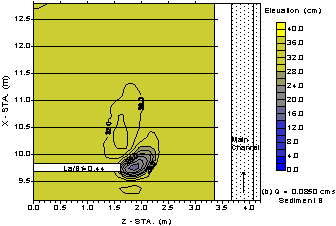
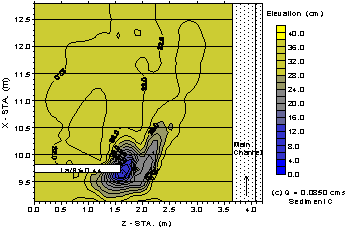
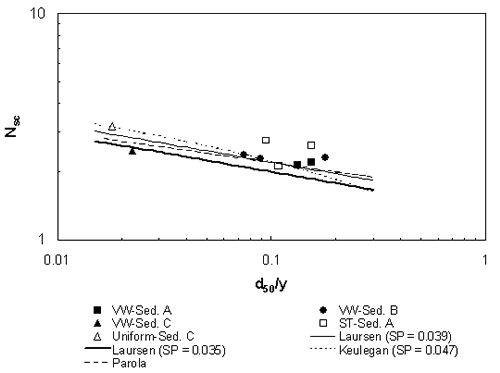 Figure 16. Measured and calculated critical velocities at incipient motion. (SP = Shields Parameter). Equilibrium Scour DepthsRaw data for the full set of equilibrium scour experiments are given in table 2. Several depths and velocities were measured prior to the beginning of scour for the fixed-bed case, and they are summarized in the table. The normal depth in the floodplain is yf0 and it varies with the discharge according to the uniform-flow measurements described previously in this chapter. In some instances, for the longer abutments, the tailgate was raised to submerge normal depth and limit the maximum scour. Under these conditions, the depth in the floodplain just upstream of the tailgate was measured and is reported as yftw to indicate a tailwater different from the normal depth. The approach velocity and depth, Vf1 and yf1, were measured in the floodplain upstream of the end of the abutment at the approach cross section, which was taken either as station 6.7 or 7.3 for La/Bf Typical scour contours are shown in figures 17 through 22. The contours are given in terms of bed elevation in centimeters. The undisturbed floodplain and main-channel elevations at the station corresponding to the centerline of the abutment (station 9.75) are approximately 32.3 cm and 16.9 cm, respectively. A typical scour hole is shown in figure 17(a) for an intermediate vertical-wall abutment length (La/Bf = 0.44) and a discharge of 0.0992 m3/s. The bottom of the scour hole is displaced laterally from the abutment face and the long axis of the scour hole is skewed from the approach flow direction as an indication of the deflected streamlines in the contracted section. A prominent bar deposit can be seen on the downstream side of the abutment in the region where the flow is expanding. An increase in discharge to 0.117 m3/s is shown in figure 17(b), and the shape and location of the scour hole have changed. The maximum depth of scour occurs at the upstream corner of the abutment face, and the scour-hole shape is more
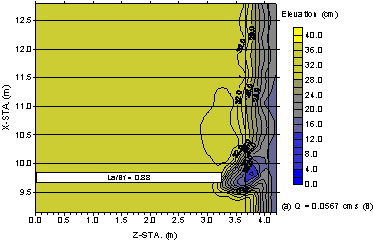
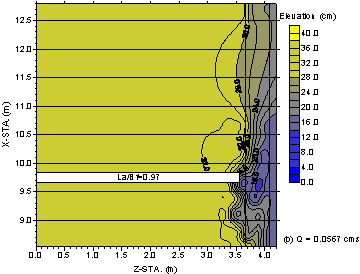
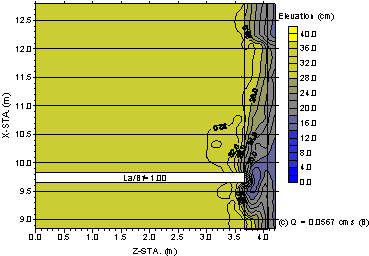
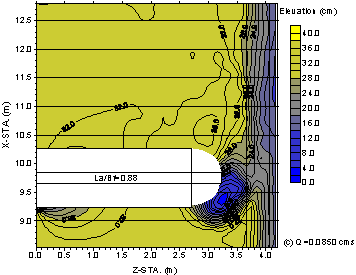
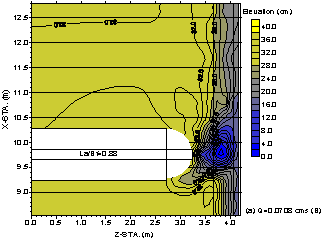
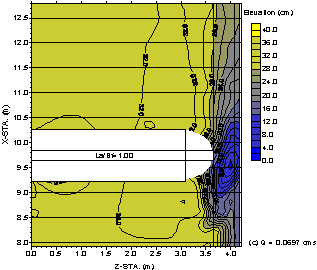
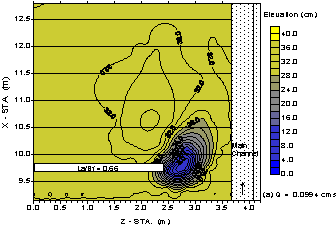
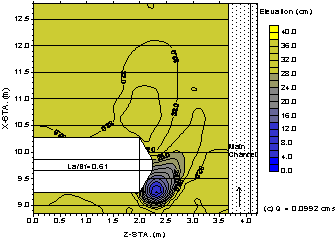
nearly conical. The effect of increasing the abutment length is shown in figure 17(c), with essentially the same discharge as in figure 17(a). The scour hole is obviously larger in both depth and volume. The point of deepest scour is again displaced laterally from the face of the abutment, and the scour hole is elongated as in figure 17(a). Scour-hole contours for the longer vertical-wall abutment lengths (La/Bf = 0.88, 0.97, and 1.0) are illustrated in figure 18. The discharge of 0.0567 m3/s is the same for all three abutment lengths in figure 18; however, the tailwater varies. It is equal to the normal floodplain depth (8.2 cm) in figure 18(b), and has a ratio to the normal floodplain depth of 1.95 and 2.32 in figures 18(a) and 18(c), respectively. The scour hole in figure 18(a) retains the laterally displaced elongated shape observed in figures 17(a) and 17(c); however, it extends into the sideslope of the main channel. As the abutment encroaches on the main channel in figures 18(b) and 18(c), there is a definite contraction-scour effect; however, multiple scour holes are apparent in figure 18(b) that combine local and contraction scour. Scour-hole shapes for the spill-through abutment can be observed in figures 19 and 20. At the lower discharge of 0.0850 m3/s in figure 19(a) as compared to figure 19(b), the scour hole is laterally displaced from the centerline of the abutment face. As the discharge increases, it moves to the upstream quadrant of the abutment face, and the deepest point of the scour hole is located immediately adjacent to the abutment. Comparing figure 19(b) with figure 18(c), for which the discharge and abutment length are essentially the same, the scour hole for the vertical-wall abutment is deeper and remains laterally displaced from the centerline of the abutment face. Apparently, all other things being equal, the discharge required to localize the scour hole to the upstream corner of the abutment is lower for the spill-through abutment. It is interesting to note from figure 19(c) that an increase in relative abutment length La/Bf to 0.88 does not change the essential shape of the scour hole. Although there is some minor encroachment of the scour hole into the main channel, it is much less than in the case of the vertical-wall abutment of the same length in figure 18(a), having a smaller discharge. However, comparing figures 19(c) and 20(a) for the same length of spill-through abutment (La/Bf = 0.88), but for a smaller discharge in figure 20(a), the scour hole moves almost completely into the main channel in figure 20(a). In figures 20(b) and 20(c), the scour process appears to be dominated by contraction scour that moves well upstream of the abutment as a headcut and extends considerably downstream as well. The influence of the abutment shape at the same discharge and at essentially the same abutment length is illustrated in figure 21 where scour contours are shown for the vertical-wall, spill-through, and wingwall abutments. The maximum scour depths in figures 21(a), 21(b), and 21(c) are 29.0 cm, 22.9 cm, and 23.2 cm, respectively. The laterally displaced and elongated scour hole for the vertical-wall abutment shown in figure 21(a) moves next to the abutment face in the upstream quadrant in figure 21(b). In figure 21(c), the scour hole is also in the upstream quadrant of the abutment face; however, it is more conical in shape and has been displaced laterally. The dependence of the maximum scour depth on the abutment shape is related to the degree of flow blockage so that for long abutments with a high degree of blockage, the local effect of the separation zone on the scour as affected by shape diminishes.
Figure 17. Bed elevations for shorter VW abutments after scour (cms = m3/s).
Figure 18. Bed elevations for longer VW abutments after scour (cms = m3/s).
Figure 19. Bed elevations for shorter ST abutments after scour (cms = m3/s).
Figure 20. Bed elevations for longer ST abutments after scour (cms = m3/s).
Figure 21. Bed elevations for VW, ST, and WW abutments after scour (cms = m3/s).
Sediment size effects on clear-water abutment scour are shown in figure 22 for sediments A, B, and C for the conditions of the same discharge and same length of a vertical-wall abutment. The scour-hole shapes and depths, as well as the downstream bar deposits for sediments A and B, are very similar (as shown in figures 22(a) and 22(b)), probably because of their small difference in size. For sediment C, however, the scour hole is significantly enlarged both in lateral extent and depth. In addition, the velocities exiting the main scour hole are sufficient to erode an elongated trench downstream of the main scour hole. There can be no doubt that sediment size as reflected by critical velocity has an important effect on the depth of the clear-water scour.
Figure 22. Bed elevations for VW abutments and sediments A, B, and C (cms = m3/s). |