U.S. Department of Transportation
Federal Highway Administration
1200 New Jersey Avenue, SE
Washington, DC 20590
202-366-4000
Federal Highway Administration Research and Technology
Coordinating, Developing, and Delivering Highway Transportation Innovations
 |
| This report is an archived publication and may contain dated technical, contact, and link information |
|
Publication Number: FHWA-RD-03-060 |
Previous | Table of Contents | Next
3.1 Introduction
This chapter describes the application of a statistically designed mixture experiment to the problem of optimizing properties of HPC. In a mixture experiment, the total amount (mass or volume) of the mixture is fixed, and the factors or component settings are proportions of the total amount. For concrete, the sum of the volume fractions is constrained to sum to one (as in the ACI mix design approach). Since the volume fractions must sum to unity, the component variables in a mixture experiment are not independent.
A mixture experiment was designed to find the optimum proportions for a concrete mix meeting the following conditions: slump of 50 to 100 mm, 1-day compressive strength of 22.06 MPa, 28-day compressive strength of 51.02 MPa, 42-day charge passed in American Society for Testing and Materials (ASTM) C1202 "rapid chloride" test (RCT) less than 700 coulombs, and minimum cost. The materials (components) used included water, cement, silica fume, high-range water-reducing admixture (HRWRA), coarse aggregate, and fine aggregate.
3.2 Selection of Materials, Proportions, and Constraints
The proportions for the six-component mixture experiment initially were selected in terms of volume fraction and converted to weights for batching. The minimum and maximum levels of each component were chosen based on typical volume fractions for non-air-entrained concrete with the constraint that the volume fractions sum to unity. In addition to the individual constraints on each component, the paste fraction of the concrete (water, cement, silica fume, and HRWRA) was required to range from 25 to 35 percent by volume. Although air is incorporated into concrete during mixing, it is not an initial component and therefore was not considered to be a component of the mixture. Ignoring the air content as a mix component affects yield calculations, but these are not important for the small trial batches and can be adjusted later after a final mix is selected.
The materials used in this study included a Type I/II portland cement, tap water, #57 crushed limestone coarse aggregate, natural sand, silica fume (in slurry form), and a naphthalene sulfonate-based HRWRA meeting ASTM C494 Type F/G. The final volume fraction ranges of the 6 mixture components are shown in table 5. The volume fractions were converted to corresponding weights using the specific gravities and percent solids (where applicable) obtained from laboratory testing or from the material supplier.
3.3 Experiment Design Details
Selecting an appropriate experiment design depends on several criteria, such as ability to estimate the underlying model, ability to provide an estimate of repeatability, and ability to check the adequacy of the fitted model.
Table 5. Material volume fraction ranges for mixture experiment
| Component | ID | Minimum volume fraction | Maximum volume fraction |
|---|---|---|---|
| Water | x1 | .16 | .185 |
| Cement | x2 | .13 | .15 |
| Silica fume | x3 | .013 | .027 |
| HRWRA | x4 | .0046 | .0074 |
| Coarse aggregate | x5 | .40 | .4424 |
| Fine aggregate | x6 | .25 | .2924 |
The "best" experiment design depends on the choice of an underlying model which will adequately explain the data. For this experiment, the following quadratic Scheffé polynomial was chosen as a reasonable model for each property as a function of the six components:
| Equation 10: |
 |
This model is an extension of equation 4 for the 6-component case. Because there are 21 coefficients in the model, the design must have at least 21 runs (21 distinct mixes) to estimate these coefficients. In addition to the 21 required runs, 7 additional runs (distinct mixes) were included to check the adequacy of the fitted model, and 5 mixes were replicated to provide an estimate of repeatability. The replicates were required to test the statistical significance of the fitted coefficients. Finally, a single mix was replicated during each week of the experiment to check statistical control of the fabrication and measurement process. In all, a total of 36 mixes were planned.
Commercially available computer software for experiment design was used to design and analyze the experiment. The program selected 36 points from a list of candidate points that is known to include the best points for fitting a quadratic polynomial. A modified-distance design was chosen to ensure that the design selected could estimate the quadratic mixture model while spreading points as far away as possible from one another.
Table 6 summarizes the mixture proportions used in the experiment. The run order was randomized to reduce the effects of extraneous variables not explicitly included in the experiment. The first three mixes were repeated at the end of the program (runs 37, 38, and 39), because an incorrect amount of water was used in batching the mixes. The test results from the incorrectly batched mixes were not included in the subsequent analysis. Of the final 36 mixes, 8 were replicates (one each from mixes 5, 11, 20, 38, 71 and three from mix 127).
3.4 Specimen Fabrication and Testing
Thirty-nine batches of concrete, each approximately .04 m3 in volume, were prepared over a four-week period. A rotating-drum mixer with a 0.17 m3 capacity was used to mix the concrete.
Table 6. Mixture proportions for mixture experiment
| Design ID | Run Order | Water (kg) | Cement (kg) | Silica Fume (kg) | HRWRA (l) | Coarse Aggregate (kg) | Fine Aggregate (kg) | w/(c+sf) |
|---|---|---|---|---|---|---|---|---|
| 5(r) | 7, 22 | 122.3 | 312.9 | 45.4 | 3.52 | 867.6 | 506.3 | 0.35 |
| 11(r) | 6, 23 | 141.4 | 312.9 | 21.9 | 3.52 | 845.3 | 506.3 | 0.43 |
| 13 | 15 | 122.3 | 312.9 | 21.9 | 3.52 | 810.1 | 592.2 | 0.37 |
| 15 | 2*, 38 | 126.6 | 361.1 | 45.4 | 5.66 | 810.1 | 506.3 | 0.32 |
| 16 | 8 | 122.3 | 312.9 | 21.9 | 3.52 | 895.9 | 506.3 | 0.37 |
| 20(r) | 13, 34 | 141.4 | 312.9 | 21.9 | 3.52 | 810.1 | 541.8 | 0.43 |
| 22 | 4 | 141.4 | 354.8 | 21.9 | 3.52 | 810.1 | 506.3 | 0.38 |
| 28 | 16 | 122.3 | 312.9 | 45.4 | 3.52 | 810.1 | 563.8 | 0.35 |
| 37 | 30 | 122.3 | 337.0 | 45.4 | 5.66 | 810.1 | 537.9 | 0.33 |
| 38(r) | 3*, 26, 39 | 135.0 | 341.1 | 45.4 | 3.52 | 810.1 | 506.3 | 0.36 |
| 48 | 28 | 131.8 | 312.9 | 21.9 | 5.66 | 810.1 | 561.2 | 0.41 |
| 63 | 27 | 131.8 | 312.9 | 45.4 | 5.66 | 836.6 | 506.3 | 0.38 |
| 65 | 31 | 122.3 | 337.0 | 45.4 | 5.66 | 841.7 | 506.3 | 0.33 |
| 66 | 25 | 122.3 | 312.9 | 45.4 | 5.66 | 836.0 | 532.2 | 0.35 |
| 70 | 29 | 122.3 | 361.1 | 21.9 | 4.59 | 810.1 | 548.8 | 0.33 |
| 71(r) | 5, 35 | 122.3 | 361.1 | 21.9 | 5.66 | 829.9 | 526.1 | 0.33 |
| 78 | 11 | 141.4 | 312.9 | 45.4 | 5.66 | 810.7 | 506.9 | 0.41 |
| 87 | 24 | 122.3 | 312.9 | 21.9 | 3.52 | 853.0 | 549.2 | 0.37 |
| 89 | 19 | 122.3 | 337.0 | 21.9 | 3.52 | 810.1 | 571.9 | 0.35 |
| 91 | 9 | 141.4 | 312.9 | 21.9 | 5.66 | 824.9 | 521.1 | 0.43 |
| 98 | 17 | 122.3 | 337.0 | 21.9 | 3.52 | 875.7 | 506.3 | 0.35 |
| 101 | 10 | 130.8 | 361.1 | 21.9 | 3.52 | 832.8 | 506.3 | 0.35 |
| 103 | 14 | 122.3 | 361.1 | 21.9 | 4.59 | 852.6 | 506.3 | 0.33 |
| 110 | 21 | 130.8 | 361.1 | 21.9 | 3.52 | 810.1 | 529.0 | 0.35 |
| 116 | 33 | 131.8 | 312.9 | 45.4 | 5.66 | 810.1 | 532.8 | 0.38 |
| 123 | 36 | 122.3 | 337.0 | 33.6 | 4.59 | 834.4 | 530.6 | 0.34 |
| 127(c) | 1*, 12, 18, 32, 37 | 131.5 | 335.8 | 21.9 | 4.59 | 829.9 | 526.1 | 0.38 |
| 163 | 20 | 126.6 | 323.3 | 27.8 | 5.12 | 857.5 | 513.6 | 0.37 |
Notes: Aggregate masses are in dry condition (r) replicated mix (c) control mix * mix that was repeated due to incorrect batching | ||||||||
Each batch included sufficient concrete for two slump tests, two fresh air content (ASTM C231) tests, two unit weight tests, and ten 100 mm x 200 mm cylinders. The cylinders were fabricated in accordance with ASTM C192. To obtain adequate consolidation, cylinders for concretes with slumps less than 50 mm were vibrated on a vibrating table; otherwise, the cylinders were rodded. The cylinders were covered with plastic and left in the molds for 22 hours, after which they were stripped and placed in limewater-filled curing tanks for moist curing at 23 ±ºC.
Compressive strength tests (ASTM C39) were conducted on the cylinders at the ages of 1 day and 28 days. In most cases, three cylinders were tested for each age. A fourth test was performed in some cases if one result was significantly lower or higher than the others. Before testing, the cylinder ends were ground parallel to meet the ASTM C39 requirements using an end-grinding machine designed for this purpose. The three remaining cylinders from each batch were used for "rapid chloride" testing according to ASTM C1202. Three 50-mm thick slices taken from the middle sections of the concrete cylinders were tested at an age of 42 days.
3.5 Results and Analysis
3.5.1 Measured Responses
The average values for slump, 1-day strength, 28-day strength, and RCT charge passed for each batch are shown in table 7, along with the estimated cost per cubic meter of concrete. The cost of each batch was calculated from the mix proportions using approximate costs for each component material obtained from a local ready-mix concrete producer. For each of the four responses, a model was fit using least-squares methods, validated (by examining the residuals for trends and outliers), and interpreted graphically using contour and trace plots. The statistical analysis is described in detail for 28-day strength. The analyses for the other properties were performed in a similar manner. ANOVA tables, model statistics, and plots for all responses are included in Appendix A.
3.5.2 Model Identification and Validation for 28-Day Strength
In this section, a detailed description of the process of model identification and validation is provided for the response 28-day strength. The models for other responses were identified and validated in the same way. Those models are presented in the next section.
The first step in the analysis is to select a plausible model. Even though the experiment design used permits estimation of a quadratic model, a linear model may provide a better fit to the data.
ANOVA is used to assess the different models.
ANOVA results for 28-day strength are shown in table 8. In this table, each row tests whether the coefficients of certain model terms are equal to zero. For example, the row with source "Linear" tests whether the coefficients of the linear terms are equal to zero. A low value (say, less than 0.05) of "Prob > F" , also called the p-value, supports the conclusion that the coefficients differ from zero and should be included in the model. For the data in table 7, the "Prob > F" is 0.0011; therefore, the linear terms should be included in the model. The row with source "Quadratic" tests whether any quadratic coefficients differ from zero. Since the "Prob >F" of 0.5667 exceeds 0.05, the quadratic terms should not be included in the model.
Table 7. Test results and costs (mixture experiment)
| Design ID | Run | Slump (mm) | 1 Day Str (MPa) | 28 Day Str (MPa) | 42 Day RCT (coulombs) | Cost ($/ m3) |
|---|---|---|---|---|---|---|
| 22 | 4 | 67 | 21.5 | 48.2 | 1278 | 95.18 |
| 71 | 5 | 57 | 27.0 | 55.2 | 862 | 102.22 |
| 11 | 6 | 102 | 16.8 | 48.5 | 1162 | 91.32 |
| 5 | 7 | 13 | 22.4 | 48.5 | 387 | 118.85 |
| 16 | 8 | 35 | 21.6 | 53.1 | 776 | 92.20 |
| 91 | 9 | 200 | 16.8 | 60.4 | 1027 | 96.89 |
| 101 | 10 | 22 | 26.6 | 53.6 | 744 | 96.24 |
| 78 | 11 | 127 | 19.2 | 51.7 | 492 | 123.56 |
| 127 | 12 | 99 | 21.5 | 50.2 | 842 | 96.67 |
| 20 | 13 | 118 | 18.2 | 50.9 | 903 | 91.32 |
| 103 | 14 | 64 | 27.4 | 54.6 | 583 | 99.42 |
| 13 | 15 | 57 | 21.8 | 53.2 | 684 | 92.20 |
| 28 | 16 | 29 | 22.2 | 53.6 | 292 | 118.85 |
| 98 | 17 | 32 | 25.3 | 51.9 | 604 | 94.41 |
| 127 | 18 | 92 | 22.3 | 54.1 | 847 | 96.67 |
| 89 | 19 | 38 | 21.8 | 54.3 | 720 | 94.41 |
| 163 | 20 | 95 | 22.1 | 60.8 | 554 | 103.80 |
| 110 | 21 | 51 | 24.7 | 53.2 | 792 | 96.24 |
| 5 | 22 | 25 | 23.4 | 54.1 | 348 | 118.85 |
| 11 | 23 | 114 | 16.5 | 48.0 | 968 | 91.32 |
| 87 | 24 | 67 | 22.9 | 51.0 | 700 | 92.20 |
| 66 | 25 | 76 | 24.7 | 59.8 | 316 | 124.44 |
| 38 | 26 | 29 | 23.0 | 53.2 | 390 | 120.85 |
| 63 | 27 | 124 | 21.7 | 55.2 | 302 | 123.99 |
| 48 | 28 | 171 | 23.0 | 58.1 | 682 | 97.34 |
| 70 | 29 | 51 | 27.5 | 54.5 | 505 | 99.42 |
| 37 | 30 | 35 | 27.3 | 56.0 | 245 | 126.65 |
| 65 | 31 | 32 | 27.2 | 51.1 | 310 | 126.65 |
| 127 | 32 | 121 | 22.4 | 57.2 | 636 | 96.67 |
| 116 | 33 | 114 | 23.9 | 56.2 | 356 | 123.99 |
| 20 | 34 | 127 | 18.6 | 51.6 | 820 | 91.32 |
| 71 | 35 | 108 | 28.8 | 65.3 | 553 | 102.22 |
| 123 | 36 | 99 | 26.6 | 61.0 | 340 | 110.53 |
| 127 | 37 | 102 | 24.2 | 54.6 | 640 | 96.67 |
| 15 | 38 | 51 | 28.8 | 58.1 | 239 | 128.68 |
| 38 | 39 | 25 | 23.6 | 54.5 | 332 | 120.85 |
Table 8. Sequential model sum of squares for 28-day strength (mixture experiment)
| Source | Sum of Squares | DF | Mean Square | F Value | Prob > F |
|---|---|---|---|---|---|
| Mean | 106212.98 | 1 | 106212.98 | - | - |
| Linear | 257.52 | 5 | 51.50 | 5.46 | 0.0011 |
| Quadratic | 135.19 | 15 | 9.01 | 0.92 | 0.5665 |
| Residual | 147.62 | 15 | 9.84 | - | - |
| Total | 106753.31 | 36 | 2965.37 | - | - |
A lack-of-fit test can also be performed using ANOVA. To do so, the residual sum of squares is partitioned into lack-of-fit and pure error (from replicates) components. The mean squares and F statistic are calculated, and the "Prob > F" is determined. The desired result is an insignificant lack-of-fit, indicated by a "Prob > F" greater than 0.05. For 28-day strength, the lack-of-fit test for the linear model gives "Prob > F" equal to 0.7193, which is insignificant (the ANOVA tables for the lack-of-fit test for 28-day strength and the other responses are provided in Appendix A).
The resulting linear model for 28-day strength (y1), fit by least squares, is with the residual standard deviation s = 3.07 MPa. The residual standard deviation s is defined as:
| Equation 11: |
 |
| Equation 12: |
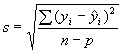 |
where the number of observations n = 36 and the number of parameters in the fitted model p = 6. A value of s near the repeatability value (replicate standard deviation) is an indication of an adequately fitting model. The repeatability value is 3.39 MPa, which is close to s.
Residual plots are used to validate the fitted model. The residuals are the
deviations of the observed data from the fitted values, ![]() .
The residual
.
The residual ![]() estimates
the error terms ei in the model. The ei are
assumed to be random and normally distributed with mean zero and constant standard
deviation. The residuals, which estimate these errors, should exhibit similar
properties. Essentially, an adequate model should capture all information in
the data leaving structureless, random residuals. If structure remains in the
residuals, residual plots often will suggest how to modify the model to remove
the structure. In this study, plots of residuals versus run sequence and a
plot of the control mix results revealed a linear trend in the data for each
response. However, because the run sequence was randomized, this trend had
little impact on the fitted models.
estimates
the error terms ei in the model. The ei are
assumed to be random and normally distributed with mean zero and constant standard
deviation. The residuals, which estimate these errors, should exhibit similar
properties. Essentially, an adequate model should capture all information in
the data leaving structureless, random residuals. If structure remains in the
residuals, residual plots often will suggest how to modify the model to remove
the structure. In this study, plots of residuals versus run sequence and a
plot of the control mix results revealed a linear trend in the data for each
response. However, because the run sequence was randomized, this trend had
little impact on the fitted models.
3.5.3 Models for Other Responses
Using the same procedure described above for 28-day strength, the following models were fit to slump (y2), 1-day strength (y3), and 42-day charge passed (y4):
| Equation 13: |
| Equation 14: |
 |
| Equation 15: |
Linear models were adequate for all responses except 1-day strength, for which the fitted model includes 4 quadratic terms that were found to be significant. A natural logarithm transform was used to model 42-day charge passed because residual plots showed that the standard deviation of the data for charge passed was proportional to the mean.
3.6 Optimization
3.6.1 Graphical Interpretation
Once a valid model is identified, it can be interpreted graphically using response trace plots and contour plots. A response trace plot is shown in figure 6. This figure consists of six overlaid plots, one for each component. For a given component, the fitted value of the response is plotted as the component is varied from its low to high setting in the constrained region, while the other components are held in the same relative ratio as a specified reference mixture, here the centroid. The plot shows the "effect" of changing each component on 28-day strength. As expected, increasing the amount of water decreased strength, while increasing the amount of cement increased strength. HRWRA had the largest effect with higher amounts of HRWRA yielding higher strength. This may be due to the improved dispersion of the cement and silica fume caused by higher amounts of HRWRA. Surprisingly, an increase in silica fume appears to reduce strength. However, this apparent reduction may not be significant when compared to the underlying experimental error.
Contour plots are used to identify conditions that give maximum (or minimum) response. Because contour plots can only show three components at a time (the others components are set at fixed conditions), several must be examined. Figure 7 is a contour plot of 28-day strength for water, cement, and HRWRA, with the other components fixed at their centroid values. The plot indicates that strength increases rapidly by increasing HRWRA,confirming the result from the response trace plot. Therefore, in subsequent contour plots, HRWRA will be set at its high value.
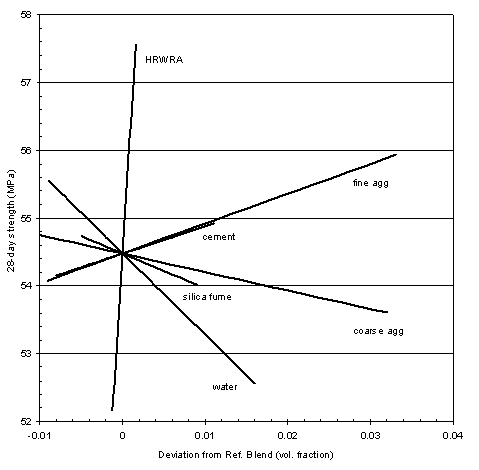
Figure 6: Response trace plot 28-day strength (mixture experiment)
Figure 8 shows a contour plot of 28-day strength in water, cement, and silica fume, and figure 9 shows a contour plot in water, coarse aggregate, and fine aggregate. In each case, HRWRA is fixed at its high value, and the other components are fixed at the centroid settings. These plots show that strength increases for low water, high cement, low silica fume, low coarse aggregate, and high fine aggregate.
The best overall settings for 28-day strength can be found using the contour plot in figure 10, which shows 28-day strength in silica fume, coarse aggregate, and fine aggregate at the best settings of water, cement, and HRWRA. The best settings (expressed as volume fractions) are water = 0.160, cement = 0.150, silica fume = 0.013, HRWRA = 0.0074, coarse aggregate = 0.400, and fine aggregate = 0.270, with a predicted strength of 59.53 MPa.
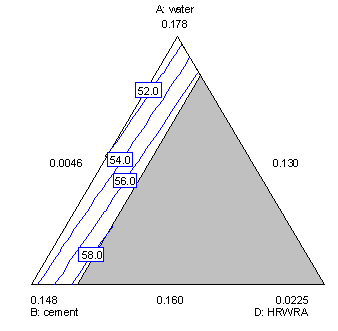
Figure 7. Contour plot for 28-day strength in water, cement, and HRWRA
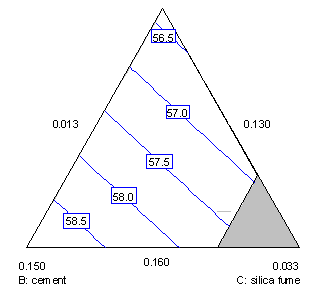
Figure 8. Contour plot for 28-day strength in water, cement, and silica fume
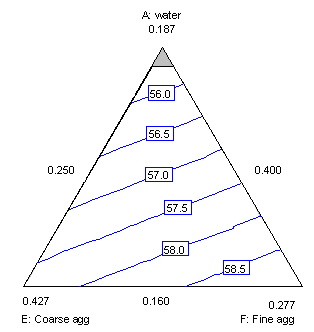
Figure 9. Contour plot for 28-day strength in water, coarse aggregate, and fine aggregate
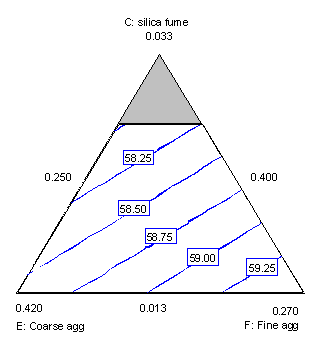
Figure 10. Contour plot for 28-day strength in silica fume, coarse aggregate, and fine aggregate.
3.6.2 Numerical Optimization
The optimum concrete mix is defined here as that mix which minimizes cost while meeting specified performance criteria. Numerical optimization using desirability functions [10] can be used to find the optimum mixture proportions in this situation. A desirability function must be defined for each response (property). The desirability function takes on values between 0 and 1, and may be defined in several ways. Figure 11 shows the desirability functions defined for the responses in this experiment. Minimum and maximum specifications are used for strength and RCT, resulting in desirability functions with values of 1 above the minimum or below the maximum, and 0 otherwise. For example, for 1-day strength the desirability value is 0 below 22.06 MPa and 1 above 22.06 MPa. At 34.48 MPa, well beyond the maximum value observed in the data, the desirability becomes 0. Desirabilities for 28-day strength and 42-day RCT are defined similarly. For slump, a range of 50 to 100 mm was specified, but the midpoint of this range, 75 mm was selected as the most desirable value (the target value). Therefore, a desirability of 1 is given to the target value of 75 mm, with a linear decrease in desirability to a value of zero at the lower and upper specification limits (see figure 11). Since cost is to be minimized, the desirability function for cost decreases linearly over the range of costs observed in the data, as shown in figure 11.
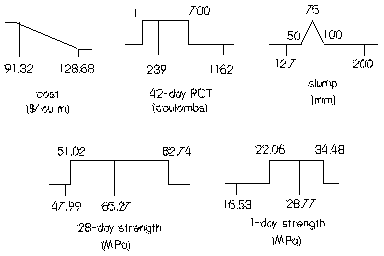
Figure 11. Desirability functions for responses in mixture experiment
The individual desirabilities can be expressed mathematically in terms of the predicted response values (see equation 9, page 14), which can be calculated for each mixture in the experiment. In this study, the overall desirability D was defined as the geometric mean of the individual desirability functions di over the feasible region of mixtures [10]:
| Equation 16: |
The optimal mix is the one with a maximum value of D, which may be determined in several ways. The simplest (but crudest) approach is to select the mixture with the largest value of D from the design points in the experiment. Another approach is to consider D as a response and fit a model to it (as one would fit a model to 28-day strength). A third approach is to use numerical search algorithms to find the maximum value of D [12]. The third approach was used here.
Based on the experimental results, the mix which maximizes D, expressed in volume fractions, is water = 0.160, cement = 0.130, silica fume = 0.013, HRWRA = 0.0049, coarse aggregate = 0.401, and fine aggregate = 0.290, at a cost of $93.01 per m3. The overall desirability value for this mix is 0.964, and the predicted response values are slump = 75 mm, 1-day strength = 22.07 MPa, 28-day strength = 54.72 MPa, and 42-day RCT value = 631 coulombs.
3.6.3 Accounting for Uncertainty
If the fitted functions for each property were known without error, the analysis would be complete. However, there is uncertainty in the fitted functions, because they are estimated from a sample of data. For example, at the current mix the predicted 1-day target strength is 22.07 ±1.01 MPa. The uncertainty provided is for a 95 percent confidence interval, i.e., we are 95 percent confident that the interval (21.06, 23.08) contains the true 1-day target strength for this mix. If this mix is used, it is quite possible that actual 1-day strength results would fall below the minimum acceptable value of 22.06 MPa. Therefore, each specification must be modified to account for uncertainties in the fitted functions. The uncertainties in the properties of the current best mix can be used to modify the constraints (performance criteria) and identify a revised optimal mix based on these new constraints. The revised mix must then be checked to see that the original specifications are met.
The predicted values and 95 percent uncertainties for the remaining responses at the current best mix are slump = 75 ±17 mm, 28-day strength = 54.72 ±3.25 MPa, and ln(42-day RCT) = 6.448 ±0.1621. The modified constraints on the responses which take into account the uncertainties are 67 mm < slump < 83 mm, 1-day target strength > 23.07 MPa, 28-day target strength > 54.27 MPa, and ln(42-day RCT) < 6.389 (42-day RCT < 595 coulombs)2. Repeating the numerical optimization, the best mix for this new set of constraints (expressed as volume fractions) is water = 0.160, cement = 0.133, silica fume = 0.014, HRWRA = 0.0054, coarse aggregate = 0.409, and fine aggregate = 0.2786 at a cost of $96.35. The predicted values and 95 percent uncertainties for this mix are slump = 76 ±15 mm, 1-day strength = 23.05 ±0.69 MPa, 28-day strength = 55.20 ±2.31 MPa, and ln(42-day RCT) = 6.404 ±0.114 (corresponding to a range of 539 to 678 coulombs). For this mix, the 95 percent confidence intervals for all responses meet the original specifications. Accounting for uncertainty increased the cost of the optimal mix by about 3 percent ($93.01 to $96.35). The value of optimization can be seen by comparing the cost of the optimal mix ($96.35) with the range of costs for all mixtures in the experiment ($91.32 to $128.68 per m3).
1 The predicted value and uncertainty for ln(42-day RCT) are provided because the ln transform was used in the model for RCT. The actual 95% confidence interval for 42-day RCT ranges from 537 to 742 coulombs with a predicted value of 631 coulombs.
2 The modified constraints are calculated by adding the uncertainty to the original lower bound constraint, or subtracting the uncertainty from the original upper bound. Thus, for slump, the new lower bound is 50 + 17 = 67 mm, and the new upper bound is 100 - 17 = 83 mm. For 1-day strength, which only has a lower bound, the new constraint is 22.06 + 1.01 = 23.07 MPa

