U.S. Department of Transportation
Federal Highway Administration
1200 New Jersey Avenue, SE
Washington, DC 20590
202-366-4000
Federal Highway Administration Research and Technology
Coordinating, Developing, and Delivering Highway Transportation Innovations
 |
| This report is an archived publication and may contain dated technical, contact, and link information |
|
Publication Number: FHWA-HRT-04-111 Date: February 2005 |
Previous | Table of Contents | Next
The procedure followed for data analyses in all cases involved (a) generating relevant DSR data, (b) calculating the separation ratio, degradation ratio, separation rate, and degradation rate, and (c) determining whether the criterion for the ratio to be within 0.8 and 1.2 was met to assess the stability of the binder. The data used in the calculations and the values of the Rs, Rd, Ksi, Kdi are tabulated in appendices A, B, and C.
The ability of the commercial unit to maintain a uniform temperature was evaluated. A sample of asphalt was placed in the detachable flask and heated using the side and bottom heating mantles. Figure 3 shows a plot of temperature as a function of time. Within 20 minutes, the set temperature was reached. Although a slight (±5 °C) temperature fluctuation exists over the next hour, this was found to be of little consequence. To evaluate the effect of agitation, stirring at 365 rpm was initiated at the 3-hour mark. There is an initial drop in temperature, and thermal equilibrium is reestablished within 40 minutes.
Evaluation of Temperature Stability of Equipment 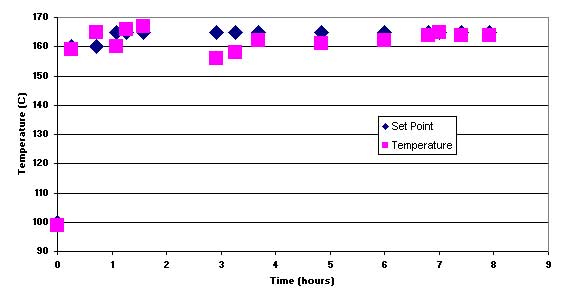 |
| Figure 3. Plot temperature versus time showing the temperature control efficacy of the heating mantles used in the commercial unit of the LAST device. |
To assess the effectiveness of the sampling methodology, the EVA-grafted asphalt binder was chosen to represent a heterogeneous material. Based on the CTS test, EVA-grafted asphalt binder exhibited a tendency to phase separate. Twelve aliquots of the EVA-grafted asphalt binder were withdrawn from vessel after 6 hours of heating without stirring; six were taken from the top and six from the bottom. Rheological data on these were determined on the DSR over the course of the following 2 days. Figure 4 shows a plot of six pairs of G* values obtained at 73 °C. Samples obtained from the top exhibited slightly higher values than those taken from the bottom of the vessel. There is no evidence of steric hardening in these particular samples, because the data is fairly consistent, and no trend of stiffening with time is present. The high variability of sample 1 indicated that replicate samples are advised.
 |
| Figure 4. Reproductivity of the G* value for six different samples of EVA grafted (B6232) with glass pipette |
The eight polymer-modified binders were tested for their thermal stability in the LAST device under two conditions: (a) without mechanical agitation and (b) with mechanical agitation. Samples were withdrawn from the top and the bottom at time intervals of 0 hr, 6 hr, 24 hr, 31 hr, and 48 hr. In each case, two replicates were drawn, and in some cases, the entire run was duplicated to verify any observed discrepancies. The rheological properties were determined on the DSR. The separation ratios, degradation ratios, separation rates, and degradation rates then were calculated. The calculated values for the separation ratios and degradation ratios are provided in appendix A for the averaged data and in appendix B for the data on the replicates. Data deviating significantly from the average are highlighted. The calculated values for the separation rates and degradation rates are provided in appendix C.
The results from the runs with mechanical agitation are given in table 3. It can be seen that mechanical agitation prevents separation, although it can degrade certain binders if this agitation continues for a long time. This is evident from the results shown in table 3; four of the eight binders studied failed the degradation test after 48 hrs of agitation.
Table 3. Time to failure in separation ratio Rs and
degradation ratio Rd for the modified binders used in the study.
| Binder | Rs | Rd |
|---|---|---|
Elvaloy (B6228) |
– | – |
SBS linear-grafted (B6229) |
– | 48hr |
SBS linear (B6230) |
– | – |
SBS radial (B6231) |
– | 48hr |
EVA (B6232) |
– | 48hr |
EVA grafted (B6233) |
– | – |
ESI (B6243) |
– | – |
CMCRA (B6251) |
– | 48hr |
The eight polymer-modified binders were tested for their thermal stability using the CTS test. The rheological properties were determined on the DSR for the top and bottom portion after running the CTS test. Major differences were observed in the G* values between the top and the bottom, while the changes in the d values between the top and the bottom were marginal, as is seen in table 4.
Table 4. Resuls of the CTS text for the modified binders*
| TOP G* | TOP  |
BOTTOM G* | BOTTOM |
Cigar tube 5% Pass Separation | HB Calculation (0.8-1.2 Pass) R, G* | Rs () |
|
|---|---|---|---|---|---|---|---|
| Elvaloy (B6228) | 776.46 |
76.47 |
811.36 |
76.629 |
2.25 |
0.96 |
1.00 |
| SBS-lg (B6229) | 1751.7 |
76.255 |
1780.4 |
76.79 |
0.82 |
0.98 |
0.99 |
| SBS-l (B6230) | 1325.1 |
78.252 |
1695.2 |
78.027 |
13.96 |
0.78 |
1.00 |
| SBS-rg (B6231) | 1593.7 |
76.614 |
1593 |
79.075 |
0.02 |
1.00 |
0.97 |
| EVA (B6232) | 602.71 |
84.086 |
2927.5 |
82.11 |
192.86 |
0.21 |
1.02 |
| EVA-g (B6233) | 859.67 |
84.085 |
3920.5 |
81.599 |
178.02 |
0.22 |
1.03 |
| ESI (B6243) | 1209.8 |
73.935 |
1210.3 |
87.583 |
0.02 |
1.00 |
0.84 |
| CMRA (B6251) | 2032.4 |
78.12 |
1787.2 |
78.572 |
6.03 |
1.14 |
0.99 |
Because the CTS test was done under static conditions, the separation results from the CTS test were compared with the separation results obtained from the LAST device without any mechanical agitation. These are shown in table 5. Comparing the CTS test results with the separation results from LAST showed an excellent relationship with a correlation coefficient R2  0.9.
0.9.
Table 5. Results of the LAST device without a agitation for the modified binders *
| TOPG* | TOP |
BOTTOM G* |
BOTTOM |
Cigar Tube Separation | HB Calculation Rs G* | Rs() |
|
|---|---|---|---|---|---|---|---|
| Elvaloy (B6228) | 1014 |
68.4 |
1018 |
68.3 |
0.87 |
1.00 |
1.00 |
| SBS-lg (B6229) | 991 |
81.1 |
971 |
81.5 |
1.05 |
1.02 |
1.00 |
| SBS-rg (B6231) | 1452 |
77.2 |
1329 |
78.1 |
4.24 |
1.09 |
0.99 |
| EVA (B6232) | 1238 |
83.8 |
2175 |
82.5 |
37.82 |
0.57 |
1.11 |
| EVA-g (B6233) | 861 |
87.4 |
1237 |
84.6 |
21.81 |
0.70 |
1.03 |
| ESI (B6243) | 1078 |
76.0 |
1095 |
76 |
0.76 |
0.99 |
1.00 |
| CMCRA (B6251) | 906 |
83.1 |
950 |
81.6 |
1.88 |
0.95 |
1.02 |
| *24 hr/76° C/ without mechanial agitation/ frequency=10 radians/s | |||||||

