U.S. Department of Transportation
Federal Highway Administration
1200 New Jersey Avenue, SE
Washington, DC 20590
202-366-4000
Federal Highway Administration Research and Technology
Coordinating, Developing, and Delivering Highway Transportation Innovations
| REPORT |
| This report is an archived publication and may contain dated technical, contact, and link information |
|
| Publication Number: FHWA-HRT-11-058 Date: December 2011 |
Publication Number: FHWA-HRT-11-058 Date: December 2011 |
This section describes and discusses the results of the testing conducted.
The unpublished phase I study entitled Testing to Support Low-Temperature Performance Properties of Hot Mix Asphalt Containing Reclaimed Asphalt Pavement (RAP) was conducted in 2006 and 2007. The test results from phase I are included in this report with the results from phase II, when applicable, for completeness. However, a brief summary of the phase I results is provided in this section. The full results from phase I are available in a paper presented at the Transportation Research Board.(1)
One contractor in Indiana produced six different mixtures using two different binder grades and up to 40 percent RAP, as shown in table 1, on two consecutive days in May 2006. The RAP was screened into coarse and fine fractions on a 0.5 1/2-inch (12.5-mm) screen, with only the fine fraction added to the new mixture. Samples were taken of each plant-produced mix and tested for low-, intermediate-, and high-temperature properties. The mixture tests included the following:
AMENDED 1/11/2012
In addition, samples of the RAP and the virgin binders were obtained. The binders were recovered from the RAP sample and the plant-produced mixtures using a solvent recovery process and were tested in the DSR to determine the binder complex shear modulus (|G*|b).(24)
The high-temperature mixture testing showed that both |G*|m and |E*| increased as the RAP content increased. The increase was not statistically significant at 15 percent RAP, but |E*| increased by approximately 100 percent at 100 and 129.9 130 °F (37.8 and 54.4 54 °C) when 40 percent RAP was added to the mix. At 68 70 °F (20 °C), |E*| of the 40 percent RAP mix was only about 12 percent higher than the control. Changing the virgin binder grade to PG58-28 at the higher RAP content lowered |G*|m and |E*|.
AMENDED 1/11/2012
Low-temperature testing in the IDT tester showed that, in general, as the RAP content increased, the stiffness and strength of the mixes also increased, but the differences were not statistically significant. Tcrit became less negative as the RAP content increased, indicating that the mixes with higher RAP content had lower thermal cracking resistance than the control or 15 percent RAP mix. The 25 percent RAP mix with PG64-22 had a Tcrit only 37.4 5.4 °F (3 °C) warmer than the control mix. With the addition of 40 percent RAP and the same binder grade, Tcrit was approximately one binder grade (42.8 10.8 °F (6 °C)) warmer than the control. Lowering the virgin binder grade to PG58-28 was beneficial in improving Tcrit , but the improvement was only about 35.6 3.6 °F (2 °C) compared to mixes with the same RAP content but with PG64-22.
AMENDED 1/11/2012
Binder tests were also performed to look at the extent of blending of the RAP and virgin binders. The binders from the RAP and from the plant-produced mixtures were extracted and tested in the DSR. The virgin binder was also tested. This testing showed that the amount of RAP in the mix had a small effect on the stiffness of the binder. The stiffness of the binder recovered from the plant-produced mixes was slightly higher than the stiffness of the virgin binder itself, but the stiffening did not occur as rapidly as expected. The recovered RAP binder was much stiffer than either the virgin binder or the binder from the mixtures with RAP. The binders recovered from the mixes with PG64-22 were somewhat stiffer than the mixes with PG58-28 at the same RAP content, as expected.
While the phase I results indicated that the addition of RAP increased the mix and recovered binder stiffnesses, which could improve the rutting resistance of the mix but decrease the cracking resistance, the stiffness did not increase as quickly as expected. The results of phase I highlighted some challenges in using high amounts of RAP, as well as the uncertainty of what occurs between the RAP and virgin binders during plant production (i.e., the extent of blending). In phase II, the study was expanded to more HMA plants to substantiate or refute the findings of phase I. The remainder of this report summarizes the results of phase II (combined with the phase I results where applicable).
The mixture volumetrics measured in the NCSC lab on plant-produced lab-compacted specimens are shown in table 3 through table 5
table 6. Mix volumetrics and compacted gyratory samples were not requested of the phase I contractor. In addition, one phase II contractor did not submit samples. The Gmb and asphalt contents that were used in calculating the volumetrics were provided by the contractors. The asphalt contents were verified by reflux extraction of plant-produced mixtures in the NCSC lab.
AMENDED 1/11/2012
Volumetric requirements for these mixes included AV (4.0 percent), VMA (15.0 percent for 0.37 3/8-inch (9.5-mm) mixes), and VFA (no more than 80 percent or less depending on traffic level, which was not defined for this experiment). Note that gradation is not a quality parameter in Indiana and was not determined in the NCSC lab. For each mix, one truck sample was taken to collect all the mix needed for testing at NCSC, so it was essentially one sample. Some mixes did not meet the design volumetric requirements, as shown in the tables above. General QC limits for multiple tests would be ±0.3 percent asphalt binder and ±1.0 percent AV. However, for single tests, these ranges would more typically be ±0.5 percent asphalt binder and ±1.5 percent AV.
AMENDED 1/11/2012
In general, AV tended to be lower as the percent RAP increased. A review of the volumetric data also shows that VMA decreased as RAP content increased. To further investigate the cause of the low AV, samples of the plant-produced mixes from contractors 2 through 5 were extracted using the reflux extraction. This was done for speed and because the binders were not going to be recovered and tested. These data are summarized in table 7. The binder contents were all found to be within 0.3 percent with four exceptions. For contractor 2, mix B had a binder content that was 0.4 percent lower than the design, and mix F was 0.6 percent higher. For contractor 3, mix B was 0.4 percent higher. For contractor 4, mix D was 0.4 percent higher. For the other mixes, the difference from the design binder content ranged from -0.3 to 0.3 percent, with most binder contents within 0.2 percent of the design.
Contractors 2, 3, and 5 performed routine QC test results, although this was not required because of the relatively small quantities of mix produced and the rapid change from one mix to the next. These data, which are included in appendix A of this report, were examined in light of the low AV contents measured on some of the mixes in the NCSC lab. The data from all three contractors reflected higher Gmm values than measured in the NCSC lab. This, in turn, yielded higher AV contents. The contractors used the dry back method to determine when the sample was dry, whereas the NCSC lab did not. The dry back method is an optional supplementary procedure in AASHTO T 209 that can be used to correct for absorbed water during the Gmm determination.(13) Also, the NSCS lab had to reheat the samples, while the contractors did not. These reasons and normal testing variability likely explain the differences that were observed.
There was generally better correlation between the Gmb values reported by NCSC and the contractors, with most results comparing within the a range of 0.017.(14) The comparison of results was better with contractor 5 than contractor 2 for unknown reasons. Contractor 5’s results were always lower than NCSC but only by 0.007 or less. Contractor 2’s results were lower by 0.015–0.030, except in the case of mix C, where the results were higher by 0.015.
These differences in the measured volumetric properties, especially in the Gmm values, explain the observed differences in AV and VMA as measured by the contractors and the NCSC lab. The AV content and VMA were higher for contractor 2, except for mix C, which resulted in lower VFA. AV was higher and VMA was similar for contractor 5. The contractors’ data showed a general trend of VMA decreasing with increasing RAP content, similar to that observed in the NCSC data.
In the case of contractor 3, since gyratory specimens compacted at the plant lab during construction were not provided, the corresponding volumetric data from the NCSC lab is not available except for Gmm data. The Gmm data were generally higher than for the NCSC lab, as was also observed with contractors 2, 3, and 5. Contractor 3’s QC results showed AV ranging between 2.4 and 6.8 percent, which was fairly similar to the ranges observed with the other contractors. The lowest AV content was observed for the 40 percent RAP mix with PG58-28, and the highest was observed for the control mix.
QC data from the contractors were also examined to look at the variation in gradations between mixes. Contractor 2 provided individual mix designs for each of the six mixes. The mix design gradations compared within 3 percent on each sieve size. The QC data for each mix were compared to the mix design for that mix. The measured percentage passing individual sieves ranged from 1.6 percent, which was less than the design, to 3.2 percent greater than the design. The biggest variance from the design occurred at the 0.18 No. 4- and 0.09-inch No. 8 (4.75- and 2.36-mm) sieve sizes.
AMENDED 1/11/2012
Contractor 3 did not provide the actual mix design values but indicated that the aggregate gradations were designed to closely agree. The binder content was varied to produce 4 percent AV. Contractor 3’s QC data showed that the six mixes had gradations that compared within a range of 2 percent on the 0.003-inch (0.075-mm) No. 200 sieve to 7.3 percent on the 0.18-inch (4.75-mm) No. 4 sieve. This seems to be a reasonable level of variation considering the small quantities of mix produced, which did not allow much time for dialing in the plant.
AMENDED 1/11/2012
The QC data for contractor 5 also showed reasonable variation for small quantities of mix. Four mix designs were provided. The 25 and 40 percent RAP mixes had the same design regardless of binder grade. A comparison of the QC data to the mix designs shows that the greatest variation from the design gradation occurred on the 0.18-inch (4.75-mm) No. 4 sieve, where the actual gradation was as much as 9.7 percent finer than the design. The gradations on other sieves compared within 1 percent coarser to 5 percent finer than the design.
AMENDED 1/11/2012
The binder contents measured by the contractors agreed with the mix designs within 0.3 percent. As noted in the discussion of table 7, the NCSC data showed similar results except in a few cases. All of the data suggest that the mixes were not over asphalted.
The NCSC data and the contractors’ QC data showed that there was a general trend of decreasing VMA with increasing RAP content, which is partly caused by low AV. Excess asphalt binder is not the main cause of the low AV. This is significant in that asphalt binder properties and asphalt binder content more strongly control cracking behavior than do the aggregate properties. During analysis of the low-temperature cracking predictions, consideration will be given to mixtures with asphalt contents that differ markedly from the design.
For the mixture tests in this study, the specimens were compacted to 7 ±1 percent AV by varying the gyration level. Generally, there is a relationship between the number of gyrations required to reach 7 percent AV and AV at the design number of gyrations. Figure 1 shows the data from the mixes in this study. Mixtures with lower AV require fewer gyrations to achieve 7 percent AV.

Figure 1. Graph. Number of gyrations to achieve 7 percent AV.
The cause of low AV in some of the mixtures is related to the aggregate skeleton (low VMA). High-temperature properties would be influenced more by a low number of gyrations to achieve 7 percent AV. This should be especially true for rut testing results. For |E*|, the effect should be less so. Consider the |E*| data shown in figure 2. At low frequencyies frequencies where the asphalt binder properties were less dominant, the mixture stiffness was about 43,511.31 43,500 to 58,015.08 58,000 psi (300 to 400 MPa). At higher frequencies where the asphalt binder properties were more dominant, the stiffness is about 2,900,754 2,900 to 4,351,131 psi 4,350 ksi (20,000 to 30,000 MPa), which is an increase of 70 times. Most of this increase is related to the binder properties.
AMENDED 1/11/2012
In summary, because asphalt content is generally within a normal target value, the low-temperature and fatigue results of the study should not be unduly affected by mixtures with low AV. |E*| data should also be relatively unaffected by low design AV.

Figure 2. Graph. Example master curves.
The results of testing the virgin and recovered RAP and mix binders from each phase II contractor are shown in table 8 through table 11. Note that this testing was not performed in phase I; only DSR master curves were developed. The right-hand column summarizes the results from the analysis of the binder direct tension data and the BBR using the Thermal Stress Analysis Routine (TSAR™) software to determine Tcrit. The results of testing the binders recovered from the mixtures in phase II are shown in figure 3 and figure 4. More graphs that show the results of testing the recovered binders are included in appendix B of this report.

Figure 3. Graph. Comparison of high critical temperatures (Tc, DSR) for binders recovered from plant mixtures.

Figure 4. Graph. Comparison of low critical temperatures (Tc, BBR) for binders recovered from plant-produced mixtures (based on BBR m-value = 0.300).
From these tables and figures, it can be observed that the virgin binders all met the specified grade. Most of the virgin binders had a “cushion” of a few degrees exceeding the required critical temperature by 35.6 or 37.4 3.6 or 5.4 °F (2 or 3 °C) (e.g., the true grade of a nominal PG64-22 was PG66-24). Occasionally, this factor of safety was as much as 39.2 7.2 °F (4 °C). Meeting the low temperature grade with the PG58-28 binder appeared to be somewhat more challenging for the binder supplier than meeting the PG64-22 binder. The cushion on the low-temperature grade was less than 33.8 1.8 °F (1 °C) for two of the virgin binders. The low-temperature grades predicted by BBR alone and by the TSAR™ analysis were similar. True grades (continuous grades) may be more meaningful when analyzing test results than simply the standard PG grades. The greater cushion on the PG64-22 properties may have helped improve the test results of the mixes with that binder grade compared to the mixes with PG58-28, which had little or no cushion. That is, the greater cushion on the PG64-22 grade binder could help lessen the stiffening effect of higher RAP contents to a greater extent than the PG58-28 grade could accommodate.
AMENDED 1/11/2012
Extracting and recovering the binder from the mixes forces blending of the virgin and RAP binders if they have not already blended in the mix. Therefore, it would be expected that as the percentage of RAP in the mix increases (moving from mix A with no RAP to mix D with 40 percent RAP), the high- and low-temperature grades would be expected to increase (i.e., the low-temperature grade would be expected to become less negative).
A comparison of the binder recovered from mix A with the virgin PG64-22 (see table 8 through table 11) shows that the plant processing (and possibly the process of extraction and recovery) increased the high-temperature grade of the binder by 41 to 44.6 9 to 12.6 °F (5 to 7 °C). The low temperature grade also increased by 35.6 to 39.2 3.6 to 7.2 °F (2 to 4 °C). This result is not necessarily surprising. Previous research by Galal and White showed that binders recovered from plant produced mixes in Indiana were stiffer than the RTFO tests on virgin binder would suggest they would be.(26) While that is only one study, it was conducted in the same State and included some of the same plants involved in the current study.
AMENDED 1/11/2012
During phase I of the current study, the RTFO-aged virgin PG64-22 was found to be stiffer than the binder recovered from the plant-produced control mix that contained the same binder and no RAP. The binder was recovered using the Abson recovery procedure with mCl solvent.(24) That difference in the extraction/recovery procedure was the impetus for the extraction/recovery comparison conducted in phase II, which is discussed later in this report.
When comparing the mixes made with PG64-22 and differing RAP contents (mixes A–D), a slight increase in the high- and low-temperature grades can generally be observed, but the change is fairly minimal (33.8 to 35.6
1.8 to 3.6 °F (1 to 2 °C)) (see figure 3 and figure 4). In the case of contractor 3, no consistent pattern in the results was observed, but the results were from mixes where some buckets had water in them. The presence of water could possibly have affected the results.
AMENDED 1/11/2012
When the mixes with PG58-28 (mixes E and F) were compared to the mixes with PG64-22 at the same RAP content (mixes C and D, respectively), the use of the softer binder typically decreased the high- and low-temperature grades by half a grade or more. The exception was contractor 3, where the high-temperature grade increased by 33.8 to 35.6
1.8 to 3.6 °F (1 to 2 °C) when the virgin binder grade decreased. The low-temperature grade for contractor 3’s mixes either stayed the same (for 25 the 25 percent RAP mixes) or decreased by 39.2
7.2 °F (4 °C) (for the 40 percent RAP mixes) when the softer binder was used.
AMENDED 1/11/2012
These data suggest that if total, or nearly total, blending of the RAP and virgin binders occurred in these mixes, the effect on the low-temperature properties of the blended binder would not be extreme. Increasing the RAP content from zero to 25 percent without changing the binder grade resulted in no more than a 35.6 3.6 °F (2 °C) increase in the low true temperature grade (excluding the results of mix 3). Increasing the RAP content to 40 percent with no binder grade change also increased the low-temperature grade no more than 35.6 3.6 °F (2 °C). The mixes with PG58-28 exhibited recovered low-temperature binder properties that were typically 35.6 to 37.4 3.6 to 5.4 °F (2 to 3 °C) lower (more negative) than the corresponding mixes with PG64-22 and similarly better than the control mix with no RAP.
AMENDED 1/11/2012
Mixture testing is necessary to determine if the mixtures behave as if total, or nearly total, binder blending has occurred. The mixture test results are presented next.
At least four replicates of each mix (at each RAP content and binder grade, including mixes A through E) were produced and tested for |E*|. The results are summarized in figure 5 through figure 19. Statistical analysis of the |E*| data is provided in the next section.
The figures illustrate the change in stiffness (|E*|) of the mixes versus changes in the loading frequency on a log-log scale. Because frequency of loading and temperature are inversely related for asphalt materials, the figures reflect the behavior at different temperatures. High moduli occurred at high frequencies or low temperatures and are represented on the right side of the graphs. Low moduli occurred at high temperatures or low frequencies and are shown on the y-axis. At intermediate temperatures or loading frequencies, the mix moduli would also be intermediate.
For each set of mixtures (from one contractor), there are three graphs. The first graph compares the four mixes produced with PG64-22. It compares the control mix with no RAP to the three mixes with increasing RAP content (15, 25, and 40 percent) with the same binder grade. The second graph compares the control mix to the two mixes with PG58-28, which contain 25 and 40 percent RAP. The third graph compares the mixes with 25 and 40 percent RAP but with different PGs.
For contractor 1, adding 15 percent RAP (mix B) increased the stiffness compared to control mix A (see figure 5). The mix with 25 percent RAP was much stiffer, especially at intermediate and high temperatures, and the 40 percent RAP mix was also slightly stiffer. As a result, this mix behaved as expected.

Figure 5. Graph. Mix modulus of PG64-22 mixes from contractor 1.
1psi = 0.0069 MPa
Figure 6 compares the control mix to the PG58-28 mixes from contractor 1. Changing the binder grade helped make the higher RAP content mixes more comparable to the control mix. They were more similar to the control than mixes C and D in 1psi = 0.0069 mpa figure 5. In this case, the control mix was not as stiff as the RAP mixes at high temperatures (low frequencies) and was comparable at low temperatures (high frequencies).

Figure 6. Graph. Mix modulus of control and PG58-28 mixes from contractor 1.
1psi = 0.0069 MPa
Figure 7 shows that changing the virgin binder grade in mixes with 25 and 40 percent RAP impacted the mix stiffness. There was a greater decrease in stiffness for the 40 percent RAP mixes than for the 25 percent RAP mixes. The two mixes with PG58-28 had similar stiffness.
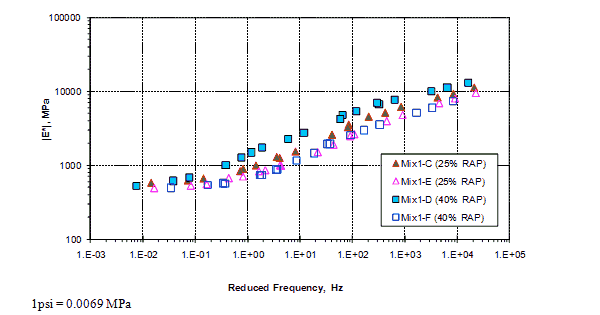
Figure 7. Graph. Comparison of mix moduli of PG64-22 and PG58-28 from contractor 1.
1psi = 0.0069 MPa
Figure 8 shows the mixes from contractor 2 with PG64-22. There was little change in stiffness of the mixes with zero, 15, and 25 percent RAP. The 40 percent RAP mix was the stiffest mix, especially at intermediate and higher temperatures.

Figure 8. Graph. Mix modulus of PG64-22 mixes from contractor 2.
The comparison of the control mix to the mixes with PG58-28 from contractor 2 in 1psi = 0.0069 mpa
figure 9 shows that the control and 40 percent RAP mixes were generally comparable. The control mix was somewhat stiffer than the PG58-28 mixes at low temperatures. The 25 percent RAP mix was less stiff than the control and 40 percent RAP mixes, especially at high and intermediate temperatures.
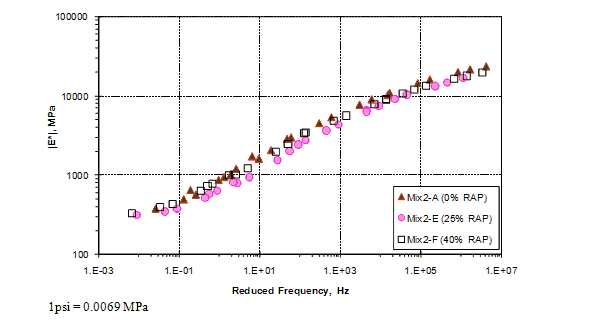
Figure 9. Graph. Mix modulus of control and PG58-28 mixes from contractor 2.
Figure 10 shows that the use of a softer binder grade softened the mix. The effect was especially pronounced for the 40 percent RAP mix. The 40 percent RAP mix contained more hardened RAP binder that could blend with, and be softened by, the virgin binder. The mix with 40 percent RAP and PG58-28 was generally stiffer than either mix with 25 percent RAP; however, those three mixes were similar at low temperatures (and were all softer than the 40 percent RAP mix with PG64-22).

Figure 10. Graph. Comparison of mix moduli of PG64-22 and PG58-28 from contractor 2.
For contractor 3, mixes A, C, and E had visible water in the buckets when opened in the laboratory. The effects of the water on the test results are unknown. Given that, the results in 1psi = 0.0069 mpa
figure 11 indicate that the mix with 15 percent RAP was the least stiff mix. The 25 percent RAP mix with PG64-22 was stiffer than the control, and the mix with 40 percent RAP and PG64-22 was similar to the 15 percent RAP mix at high temperatures and somewhat stiffer at intermediate and low temperatures.

Figure 11. Graph. Mix modulus of PG64-22 mixes from contractor 3.
1psi = 0.0069 MPa
Figure 12 indicates that the mix with 25 percent RAP and PG58-28 from contractor 3 was slightly stiffer than the control at intermediate temperatures and similar at low and high temperatures. The 40 percent RAP mix with PG58-28 was similar to the control at all temperatures. However, mixes A and E had visible water, so these results are questionable.

Figure 12. Graph. Mix modulus of control and PG58-28 mixes from contractor 3.
1psi = 0.0069 MPa
Figure 13 shows that a softer virgin binder grade decreased the mix stiffness slightly at 25 percent RAP. For the 40 percent RAP mixes, the mix with PG58-28 (mix F) demonstrated higher stiffness than the mix with PG64-22 (mix D), which was contrary to expectations.

Figure 13. Graph. Comparison of mix moduli of PG64-22 and PG58-28 from contractor 3.
In the case of contractor 4’s mixes in 1psi = 0.0069 mpa
figure 14, the 15 percent RAP mix was not as stiff as the control. However, the 25 percent RAP mix was similar to the control, and the 40 percent RAP mix was stiffer. At low temperatures, the 40 percent RAP mix could be more susceptible to thermal cracking than the control or the lower RAP content mixes.

Figure 14. Graph. Mix modulus of PG64-22 mixes from contractor 4.
1psi = 0.0069 MPa
Figure 15 shows that the mix with 25 percent RAP and PG58-28 was not as stiff as the control mix. The mix with 40 percent RAP was also not as stiff as the control at low and high temperatures, but it was much stiffer than the 25 percent RAP mix.

Figure 15. Graph. Mix modulus of control and PG58-28 mixes from contractor 4.
1psi = 0.0069 MPa
Figure 16 compares the 25 and 40 percent RAP mixes with different binder grades. The effect of the softer binder grade is visible for both RAP contents.

Figure 16. Graph. Comparison of mix moduli of PG64-22 and PG58-28 from contractor 4.
In the case of the results for contractor 5 in figure 17, all of the mixes with PG64-22 were similar in stiffness at low temperatures. As the RAP content increased, the stiffness at low temperatures (high frequencies) decreased slightly, which may have been an effect of the mix volumetrics (see table 6). As the RAP content increased, AV decreased. While all |E*| test specimens were compacted to 7 ±0.5 percent AV, the difference in AV at a standard compaction level (50 or 75 gyrations) suggests weakening of the mix structure. At high temperatures, the stiffness increased slightly as the RAP content increased.

Figure 17. Graph. Mix modulus of PG64-22 mixes from contractor 5.
1psi = 0.0069 MPa
Figure 18 shows a comparison of the control mix to the mixes with PG58-28 from contractor 5. The mix with 25 percent RAP was not as stiff as the control, but that the mix with 40 percent RAP was similar to the control.

Figure 18. Graph. Mix modulus of control and PG58-28 mixes from contractor 5.
In 1psi = 0.0069 mpa
figure 19, the effect of the softer binder grade is apparent in the mixes with 25 percent RAP and less obvious for the 40 percent RAP. However, even at 40 percent RAP, the mix with PG58-28 had a slightly lower |E*| than the comparable mix with PG64-22.

Figure 19. Graph. Comparison of mix moduli of PG64-22 and PG58-28 from contractor 5.
In order to quantify the differences between the mixes, the |E*|values at 25 Hz were analyzed statistically to see if the differences were significant. Analysis of variance (ANOVA) was performed to determine if significant differences were observed between the four mixes with PG64-22 binder and between the two mixes with PG58-28 at different test temperatures. If the ANOVA indicated significant differences, a Bonferroni comparison of means test was conducted to determine which mixes were significantly different from the others. The comparison of means test categorizes results that are not significantly different together in the same group.
A summary of the results is shown in table 11 through table 14 table 12 through table 15. The analysis was not performed on the results from contractor 3 because of the unknown effect of the water in the samples. In the tables, the null hypothesis was that the means of the mixes with the same virgin binder grade were not significantly different (e.g., the moduli of mixes A through D were not different). A p-value less than the significance level of 0.05 indicated that there was a significant difference. If the p-value was less than 0.05, the comparison of means test was run to group the data. The results of this test are shown in the column labeled “Inference,” where the mixes that were not significantly different were grouped together. For example, contractor 1’s mixes at 68 70 °F (20 °C) fell into two groups: mixes A, C, and D and mixes A, B, and C. Mixes A, C, and D were not significantly different from each other, and mixes A, B, and C were not significantly different from each other. Because these groups overlapped so much, no clear distinction could be made. However, at higher temperatures, mix D was significantly different from mixes A, B, and C. Also for contractor 1, mixes E and F were significantly different from each other at 39.2 and 129.9 130 °F (4 and 54.4 54 °C), but they were marginally not significantly different at 100 °F (37.8 °C) (although the p-value was only slightly greater than 0.05).
AMENDED 1/11/2012
Review of the data from the other contractors shows that, in most cases, the mixes with the PG64-22 did not have significantly different moduli. If there was a significant difference, mix D with 40 percent RAP was different from the others. There are several instances where the mixes with PG58-28 were significantly different; this increase in significance may have been due in part to the fact that only two mixes were being compared.
The binder and mixture testing results were used together following Bonaquist’s approach for estimating binder blending in the mix.(10,11) The recovered binder test results and mixture volumetrics were used with the Hirsch model to estimate what the mix modulus would be if the RAP and virgin binders were completely blended.(12) The extraction and recovery process served to fully blend the binders. This estimation was then compared to the measured mix moduli over a range of temperatures through the mix master curve. Substantial overlap of the estimated and measured master curves indicates thorough blending. If there is overlap in the curves, the binder in the mix is acting as if it is a thorough blend of the RAP and virgin binders. If the two curves do not overlap, the binder is not acting like a total blend of the virgin and RAP binders. An example of good mixing is showed in figure 20, which shows the results for mix B (15 percent RAP) for contractor 5. An example of poorer blending is shown in figure 21 for mix D (40 percent RAP) for contractor 4.
All of the results for all six mixes from each of the phase II contractors are shown in appendix C. A general description of the results follows.

Figure 20. Graph. Example of thorough blending (mix 5B).

Figure 21. Graph. Example of poor blending (mix 4D).
At the time this testing was completed, the research team used the standard test temperatures and frequencies. The team has since learned that Dr. Bonaquist does not recommend testing at the highest temperature used here (129.9 °F (54.4 °C) 130 °F (54 °C)) because of possible machine compliance issues. Some of the graphs in appendix C (figure 63, figure 68, figure 74, figure 75, and figure 77) show a slight upward curve in the measured modulus master curve at this high temperature, probably caused by machine compliance issues. Also, it would have been preferable to run the binder tests at different frequencies to ensure a greater overlap of the estimated and measured test frequencies. Future testing in this lab will follow these recommendations.
With those limitations, information still needs to be gathered from this analysis. In general, the mixes from contractor 2 showed substantial blending of the old and new binders, with the exception of the 40 percent RAP mixes, especially with PG64-22. Good blending was also observed for five of the mixes and partial blending for the 15 percent RAP mix from contractor 3; however, the impact of water in the samples is unknown. The comparison of estimated and measured moduli for contractor 4 was not as good, possibly indicating less blending of the RAP and virgin binders. The results for contractor 5 also indicated that substantial blending occurred in these mixes. In total, three out of four sets of data exhibited fair to good blending between the RAP binder and the virgin binder, and the fourth set is not as good at the higher RAP contents. Out of 24 mixes, three exhibited poor blending, one exhibited partial blending, and 20 exhibited good blending.
All of the mixes produced by the five contractors were tested at low temperatures in the indirect tension test.(22) In that test, the mixture’s creep compliance (stiffness) and strength were evaluated. These values were used to estimate Tcrit of the mixes. Neither stiffness nor strength alone can be used to determine when a mixture will crack. A stiff material will not crack if its strength is great enough, and a weaker material will not crack if it is not too stiff. A spreadsheet developed by Don Christensen called LTStress was used to calculate Tcrit based on estimating when the tensile stresses that build up in a pavement (calculated based on the mixture stiffness) exceed the tensile strength of the mix.(27)
Three individual specimens of each mix were tested for creep stiffness at -4, 14, and 32 °F (-20, -10, and 0 °C). Following creep testing, strength testing was conducted on one of these specimens at each of the temperatures. The data were then input into LTStress for analysis.
The data for each contractor are reflected in two graphs each (see figure 22 through figure 31). The first graph in each pair shows the stiffness of the six mixes and the estimated pavement cracking temperature. The second graph shows the mix strength and the same estimated pavement cracking temperature. The data are also tabulated in table 15 through table 19 table 16 through table 20.
AMENDED 1/11/2012
LTStress uses a Gauss-Newton nonlinear least squares procedure to estimate the creep compliance master curve. This is an iterative procedure, and sometimes the data do not converge. In that case, there is a break in the line of Tcrit and stiffness data shown below (see mix 4D). In all cases, the AV content of the samples tested were in the range of 7 ±1 percent.
Figure 22 and figure 23 show the results for contractor 1. The results indicate that the stiffness of the 15 percent RAP mix with PG64-22 binder was somewhat higher than the control. The 25 percent RAP mix was similar to the control, while the 40 percent RAP mix was stiffer than the control. The strengths of the PG64-22 mixes followed a similar trend.Tcrit was slightly warmer than the control (35.6 to 39.2 3.6 to 7.2 °F (2 to 4 °C)) for the 15 and 25 percent RAP mixes and 39.2 to 42.8 7.2 to 10.8 °F (4 to 6 °C) warmer for the 40 percent RAP mix. The stiffnesses and strengths of the mixes with PG58-28 were similar to the 15 and 25 percent RAP mixes with PG64-22, as were the cracking temperatures.
AMENDED 1/11/2012

Figure 22. Graph. IDT stiffness and pavement cracking temperature for contractor 1.

Figure 23. Graph. IDT strength and pavement cracking temperature for contractor 1.
The data for contractor 2’s mixes, shown in figure 24 and figure 25, indicate that the addition of 15 percent RAP reduced the mix stiffness and pavement cracking temperature, despite the fact that the 15 percent RAP mix was 0.4 percent low in binder. Additional amounts of RAP, up to 40 percent, caused an increase in the stiffness and cracking temperature. The strength was relatively constant for mixes A through D. Large differences in the mix strength would not be expected since the same binder was used in all four mixes and low-temperature cracking is highly binder dependent.
When the binder grade was changed to PG58-28, the stiffness and pavement cracking temperature decreased. The stiffness of the mix with 25 percent RAP and PG58-28 was comparable to the 15 percent RAP mix with PG64-22. The cracking temperature of mix E was similar to that of the 25 percent RAP mix with the stiffer binder. Surprisingly, mix F, which has 40 percent RAP and PG58-28 binder, was even less stiff and had a lower Tcrit than any of the other mixes. This mix had the highest deviation in the binder content and was 0.6 percent higher than the design. The low cracking temperature of about -40 °F (-40 °C) was due in part to the high strength of that mix in conjunction with the low stiffness and may have been related to the high binder content.
These results correspond fairly well to the |E*| master curve analysis presented earlier in this report. Mix A was consistently stiffer than mixes B and C but was similar to mix D, especially at lower temperatures. Mixes E and F were both less stiff than the control mix.

Figure 24. Graph. IDT stiffness and pavement cracking temperature for contractor 2.

Figure 25. Graph. IDT strength and pavement cracking temperature for contractor 2.
Analysis of the IDT test results for contractor 3 show little change in the estimated pavement cracking temperature for any of the mixes. In terms of stiffness, the control mix was slightly less stiff than mix B, and the addition of more RAP caused an increase in the stiffness of mix C (see figure 26). Mix D had comparable stiffness to mix C. Mix E, with the softer binder, had comparable stiffness to the control mix, and mix F was somewhat stiffer.
The strengths of these mixes were somewhat more variable than some of the other mixes (see figure 27). The 40 percent RAP mixes with the PG58-28 binder tended to have higher strengths than their companion mixes with PG64-22. The 15 percent RAP mix had lower strength than the control mix.
The unknown effects of visible water in mixes A, C, and E from contractor 3 may make these results questionable. In addition, mix B had binder content 0.4 percent higher than design, which did not appear to have had a major impact on these results.

Figure 26. Graph. IDT stiffness and pavement cracking temperature for contractor 3.

Figure 27. Graph. IDT strength and pavement cracking temperature for contractor 3.
The mixes from contractor 4 show an example of a dataset that did not converge (see figure 28 and figure 29). Satisfactory results could not be obtained for mix D. There is no obvious problem with the data itself (i.e., no obvious outlier(s) and a lack of excessive variability in the results), but the data would not converge. Mix D had 0.4 percent higher binder than designed, which should not have affected how the data converged. The overall interpretation of data was not affected since that data point was not considered.
The data that could be analyzed showed a decrease in stiffness from the control to 15 percent RAP followed by an increase (though still less stiffness than the control) for mix C. Mix E had similar stiffness to mixes B and C. Mix F was stiffer than mix E, likely showing the stiffening effect of the RAP. Mix F was still not as stiff as the control, possibly reflecting the influence of the softer binder grade.
The strength data showed a steady increase in the strength as the RAP content increased in the mixes with PG64-22. The mixes with PG58-28 had comparable or higher strengths than their companion mixes, and mix F had greater strength than mix E. There was little change in the pavement cracking temperature for the mixes with the same binder grades.

Figure 28. Graph. IDT stiffness and pavement cracking temperature for contractor 4.

Figure 29. Graph. IDT strength and pavement cracking temperature for contractor 4.
The results for contractor 5 are illustrated in figure 30 and figure 31. The stiffness of these mixes increased from the control to the 15 percent RAP mix and then remained relatively constant when the RAP content increased to 25 percent with the PG64-22 binder. As the RAP content increased to 40 percent, the stiffness decreased. The stiffness of the two mixes with PG58-28 binder were lower than any of the PG64-22 mixes. Mix F was slightly stiffer than mix E, possibly reflecting the influence of the increased RAP content.
The mixes from contractor 5 showed a steady increase in the mix strength with increasing RAP content for a given binder grade. The strength of mix E with 25 percent RAP and the softer binder was similar to that of mix B with a stiffer binder and only 15 percent RAP. Mix F with the softer binder and 40 percent RAP had a slightly lower strength than mix C with 25 percent RAP and the stiffer binder. In this case, the control mix had a more negative Tcrit than any of the RAP mixes, even compared to the mixes with the softer binder grade.

Figure 30. Graph. IDT stiffness and pavement cracking temperature for contractor 5.

Figure 31. Graph. IDT strength and pavement cracking temperature for contractor 5.
To summarize the low-temperature mixture testing results, the changes in Tcrit for the different contractors and mixes are shown in table 20 table 21. Contractor 2’s data are shown but were not included in calculating the average because the strength was higher than the other results for unknown reasons, and the strength did not change from zero to 40 percent RAP. The addition of RAP, in this case, led to a significant improvement in the low-temperature cracking, which did not seem reasonable. This table shows that, on average, the addition of 15 to 25 percent RAP without altering the binder grade changed Tcrit by about 35.6 3.6 °F (2 °C). The addition of 40 percent RAP without a grade change increased Tcrit by about 39.2 7.2 °F (4 °C). When the virgin binder grade was changed, the addition of 25 percent RAP had virtually no effect on the cracking temperature. Additionally, using 40 percent RAP only changed the cracking temperature by 33.8 1.8 °F (1 °C) compared to the control. This lends support for lowering the binder grade for 40 percent RAP but not lowering the binder grade for 25 percent RAP.
AMENDED 1/11/2012
The AASHTO T 319 extraction and recovery procedure was recommended in NCHRP 9-12 because research showed the method yielded less change in the binder properties before and after extraction/recovery compared to the Abson method.(23,5) AASHTO T 319 uses a rotating extraction vessel with baffles inside to bathe the mix in solvent and remove the binder. The binder is then recovered from the solution through a rotavapor. NCSC uses nPB as the solvent. Few labs in the United States are equipped to run the AASHTO T 319 procedure. However, some labs use the rotavapor for recoveries. Most labs already had the equipment for other extraction and recovery techniques before the AASHTO T 319 procedure was developed, and the impetus to change is not strong.
In phase I of this report, the Abson recovery procedure was used with reagent grade mCl.(24) The recovered binder properties were then determined by NCSC, and master curves were developed. Those master curves showed an increase in the stiffness of the recovered binders as the RAP content increased. The binder recovered from the control mix was not as stiff as the RTFO-aged virgin binder. Binders were also recovered from the control mix and mix C (25 percent RAP with PG64-22) by NCSC using the AASHTO T 319 procedure with nPB. For those two mixes, the binders recovered using AASHTO T 319 were stiffer than those recovered using the Abson recovery procedure.(24)
Blends of binders were also prepared in phase I to simulate total blending in the 25 and 40 percent RAP mixes with PG64-22. The binders recovered from the RAP in the proper proportions with RTFO-aged PG64-22 were blended. NCSC then compared the blended binders to binders recovered from the mixes with the same RAP content and binder. The DSR results from the pairs (blended and actual mix) were similar.
Since phase I utilized a different extraction/recovery procedure and solvent than the NCHRP research, it seemed appropriate to investigate the potential differences in phase II. Therefore, one set of six mixtures was selected (based on having adequate samples for testing). Mix samples were sent for extraction and recovery using the same Abson procedure but using mCl for one set of extractions, as performed in phase I, and using the Abson with nPB for comparison purposes. A companion set was extracted and recovered at NCSC using the AASHTO T 319 procedure with nPB. The recovered binders were returned to NCSC where DSR testing was performed to 52 develop master curves. The master curves in figure 32 through figure 37 reflect a comparison between the binders recovered using mCl and those recovered using nPB. The results were compared to see if there was a consistent relationship between the stiffness of the binders recovered using the different solvents.

Figure 32. Graph. Comparison of binder recovered using different solvents for mix A.

Figure 33. Graph. Comparison of binder recovered using different solvents for mix B.

Figure 34. Graph. Comparison of binder recovered using different solvents for mix C.

Figure 35. Graph. Comparison of binder recovered using different solvents for mix D.
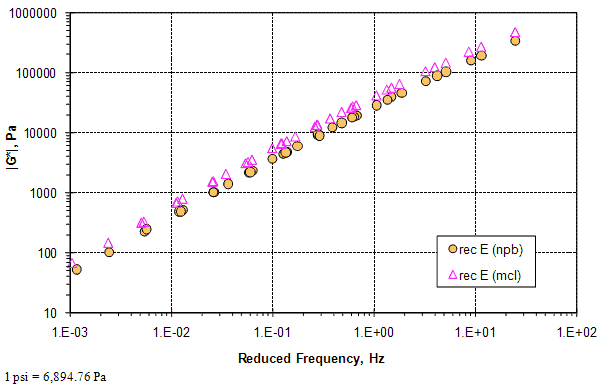
Figure 36. Graph. Comparison of binder recovered using different solvents for mix E.
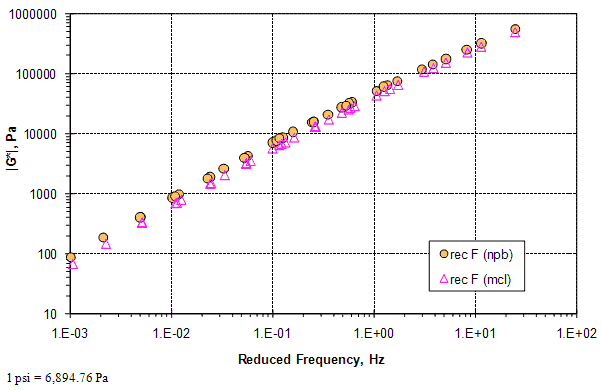
Figure 37. Graph. Comparison of binder recovered using different solvents for mix F.
There does not appear to be a consistent trend in the comparison of the binder properties relative to the solvent used in the Abson procedure.(24) For mixes A, B, and E, the binder extracted/ recovered with the Abson procedure and mCl was stiffer than the binder from the Abson procedure with nPB. For mixes C and D, the binders were virtually the same. For mix F, the binder recovered with nPB was somewhat stiffer than that recovered with mCl. The effect of the solvent does not appear to be related to the virgin binder grade either (e.g., mixes E and F with PG58-28 yielded opposite comparisons).
Figure 38 through figure 43 show a comparison of the binders recovered using nPB and the Abson procedures, as well as the AASHTO T 319 procedure at NCSC. The trends were not consistent, although they appear to be more consistent than the effect of the solvent. The binders recovered by NCSC using the AASHTO T 319 procedure were stiffer than those recovered using the Abson procedure for mixes A, B, E, and F. Mix C yielded the same results regardless of the procedure, and mix D was less stiff using AASHTO T 319 than the Abson procedure. Since the research that led to the AASHTO standards was based on using the AASHTO T 319 method, it is the method preferred by NCSC.
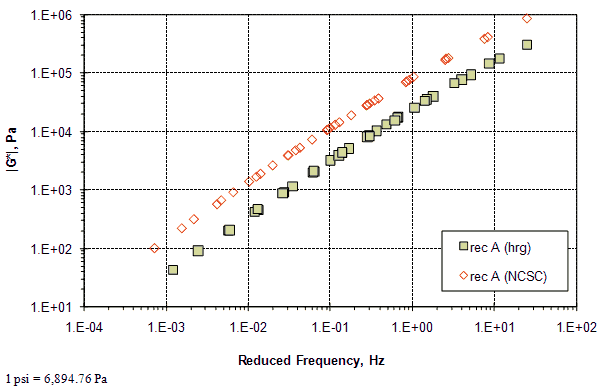
Figure 38. Graph. Comparison of binders recovered using different procedures and same solvent for mix A.
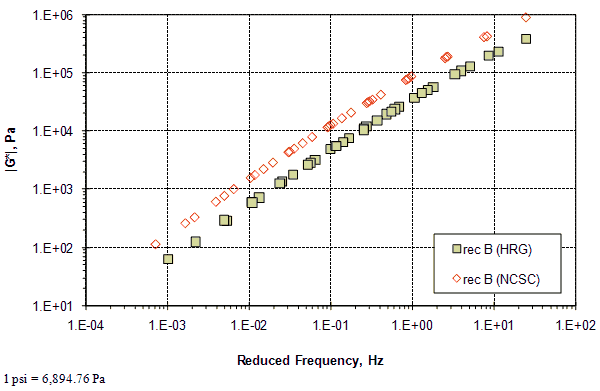
Figure 39. Graph. Comparison of binders recovered using different procedures and same solvent for mix B.
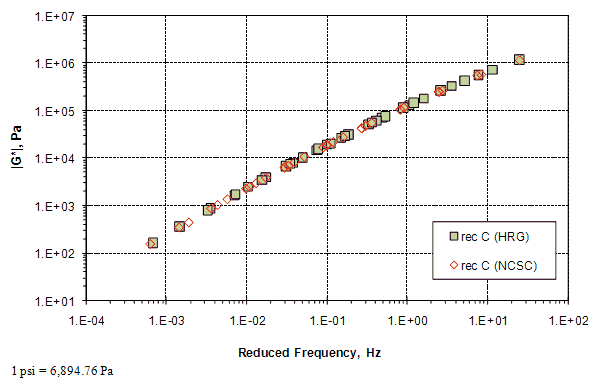
Figure 40. Graph. Comparison of binders recovered using different procedures and same solvent for mix C.

Figure 41. Graph. Comparison of binders recovered using different procedures and same solvent for mix D.
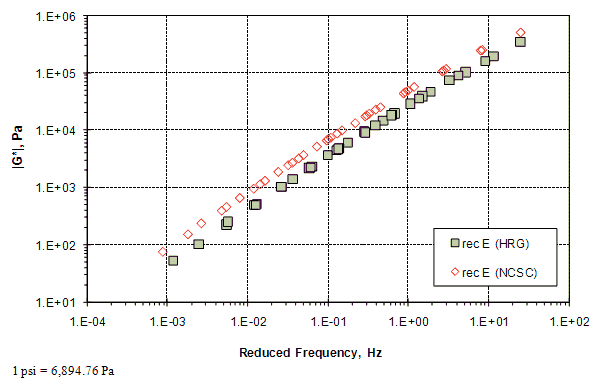
Figure 42. Graph. Comparison of binders recovered using different procedures and same solvent for mix E.
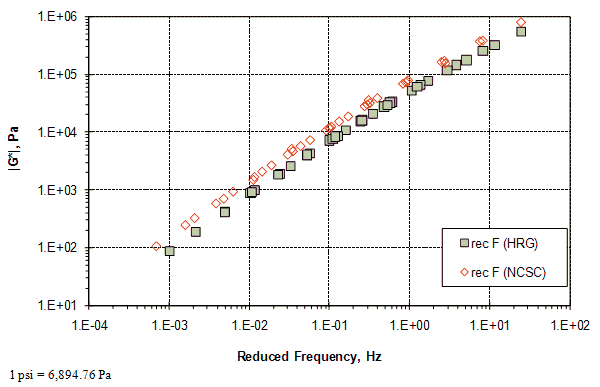
Figure 43. Graph. Comparison of binders recovered using different procedures and same solvent for mix F.
As mentioned previously in this report, samples of one set of plant-produced mixes were provided to TFHRC for fatigue testing. Samples from contractor 5 were provided because more material was available from that contractor.
The TFHRC personnel performed the simplified viscoelastic continuum damage protocol on the six mixes from contractor 5.(28) This procedure utilizes a cyclic axial pull-pull test to evaluate the susceptibility of an asphalt mixture to fatigue damage. They also performed |E*| testing since the phase angle was needed for the analysis of relaxation. A brief summary of the results is provided in this report, and full results are available in the unpublished FHWA report, RAP Mixtures S-VECD Fatigue Characterization Testing and Data Analysis Summary.
Samples of the plant-produced mixtures were transported in metal buckets with rubber lid seals to TFHRC where they were reheated to remove the mix from the pails. The loose material was stirred, split, divided into pans, and heated to 275 °F (135 °C) before compaction in the gyratory. Samples were cored, and the AV content determined. Samples with AV contents of 7 ±0.5 percent were tested after long-term oven aging for 5 days at 185 °F (85 °C).
Two replicates of each mix were tested for |E*| using the standard Asphalt Mixture Performance Test compression protocol. The results are shown in table 21 and table 22 table 22 and table 23.(29) The data were then used to develop |E*| master curves. The results showed that the PG64-22 mixes with 15, 25, and 40 percent RAP were 24, 20, and 24 percent stiffer than the control, respectively. The phase angle decreased 3–6 percent as the RAP content increased. The PG58-28 mixtures were less stiff than their companion mixes with PG64-22. The stiffness of the PG58-28 mixes increased by 3 percent, and the phase angle decreased by 1 percent when the RAP content increased from 25 to 40 percent. Based on |E*| data, it was concluded that the binder grade was much more significant than the RAP content. The researchers also noted that while there did appear to be an effect of the RAP on the stiffness, especially for the PG64-22 mixes, the effect was not proportional to the RAP content. These conclusions agree with the trends but not the proportions in figure 17, figure 18, and table 14 15.
AMENDED 1/11/2012
The direct tension cyclic fatigue testing was performed at 59 and 69.8 70 °F (15 and 21 °C). The tests at 69.8 70 °F (21 °C) were conducted at two strain levels. The test was conducted with a constant actuator displacement, which produced an increasing displacement in the test specimen as measured by four linear variable differential transformers affixed to the specimen. The actuator displacements were determined by trial and error to target failure within 1,000 cycles (high strain) and 10,000 cycles (low strain). After the fatigue testing, the data were processed mathematically to estimate the reduction in modulus and damage characteristic curve at different temperatures and strain levels. The predicted number of cycles to failure to a defined fatigue value, in this case 50 percent reduction in modulus (pseudostiffness), can be determined (full details are provided in the unpublished FHWA report RAP Mixtures S-VECD Fatigue Characterization Testing and Data Analysis Summary). The predicted number of cycles to failure for the various mixtures at different temperatures and loading times for one particular strain and temperature scenario is illustrated in figure 44. The individual ranking of the mix changed depending on the strain and temperature conditions, as illustrated in table 23 24, from higher to lower performance from left to right. The overarching observations hold true where mixes with the softer PG58-28 binder performed better than the PG 64-22 mixes and the higher RAP content performed better than the lower contents. The repeatability of the determinations was reportedly satisfactory. The coefficient of variation for the number of cycles to failure was below 30 percent in all cases except for the PG64-22 mix with 25 percent RAP, which had a coefficient of variation of 34 percent.
AMENDED 1/11/2012
At the time that this report was written, the TFHRC team further analyzed the fatigue data for more explicit definitions of failure rather than the classic, arbitrary criteria of 50 percent reduction in modulus (pseudostiffness). Research showed that the point of localization, which is the point where microcracking coalesces into macrocracking, can occur at different values of modulus reduction depending on the type of mix (e.g., NMAS, binder grade, degree of aging, RAP content, etc.).(28) During the test, this occurs at the point where the phase angle reaches a maximum and then drops to mechanistically reflect localization and a more true definition of fatigue failure. It is unknown at the time this report was written, but the refined analysis could reorient the fatigue life ranking of the mixtures with respect to RAP contents.
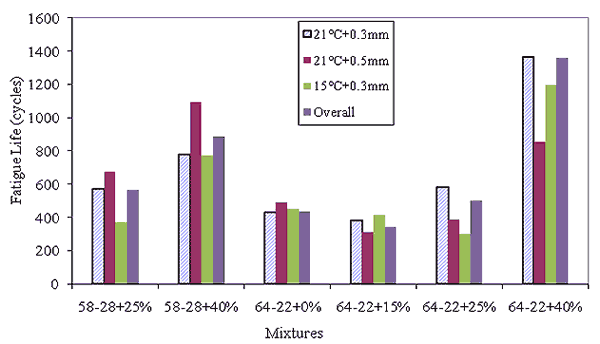
Figure 44. Graph. Fatigue life for mixtures at 69.8 °F (21 °C) and 400 με.
The predicted cycles to failure suggest that the mixes with 40 percent RAP had the greatest fatigue life, which is contrary to expectations. Furthermore, the PG64-22 mix with 40 percent RAP had an even higher fatigue life than the PG58-28 mix with 40 percent RAP. The PG58-28 mix with 25 percent RAP had improved fatigue performance compared to the PG64-22 mix with the same RAP content, which is more in line with conventional wisdom that a softer binder may have improved fatigue performance. Within the PG64-22 mixes, the addition of 15 percent RAP had a slight negative effect on fatigue, while the mixes with 25 and 40 percent RAP showed superior fatigue life compared to the control regardless of the virgin binder grade.
Based on the test results, the following general conclusions were made:
The testing and analysis protocol used is complex and relatively new. Additional testing and analysis is necessary to fully appreciate the implications of the data on fatigue life predictions and the effects of other mix variables on the results. There may be other factors that affect these results and analysis.
The fatigue testing data provide intermediate temperature testing results to supplement the previously reported high- and low-temperature testing data. The mixture testing data plus the binder test results and blending analysis lead to the observations and conclusions in the following section.