U.S. Department of Transportation
Federal Highway Administration
1200 New Jersey Avenue, SE
Washington, DC 20590
202-366-4000
Federal Highway Administration Research and Technology
Coordinating, Developing, and Delivering Highway Transportation Innovations
 |
| This report is an archived publication and may contain dated technical, contact, and link information |
|
Publication Number: FHWA-RD-03-094
Date: March 2005 |
|||||||||||||||||||||||||||||||||||||||||||||||||||||||||||||||||||||||||||||||||||||||||||||||||||||||||||||||||||||||||||||||||||||||||||||||||||||||||||||||||||||||||||||||||||||||||||||||||||||||||||||||||||||||||||||||||||||||||||||||||||||||||||||||||||||||||||||||||||||||||||||||||||||||||||||||||||||||||||||||||||||||||||||||||||||||||||||||||||||||||||||||||||||||||||||||||||||||||||||||||||||||||||||||||||||||||||||||||||||||||||||||||||||||||||||||||||||||||||||||||||||||||||||||||||||||||||||||||||||||||||||||||||||||||||||||||||||||||||||||||||||||||||||||||||||||||||||||||||||||||||||||||||||||||||||||||||||||||||||||||||||||||||||||||||||||||||||||||||||||||||||||||||||||||||||||||||||||||||||||||||||||||||||||||||||||||
Estimating Cumulative Traffic Loads, Volume II: |
|||||||||||||||||||||||||||||||||||||||||||||||||||||||||||||||||||||||||||||||||||||||||||||||||||||||||||||||||||||||||||||||||||||||||||||||||||||||||||||||||||||||||||||||||||||||||||||||||||||||||||||||||||||||||||||||||||||||||||||||||||||||||||||||||||||||||||||||||||||||||||||||||||||||||||||||||||||||||||||||||||||||||||||||||||||||||||||||||||||||||||||||||||||||||||||||||||||||||||||||||||||||||||||||||||||||||||||||||||||||||||||||||||||||||||||||||||||||||||||||||||||||||||||||||||||||||||||||||||||||||||||||||||||||||||||||||||||||||||||||||||||||||||||||||||||||||||||||||||||||||||||||||||||||||||||||||||||||||||||||||||||||||||||||||||||||||||||||||||||||||||||||||||||||||||||||||||||||||||||||||||||||||||||||||||||||||
| Phase 1 |
|
|---|---|
| Phase 2 |
|
| Phase 3 | Recommended phase Recommendations for Phase 3 are provided in chapter 6. |
Of the eight traffic data assessment and projection activities, three were carried out in Phase 1 and five in Phase 2. In this chapter, the activities are described in the order they are listed in figure 1 as steps 1 to 8. To enable the reader to follow the traffic data assessment and projection process better, a general outline of the eight activities is provided first, followed by a more detailed description of the activities.
The main traffic data assessment and projection activities carried out in Phase 1, and described in Phase 1 report were:[1]
The main traffic data assessment and traffic projection activities carried out in Phase 2, and described in here, were:
The Phase 1 report contains the results of the evaluation of LTPP traffic characteristics.[1] The results include examples of spatial and temporal variation in truck volumes; comparison of trends in historical and monitoring annual truck volumes and annual ESALs; the evaluation of the potential of Class 9 vehicles for prediction of axle loads; and the evaluation of axle load distribution characteristics: The Phase 1 report contains a review of several previous studies that used LTPP traffic data to: characterize seasonal variation in truck volumes;[8] evaluate the consequences of alternative sampling plans on the estimated annual traffic loads;[9] and assess the potential of LTPP traffic data to develop models for predicting axle load distributions.[10] The results of an exploratory analysis of trends in traffic data were presented in an interim report that preceded the Phase 1 report. [11]
The review of LTPP traffic data carried out during Phase 1 identified the following major issues, concerns, and recommendations regarding quality and quantity of traffic data and the projection of traffic loads.
The knowledge gained during the preliminary assessment of the amount and quality of available historical and monitoring data was instrumental in the development of the LTPP traffic projection procedure.
This section outlines the LTPP traffic projection procedure. The detailed description of the procedure, including numerical examples in the form of case studies, is contained in the Phase 1 report.[1] To satisfy the following design requirements, the projection procedure was developed to ensure:
The procedure for projecting axle load spectra for the individual LTPP sites includes the following activities:
Mathematically, the LTPP traffic load projection procedure is based on the following formula:
(1)Annual Axle Load Spectrumy = Base Annual Spectrum * Annual Projections Factor y
Where:
| Annual Axle Load Spectrumy | = | Projected annual distribution of axle weights by load ranges for year y. Axle weights are reported separately for single, tandem, and triple axles. |
| Base Annual Spectrum | = | A typical annual axle load spectrum chosen to represent traffic loads on the site. |
| Annual Projection Factory | = | Annual truck volume adjustment factor for year y used to scale the Base Annual Spectrum according to the total volume of trucks in year y. |
The above formula means that once the base annual spectrum was established, it was scaled using the annual projection factor corresponding to the annual truck volume for the given year. Consequently, it was assumed that the truck class distribution remained constant over the years and that only the amount of trucks changed.
Specific techniques, described in Phase 1 report, were developed to obtain base annual spectra for the five projection categories.[1] The five projection categories, classified by the amount of available monitoring data, are defined in chapter 1 of this report. Annual axle load spectra were projected also for the years with monitoring (measured) annual axle load spectra. For these years, both the monitoring and the projected axle load spectra will be available in the IMS database.
To obtain cumulative axle loads, annual axle spectra could be summed as shown in equation 2.
(2)| Cumulative Load Axle Spectrum = | y=n | Annual Axle Load Spectrum |
| S | ||
| y=1 |
Where:
| Cumulative Axle Load Spectrum | = | Total amount of axle weights during n years. Axle weights are reported separately for single, tandem, and triple axles. |
| n | = | The number of years from the opening of highway to traffic through (and including) 1998. |
Category 1 and 2 sites have monitoring annual axle load spectra in the IMS database; these spectra were used to obtain the base annual spectrum. Traffic load projections carried out in Phase 2 were done for Category 1 and 2 sites only, and were in terms of annual axle load spectra. Typically, the base annual spectrum was an average of all acceptable annual spectra for the given site. Techniques used to establish base annual spectra for Category 1 and 2 sites are summarized as part of step 5 (figure 1) in the section titled "Development of Base Annual Spectra."
The Phase 1 report also contains the description of procedures developed for estimating base annual spectra for Category 3 and 4 sites, as well as numerical examples of traffic projections for these sites.[1] Even though these procedures were not used in this report, they are outlined below because they are important for the understanding of the subsequent recommendation to develop the LTPP PLG (discussed in chapter 5 of this report).
Category 3 includes sites with site-specific monitoring truck class distribution data but without acceptable site-specific monitoring axle load distribution data. Because these sites do not have annual axle load spectra in the database, the base annual spectrum must be estimated. According to the Phase 1 report, it is proposed to accomplish this by combining the following two inputs:[1]
If there are several years for which the site-specific monitoring truck class distributions are available, a typical truck volume distribution (called the base truck distribution) is established by plotting and assessing all annual truck class distributions using similar techniques as those used to obtain the base annual spectrum. The objective is to obtain the truck class distribution that best represents the given site.
The sources of surrogate axle load spectra include site-related data, regional data, and generic or typical data.
Category 4 includes sites with annual truck volume data but without site-specific truck class and axle load distributions. Because these sites do not have annual axle load distribution in the database, the base annual axle load spectrum must be constructed. According to the Phase 1 report, it is proposed to accomplish this by combining the following three inputs:[1]
The sources of surrogate truck class and axle load distribution data include site-related data, regional data, and generic or typical data.
The methodology for projecting axle load spectra was evaluated and demonstrated in Phase 1 using case studies for selected LTPP sites. Case studies are numerical example applications of the traffic projection procedure for actual LTPP sites. All together, 12 case studies were carried out (3 case studies in each projection category except Category 5). The following observations were based on the results of the case studies:[1]
To meet the objectives of the Phase 2 study, it was necessary to work with all LTPP sites and with all participating agencies. The LTPP traffic database contains 890 unique traffic sites located in 62 agencies. Reflecting the objectives of the Phase 2 study, the objectives of the LTPP Traffic Feedback and Resolution Package were:
To efficiently assess traffic data and carry out traffic projections for all 890 LTPP sites, and to communicate the traffic projection results to participating agencies effectively, we developed a standardized package-the LTPP Traffic Feedback and Resolution Package (also referred to here as "the package"). The package combines graphic traffic data displays, information on how to interpret the data displays, and questionnaires addressing overall and site-specific traffic data issues. A separate package was prepared for each participating agency.
The rest of this section describes the content of the package and the involvement of the representatives of RCOs and others in its development and validation.
The package consisted of five items:
These five items are briefly described below. The package was quite bulky, particularly for agencies with many LTPP sites.
The introductory letter was prepared and signed by a representative of the RCO and was addressed to the State or Province LTPP contact engineer or other official. Typically, the letter outlined the purpose of the package and asked that a person within the agency who was familiar with the collection of traffic data for LTPP sites review the package and respond to the issues raised. Some letters also included additional information and comments regarding the traffic data availability for specific sites (e.g., if data submitted previously by the participating agencies were not yet included in the package).
The outline of the LTPP traffic projection procedure was a 10-page report that explained the traffic projection procedure used to estimate traffic loads in straightforward language. The objective of the outline was to enable the reviewer to understand the relative importance of the different issues, potential discrepancies, and questions posed in the package. The outlined discussed:
The initial overall feedback and resolution report was typically a 4- or 5-page report that contained a summary of traffic data assessment and traffic projection issues concerning more than one LTPP site. The report was called "initial" because it was concerned with the first traffic projections carried out for LTPP sites. The initial overall feedback and resolution report served two purposes:
The issues and questions were grouped under the following headings:
Overall review -The overall review included a table listing all LTPP sites for the agency and their corresponding LTPP experiment numbers and the initial projection confidence codes. The initial projection confidence codes were used to characterize the level of confidence associated with initial traffic projections. The assignment of the projection codes is described later ("Assignment of Initial Traffic Projection Codes" in step 5).
Missing data -This section provided a comprehensive listing of traffic data that were missing from the IMS database.
Location of sections -Particular attention was paid to the nearby sites located on the same highway, particularly if the sites were also located in the same direction of travel. The objective was to ascertain the existence of expected relationships between truck volumes and axle loads on related sites. Any potential discrepancies were brought to the attention of the agency representatives.
An example of the data assessment carried out under the heading of "Location of sections" is provided in table 3. As expected, nearby sites on the same highway in the same direction have similar truck volumes, truck percentages, and truck growth rates. The exception appears to be the two northbound sites on U.S. Route 93 in Arizona that have quite different truck percentages (15 versus 27) and quite different recent truck growth rates (1.0 versus 10.0 percent).
Traffic volumes -The objective of this part of the report was to emphasize the importance of trends in annual historical and monitoring truck volumes for the development of the traffic load projections. Sections with unexpected variation in annual truck volumes were identified and reviewers were asked to address truck volume discrepancies on a section-specific basis.
Vehicle classification-operation of AVC equipment-Typically, the main concern with vehicle classification was the number of vehicles that were not properly classified by the traffic monitoring equipment. These vehicles are identified in the IMS as Class 14 vehicles. Some agencies reported that the percentage of Class 14 vehicles in the total truck flow was, for the majority of sites and years, above 10 percent. Some agencies did not report any Class 14 vehicles. Questions posed to the agencies regarding vehicle classification were regarding: (a) distribution of Class 14 vehicles into "legitimate" vehicle classes; (b) reporting of vehicles that were not properly classified by AVC equipment; and (c) type of procedures used to ensure that the vehicles are properly classified.
Axle weights-operation of WIM scales-This segment of the overall report contained two parts.
The first part identified the LTPP sites with questionable axle load data and inquired about the procedures used to calibrate WIM scales and to review axle load data prior to their submission to RCOs. Questionable axle load distributions, for at least some sections and some monitoring years, were reported by all agencies that reported monitoring axle loads. Typically, the following questions were asked: What type of procedure is used to ensure that WIM scales are calibrated? Is WIM calibration done routinely? Do you have resources to review traffic data prior to their submission to LTPP? If so, what procedures do you use?
The second provided the results of analysis carried out to ascertain basic traffic loading patterns for all LTPP sites within the agency. The objective was to provide a summary of axle load characteristics and to identify sites that do not fit overall patterns. An example of such a summary is shown in tables 4 and 5.
| Location, Hwy No. and Direction | Nearby Sites | 1998 AADT Truck Volume | 1998 Truck Percentage | Recent Truck Growth, % | Year or Years for which Axle Load Data are Available, Comments |
|---|---|---|---|---|---|
| 93 N | 0100 | 900 | 15 | 1.0 | 1997, axle load spectra are identical |
| 1036 | 800 | 27 | 10.0 | ||
| 10 W | 1001 | 2620 | 31 | 7.4 | 1995 and 1996 |
| 1003 | 3400 | 52 | 7.0 | 1994 | |
| 1006 | 3160 | 45 | 6.7 | 1995 | |
| 1007 | 3530 | 44 | 7.4 | 1995, 1996, 1997 | |
| 7614 | 3490 | 35 | 9.0 | 1996 | |
| 19 S | 1015 | 620 | 7 | 7.0 | None |
| 1016 | 470 | 8 | 6.0 | 1994 | |
| 1018 | 450 | 8 | 6.0 | 1993 | |
| 6054 | 570 | 8 | 2.0 | 1993 | |
| 19 N | 1017 | 540 | 10 | 4.0 | 1997 |
| 6060 | 590 | 13 | 7.0 | 1996, 1997, 1999 | |
| 40 W | 1002 | 2210 | 49 | 8.0 | 1997, 1999 |
| 1021 | 2240 | 50 | 11.0 | None | |
| 1022 | 2240 | 50 | 11.0 | None | |
| 1025 | 2130 | 47 | 7.0 | 1993, 1994 | |
| 1062 | 2190 | 58 | 9.0 | 1993 | |
| 40 E | 1024 | 2080 | 46 | 7.0 | 1993 |
| 1065 | 2140 | 54 | 9.0 | 1993 |
The results in tables 4 and 5 indicate a similarity of traffic load characteristics with a few exceptions. For example, all TFs in table 4 are in the range of 0.9 to 1.3, except the TF of 0.6 for Mississippi site 1001. Consequently, the axle load data on this site need to be assessed to ascertain the reason for lower-than-expected axle loads.
The purpose of this report was to:
| Highway Functional Class | Site No. (Prefix of 28) | Flexible Pavement | Rigid Pavement | ||||
|---|---|---|---|---|---|---|---|
| 1998 Truck % | Average Unloaded / Loaded Peaks of Tandem Axle Load Spectra (kips)** | Average Truck Factor (ESALs /Truck) | 1998 Truck % | Average Unloaded / Loaded Peaks of Tandem Axle Load Spectra (kips)** | Average Truck Factor (ESALs / Truck) | ||
| Urban Principal Arterial | 1016 | 9 | 9/31 | 1.0 | - | - | - |
| 5805* | - | - | - | 15 | 11/27 | 1.1 | |
| Rural Principal Arterial | 0500* | n/a | 11/33 | 1.3 | - | - | - |
| 1001 | 9 | 9/29 | 0.6 | - | - | - | |
| 1802 | 22 | 11/31 | 0.9 | - | - | - | |
| 2807 | 12 | 11/33 | 1.1 | - | - | - | |
| 3018 | - | - | - | 24 | 9/29 | 1.2 | |
| 3019 | - | - | - | 24 | 9/29 | 1.2 | |
| 3081 | 31 | 11/32 | 1.1 | - | - | - | |
| 3082 | n/a | 13/33 | 1.2 | - | - | - | |
| 3087 | 8.5 | 11/36 | 1.3 | - | - | - | |
| 3089 | 12 | 11/33 | 1.1 | - | - | - | |
| 3091 | 13 | 11/33 | 1.3 | - | - | - | |
| 3093* | 20 | 11/31 | 0.9 | - | - | - | |
| 3094* | 20 | 11/31 | 0.9 | - | - | - | |
| 3097* | - | - | - | 14 | 11/27 | 1.7 | |
| 3099* | - | - | - | 41 | -/31 | 1.7 | |
| 5006 | - | - | - | 28 | 11/29 | 1.1 | |
| 5025 | - | - | - | 16 | 11/33 | 1.9 | |
| 5803 | - | - | - | 36 | 11/33 | 1.8 | |
| 7012* | - | - | - | 29 | -/31 | 1.8 | |
| 9030* | 32 | 13/31 | 1.0 | - | - | - | |
*Interstate; **1 kip = 4450 newtons
| Highway Functional Class | Site No. (Prefix of 28) | 1998 Projected AADT Truck Volume | 1998 Truck % | 1998 Annual Growth Rate % | Historical TF (ESALs/Truck) |
|---|---|---|---|---|---|
| Rural Principal Arterial | 3083 | 25 | 8 | 1.5 | 0.6-1.5 |
| 3085 | 25 | 8 | 1.5 | 0.6-1.5 | |
| 3090 | 40 | 7 | 2.0 | 0.3-1.0 | |
| 4024 | 130 | 4 | 3.0 | 0.5-1.4 |
An example of the Initial Site-Specific Feedback and Resolution Report, prepared for the representatives of participating agencies assigned the task to review the initial traffic projections, is provided in figure 2. Specifically, figure 2 includes the entire site-specific feedback and resolution report prepared for the Mississippi Department of Transportation (DOT); the reports prepared for other agencies were similar.
The report in figure 2 refers to 26 site-specific reports (one for each of the 26 Mississippi LTPP sites that have traffic data in the IMS database). One of the 26 site-specific reports for Mississippi, report for site 285805 is presented in figures 3 through 10. To assist the reader in making the connection between the reports, figure 2 contains references to figures 3 through 10. The first data sheet of the site-specific report (figure 3) was on blue paper and is referred to as a "Blue Sheet."
The site-specific report for site 285805 (figures 3 through 10) consists of eight data sheets:
The procedures used to develop site-specific reports are described in the Phase 1 report, and the content and purpose of the report are described in figure 2.[1] Subsequent sections will provide a description of techniques used to develop the initial projections shown in figures 6 and 10, and to assign projection confidence codes.
The Blue Sheet in figure 3 is shown as having been completed by the Mississippi Department of Transportation (MDOT) to avoid the need to show separate examples of uncompleted and completed Blue Sheets. The completion of Blue Sheets by participating agencies will be discussed in step 7 (Review of LTPP Traffic Feedback and Resolution Packages by Participating Agencies).
|
INITIAL SITE-SPECIFIC FEEDBACK AND RESOLUTION REPORT FOR MISSISSIPPI November 2000 ERES LTPP DATS Traffic Analysis Team Baltimore-Washington DC Area Office INTRODUCTION This report is about site-specific traffic projection issues concerning individual LTPP sites. The traffic projection issues that are applicable to more than one site are addressed in the Initial Overall Feedback and Resolution Report for Mississippi. The report is called "initial" because it comments on the first, or initial, traffic projections carried out for Mississippi sites. The purpose of this report is twofold:
Attached to this report are site-specific reports prepared for the 26 Mississippi LTPP sites that contain traffic monitoring data in the LTPP traffic database. Each report starts with a blue "Feedback and Data Resolution Sheet." Please review each report according to the guidelines provided herein. In order for the reviewer to understand the relative importance of the different issues, potential discrepancies, and questions posed in this report, it is recommended that the reviewer become familiar with the overall traffic projection methodology. For this reason, an outline of the traffic projection methodology, entitled, An Outline of the LTPP Traffic Projection Procedure, is attached to this mailing. How To Communicate with Us Please use the blue Feedback and Data Resolution Sheet in front of the packages prepared for the individual sites. Handwritten notes are certainly sufficient. The sheets contain a number of questions and comments on a variety of issues, and seek input on these issues from the representatives of Mississippi DOT. In some situations, it may be appropriate to respond, in addition to using the blue sheet, by other means including telephone and e-mail. Thank you very much for your help. INSTRUCTIONS FOR THE REVIEWER In order to facilitate the review of the projected traffic data, and the identification of site-specific issues (that need to be brought to the attention of the reviewer), a standardized format was developed to report and present traffic data (historical, monitoring, and projected) for the individual LTPP sites. Traffic data for each LTPP site that has WIM scale monitoring data are presented using a set of eight sheets. The eight-sheet set constitutes a standard package for the display and presentation of the projected traffic data and for their review by the representatives of State highway administrations (SHAs). The set contains the following sheets.
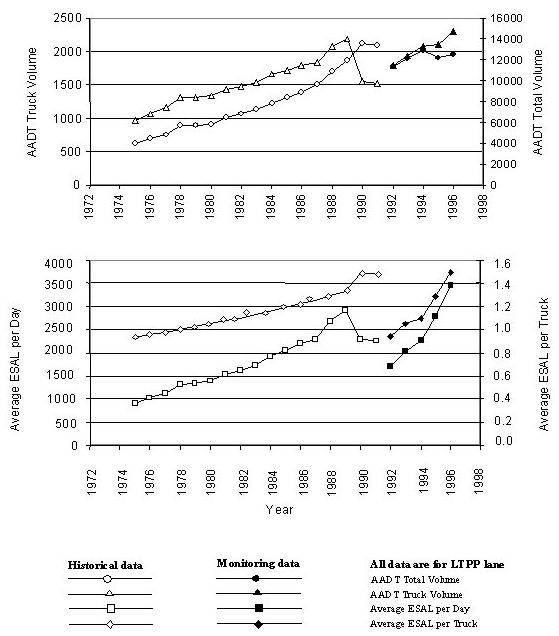
The following briefly describes the purpose of each sheet and highlights typical features and concerns that usually require the review and assessment by SHA representatives. Feedback and Data Resolution Sheet (Blue Sheet), figure 3 The purpose of this sheet is to summarize all major site-specific features that may influence traffic projection. This is the principal communication tool between the traffic team and the SHA reviewer. It is expected that the reviewer will complete the blue sheet for each LTPP site under review. Additional comments and suggestions are encouraged. Please use additional sheets or the reverse side if needed. Site Map, figure 4 The objective is to clearly identify the location of the site in question, as well as the location of nearby sites (which may serve as surrogate source of traffic data). The location of each site should be verified. Annual Traffic Projection Sheet, figure 5 The annual traffic projection sheet is used to summarize trends in historical and monitoring traffic data (AADT volumes, AADT truck volumes, average ESALs per day, and TFs). It is expected that traffic volumes and ESALs will exhibit
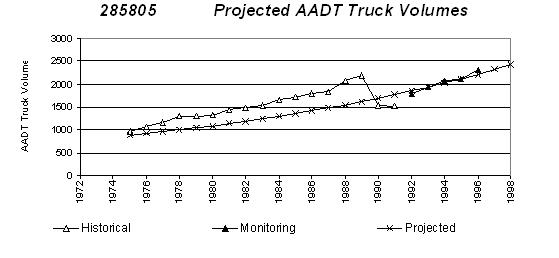
an increasing trend. Projected AADT Truck Volumes, figure 6 This sheet shows historical and monitoring truck volumes and the suggested projection model-typically a smooth line or a curve-used to estimate truck volumes for all in-service years. This model is also used to project (estimate) axle load spectra. If needed, the model can exactly duplicate the reported historical data trends. Are additional data available from other State sources? Can a better model be developed and used? If so, please sketch the new model on the sheet. Annual Vehicle Class Distribution, figure 7 The top half of the sheet shows actual axle counts for different truck classes. The bottom half of the sheet shows the distribution of trucks as a percentage of the total truck count. All available years are plotted to spot outliers and questionable results. The unexpected truck distributions should be identified. This activity contributes to the judicious selection of the base spectra. Usually, for the same site, annual vehicle class distributions should be similar from year to year. It is expected that the number of Class 9 vehicles (5-axle tractor-semi-trailers) will predominate on rural interstates while, on the other hand, the number of 2-axle single-unit trucks will become significant on urban and semi-urban roads. Annual Load Spectra, figure 8 Annual axle load spectra are plotted for all available years (the years with monitoring WIM scale data). The annual spectra are used to select/calculate a typical "base" spectrum. The base spectrum is then used to estimate axle load spectra (particularly for years without monitoring WIM data). In some instances, two base spectra are used for the projection: the first spectrum and the last spectrum. If the site has reliable annual spectra for many years, two base annual spectra may be used for the projection. For example, the first base spectrum is used to represent traffic during the years before the installation of a WIM scale, and during the initial operation of the scale. The second spectrum is used to represent traffic levels for the most recent years, with and without WIM scale data. Both the first and the last spectra can be the averages of several annual spectra. At most sites, and there are exceptions, most tandem axle loads are caused by Class 9 trucks (5-axle tractor-semi-trailers). Consequently, the distribution of tandem axles (shown in the middle of the sheet) usually has two peaks. The first peak corresponds to unloaded tandems, and the second peak to the fully loaded tandems. These two peaks are usually at 10 to 11 kips and 31 to 33 kips, respectively. (Federal regulations limit tandem axle weight to 34,000 lb.) It is important to identify all incorrect and suspicious spectra, and to recommend which spectra should be used (averaged) to obtain the base spectrum. Usually, annual load spectra for the same site should be similar. It may be difficult, without inside knowledge, to judge the validity of spectra if there are just a few spectra available to define the expected pattern. Average Annual Load Spectrum, figure 9 The average annual load spectrum is obtained by calculating the average of the annual spectra, presented in figure 8, that are considered to be valid. It is also the base spectrum used for the projection. Projected Annual ESALs, figure 10 This sheet provides a summary of equivalent single axle loads (ESALs) projected for all in-service years. ESALs are calculated using the site-specific pavement structure (type and thickness). It is recognized that the purpose of traffic collection and analysis is to obtain axle load spectra (and not ESALs). ESALs are used mainly for comparison and QA purposes. Are the projected annual ESALs and the cumulative ESALs reasonable? Only pavement professionals can typically answer this question. |
| GPS-5 285805 Feedback and Data Resolution Sheet | |||||||||||||||||||||||||||||||
|---|---|---|---|---|---|---|---|---|---|---|---|---|---|---|---|---|---|---|---|---|---|---|---|---|---|---|---|---|---|---|---|
| State / Province | Mississippi | Direction | West | ||||||||||||||||||||||||||||
| Road Number | 10 | Total No. of Lanes | 4 | ||||||||||||||||||||||||||||
| County / Town | Harrison | Pavement Structure | D=8.2 | ||||||||||||||||||||||||||||
| Functional Class | Urban Principal Arterial - State | Open to Traffic | 1975 | ||||||||||||||||||||||||||||
| Please review the attached sheets (and any other information that you feel is applicable), and respond to the following questions. Please use the reverse side of this form if you need more space. | |||||||||||||||||||||||||||||||
|
|||||||||||||||||||||||||||||||
| Completed by: | Date: | Tel. No.: | Email: | ||||||||||||||||||||||||||||
| Thank you very much for your help. ERES LTPP DATS Traffic Analysis Team |
|||||||||||||||||||||||||||||||
Figure 4. Site map for site 285805.
Figure 5. Annual Traffic Projection Sheet for Site 285805.
| Data Type | Availability of Monitoring Data | ||||||||||
|---|---|---|---|---|---|---|---|---|---|---|---|
| 1990 | 1991 | 1992 | 1993 | 1994 | 1995 | 1996 | 1997 | 1998 | Total | ||
| AVC | Days | - | - | 266 | 361 | 351 | 363 | 160 | - | - | 1,501 |
| Month | - | - | 9 | 12 | 12 | 12 | - | - | - | 45 | |
| WIM | Days | - | - | 177 | 333 | 351 | 361 | 161 | - | - | 1,383 |
| Month | - | - | 6 | 11 | 12 | 12 | - | - | - | 41 | |
Figure 6. Projected AADT volumes for site 285805.
| Year | AADT Truck Volumes | Projected Growth | |||
|---|---|---|---|---|---|
| Historical | Monitoring | Projected | Percentage | Factor | |
| 1975 | 970 | - | 885 | - | 0.45 |
| 1976 | 1060 | - | 923 | 4.2 | 0.47 |
| 1977 | 1160 | - | 962 | 4.2 | 0.49 |
| 1978 | 1310 | - | 1003 | 4.3 | 0.51 |
| 1979 | 1300 | - | 1046 | 4.3 | 0.53 |
| 1980 | 1330 | - | 1091 | 4.3 | 0.55 |
| 1981 | 1440 | - | 1139 | 4.4 | 0.58 |
| 1982 | 1480 | - | 1189 | 4.4 | 0.60 |
| 1983 | 1530 | - | 1241 | 4.4 | 0.63 |
| 1984 | 1660 | - | 1296 | 4.4 | 0.66 |
| 1985 | 1720 | - | 1354 | 4.5 | 0.68 |
| 1986 | 1790 | - | 1415 | 4.5 | 0.72 |
| 1987 | 1830 | - | 1479 | 4.5 | 0.75 |
| 1988 | 2070 | - | 1545 | 4.5 | 0.78 |
| 1989 | 2190 | - | 1616 | 4.5 | 0.82 |
| 1990 | 1544 | - | 1690 | 4.6 | 0.85 |
| 1991 | 1524 | - | 1767 | 4.6 | 0.89 |
| 1992 | - | 1789 | 1848 | 4.6 | 0.93 |
| 1993 | - | 1937 | 1934 | 4.6 | 0.98 |
| 1994 | - | 2079 | 2023 | 4.6 | 1.02 |
| 1995 | - | 2105 | 2118 | 4.7 | 1.07 |
| 1996 | - | 2307 | 2217 | 4.7 | 1.12 |
| 1997 | - | - | 2320 | 4.7 | 1.17 |
| 1998 | - | - | 2429 | 4.7 | 1.23 |
Figure 7. Annual vehicle class distribution for site 285805.
Figure 8. Annual load spectra for site 285805.
Figure 9. Average annual load spectrum for site 285805.
Figure 10. Projected annual ESALs for site 285805.
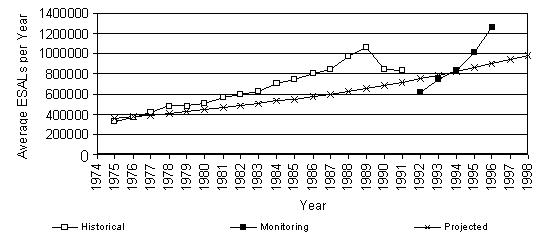
| Year | Annual ESALs | ||
|---|---|---|---|
| Historical | Monitoring | Projected | |
| 1975 | 330000 | - | 359237 |
| 1976 | 371000 | - | 374473 |
| 1977 | 414000 | - | 390386 |
| 1978 | 479000 | - | 407112 |
| 1979 | 486000 | - | 424689 |
| 1980 | 509000 | - | 443146 |
| 1981 | 565000 | - | 462405 |
| 1982 | 595000 | - | 482762 |
| 1983 | 631000 | - | 504029 |
| 1984 | 702000 | - | 526419 |
| 1985 | 748000 | - | 549829 |
| 1986 | 799000 | - | 574507 |
| 1987 | 840000 | - | 600428 |
| 1988 | 978000 | - | 627632 |
| 1989 | 1063000 | - | 656134 |
| 1990 | 837000 | - | 686160 |
| 1991 | 827000 | - | 717567 |
| 1992 | - | 618395 | 750656 |
| 1993 | - | 744923 | 785370 |
| 1994 | - | 833212 | 822124 |
| 1995 | - | 1017005 | 860362 |
| 1996 | - | 1256965 | 900519 |
| 1997 | - | - | 942662 |
| 1998 | - | - | 986994 |
| Cumulative | - | - | 14835602 |
The package described in the preceding section was the final version of the one that was distributed to the majority of the participating agencies. It was developed and refined over the course of several months through an interactive process involving reviews by interested parties and by representatives of several participating agencies. The two main review activities were:
In addition, throughout the course of Phase 2 work, several small changes and enhancements to the package were instituted.
The important role of the RCOs in the projection process was recognized from the beginning of the study. Representatives of RCOs reviewed the first version of the LTPP Traffic Feedback and Resolution Package and subsequently reviewed agency-specific packages for all participating agencies in their respective regions.
The first package also was submitted to all members of the LTPP ETG on Traffic Data Collection and Analysis for review and comments, and a later version was presented during an ETG meeting in the spring of 2000. Reviews of an early version of the Package were also obtained from the representatives of the Technical Support Services Contractor and from the Minnesota Department of Transportation (Mn/DOT).
All reviewers provided valuable comments and suggestions on how to make the package more effective and user-friendly.
During Phase 1 traffic projection work, it became apparent that it was necessary to involve representatives from the participating agencies in the traffic projection process because many data problems cannot be resolved without their involvement and help. The primary contact between the participating agencies and the LTPP program has been through RCOs. RCOs provide general technical support to the agencies regarding traffic data collection and analysis issues and are responsible for initial traffic data quality checks and for processing traffic data collected by the agencies. Consequently, the involvement of both the participating agencies and RCOs in traffic data assessment and projection is important. Pilot studies brought together the representatives of the participating agencies, RCOs, the project team, and others.
The main feature of the pilot studies was a 1-day meeting that was held at the participating agencies and attended by representatives of the participating agency (typically including an LTPP contact engineer, personnel responsible for traffic data management, field traffic data collection personnel, and others), RCOs (personnel responsible for traffic data), FHWA (representing the LTPP program, and FHWA Division Office), and two members of the project team.
The purpose of the pilot studies was to review and enhance the process of traffic data assessment and projection of traffic loads, including the content of the LTPP Traffic Feedback and Resolution Package, and to discuss specific issues concerning the agencies' LTPP sites. The pilot studies also provided an opportunity for the representatives of the RCOs to become better acquainted with the package and traffic data assessment and projection issues. For this reason, one pilot study took place in each of the four LTPP regions:
| Agency | Meeting Place | LTPP Region |
|---|---|---|
| California DOT | Sacramento, CA | Western Region |
| Florida DOT | Tallahassee, FL | Southern Region |
| New Jersey DOT | Trenton, NJ | North Atlantic Region |
| Indiana DOT | Indianapolis, IN | North Central Region |
During the course of the meeting, attendees discussed the LTPP package prepared for the agency. Agency representatives provided comments on specific LTPP sections following the format of the Feedback and Data Resolution Sheet (figure 3).
The pilot studies resulted in several improvements to the package, and in better communication among all interested parties, particularly between the representatives of the RCOs and the project team.
| Previous | Table of Contents | Next |

