U.S. Department of Transportation
Federal Highway Administration
1200 New Jersey Avenue, SE
Washington, DC 20590
202-366-4000
Federal Highway Administration Research and Technology
Coordinating, Developing, and Delivering Highway Transportation Innovations
 |
| This report is an archived publication and may contain dated technical, contact, and link information |
|
Publication Number: FHWA-HRT-06-064 Date: December 2006 |
View PDF version(578 KB)
PDF files can be viewed with the Acrobat® Reader®
FHWA Contact: Larry Wiser, HRDI-13, 202-493-3079, larry.wiser@fhwa.dot.gov
The Long Term Pavement Performance (LTPP) program is a 20-year study of in-service pavements across North America. Its goal is to extend the life of highway pavements through various designs of new and rehabilitated pavement structures, using different materials and under different loads, environments, subgrade soil, and maintenance practices. LTPP was established under the Strategic Highway Research Program and is now managed by the Federal Highway Administration.
Researchers in the Long-Term Pavement Performance (LTPP) program are conducting a major data collection effort. They are using an inertial profiler to collect longitudinal profile data at regular intervals on two wheelpaths located along the LTPP program test sections. In the LTPP program, the United States and Canadian Provinces are divided into four regions for the purposes of data collection, and a regional support contractor (RSC) operates an inertial profiler in each region.
After collecting the profile data, the researchers process the data to compute roughness indices, such as the international roughness index (IRI), root mean square vertical acceleration (RMSVA), slope variance, and the Mays index. They then store the computed roughness parameters and profile data in the LTPP database and make these data available to other members of the research community.
From the start of the LTPP program through the end of 1996, researchers collected profile data at the test sections using an incandescent profiler (model number DNC 690) manufactured by K.J. Law Engineers. In late 1996, each RSC replaced their model DNC 690 profiler with a T-6600 infrared profiler manufactured by K.J. Law Engineers. In September 2002, each RSC replaced their T-6600 profiler with an International Cybernetics Corporation (ICC) model MDR 4086L3 laser profiler.
The height sensors on each of the three profilers have a different footprint size. The DNC 690 profilers had a footprint of 150 millimeters (mm) by 6 mm with the 150-mm side being perpendicular to the direction of travel. The T-6600 profilers had an elliptical footprint that was 38 mm by 6 mm, with the 38-mm side perpendicular to the direction of travel. The ICC profilers that are currently in use are equipped with laser height sensors that have a circular footprint of approximately 1.5 mm in diameter.
The LTPP program conducted a research project recently to (1) compare IRI values obtained by the different inertial profilers, (2) investigate data collection characteristics and compare profile data collected by the different inertial profilers, and (3) investigate the factors that contribute to differences in IRI values for data obtained from the LTPP profilers and Dipstick®. That analysis indicated good agreement in the IRI values among the different inertial profilers used in the LTPP program. This indicates that the IRI values in the LTPP database can be used to analyze roughness progression at test sections without any adjustments to the IRI values obtained by the different profilers.
Findings: Comparison of Profile Data Obtained by the Profilers
The data from the DNC 690 and T-6600 profilers showed good agreement, despite some differences in the profiles of the test sections with significant long-wavelength content. These differences may be attributed to the different long-wavelength cutoff filter values used with the two profilers (91 and 100 meters (m) for the DNC 690 and T-6600, respectively). It appears both of these profilers use the same long-wavelength cutoff filtering technique. Comparison of 25-mm interval profile data for the T-6600 and ICC profilers also indicated good agreement between the two profilers for wavelengths between 1 and 40 m, which is within the wavelength range that predominantly influences the IRI. For wavelengths less than 1 m, the ICC profiler typically showed a higher wavelength content than the T-6600 profiler. This was attributed to the smaller footprint of the ICC profiler, which most likely caused texture effects and a higher magnitude of narrow features to be recorded. For wavelengths greater than 40 m, the T-6600 profiler recorded more wavelength content than the ICC profiler. This was attributed to the differences in the long-wavelength filtering techniques used by the two profilers, although both profilers applied an upper-wavelength cutoff filter of 100 m.
Figure 1. Chart. This chart shows the
relationship between the IRI values for the K.J. Law Engineers
T-6600 and ICC profilers.
Figure 2. Graph. This chart shows the
relationship between the IRI values for the K.J. Law Engineers DNC
690 and T-6600 profilers.
Findings: Comparison Between Dipstick and Profiler IRI
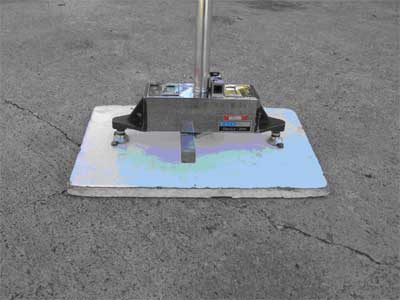
The Dipstick, a hand-operated device manufactured by The Face Companies®, has a digital inclinometer that measures the elevation difference between the device's two footpads. Researchers use Dipstick during LTPP profiler comparisons to obtain reference elevations along the two wheelpaths at the test sections. When properly calibrated and operated, Dipstick provides profiles as good as those from rod-and-level surveys, but at a fraction of the time and cost.
The study indicated that a variety of factors could cause the IRI values obtained from the Dipstick data to differ from the IRI values obtained from the profiler data. The factors that contributed to these differences were (1) sampling qualities of the Dipstick, (2) variations between the path followed by the profiler and the path where the Dipstick measurements were performed, (3) features recorded by the profiler that the Dipstick missed because of differences in sampling intervals, (4) discrepancies caused when the footpads of the Dipstick bridge over narrow, downward features that are measured by the profiler, (5) features that are recorded by the profiler but are underestimated by the Dipstick because the footpad of the device may not rest in the deepest part of a feature, and (6) errors in Dipstick measurements.
Recommendations for Improving Current LTPP Data Collection and Data Processing Procedures:
Figure 3. Photograph. A view of the
Dipstick.
Recommendations for LTPP Profiler Comparisons:
Research -- This study was performed by Soils and Materials Engineers, Inc., 43980 Plymouth Oaks Blvd., Plymouth, MI 48170, 734-454-9900. Contract No. DTFH61-02-D-00137.
Distribution -- This TechBrief is being distributed according to a standard distribution. Direct distribution is being made to the Divisions and Resource Center.
Availability -- The publication from which this TechBrief was developed, Quantification of Smoothness Index Differences Related to Long-Term Pavement Performance Equipment Type (FHWA-HRT-05-054), is available from the National Technical Information Service, 5285 Port Royal Road, Springfield, VA 22161. A limited number of copies will be available from the Research and Technology Product Distribution Center, HRTS-03, FHWA, 9701 Philadelphia Court, Unit Q, Lanham, MD 20706, telephone: 301-577-0818, fax: 301-577-1421.
Key Words -- LTPP, international roughness index, IRI, profile index, inertial profilers, Dipstick, pavement data collection, pavement profile, profile measurement, profiler.
Notice -- This document is disseminated under the sponsorship of the U.S. Department of Transportation in the interest of information exchange. The U.S. Government assumes no liability for the use of the information contained in this document. The U.S. Government does not endorse products or manufacturers. Trademarks or manufacturers' names appear in this report only because they are considered essential to the objective of the document.
Quality Assurance Statement -- The Federal Highway Administration (FHWA) provides high-quality information to serve Government, industry, and the public in a manner that promotes public understanding. Standards and policies are used to ensure and maximize the quality, objectivity, utility, and integrity of its information. FHWA periodically reviews quality issues and adjusts its programs and processes to ensure continuous quality improvement.
FHWA-HRT-06-064

