U.S. Department of Transportation
Federal Highway Administration
1200 New Jersey Avenue, SE
Washington, DC 20590
202-366-4000
Federal Highway Administration Research and Technology
Coordinating, Developing, and Delivering Highway Transportation Innovations
 |
| This report is an archived publication and may contain dated technical, contact, and link information |
|
Publication Number: FHWA-HRT-06-109 Date: September 2006 |
Venkatesa Prasanna Kumar Ganesan
The Pennsylvania State University
Faculty Advisor
Shelley M. Stoffels, D.E., P.E.,
The Pennsylvania State University
Agency Liaison
Janice Arellano, P.E.,
Pennsylvania Department of Transportation
Project Consultant
Dennis Morian, P.E.,
Conneaut Lake, PA
State transportation agencies use various methods of pavement data collection. The major methods are manual, film-based, semiautomated, and automated collection. The Federal Highway Administration (FHWA) Long-Term Pavement Performance (LTPP) program has used both the manual method and the Pavement Distress Analysis System (PADIAS) film-based survey for its pavement data collection.(1) The Pennsylvania Department of Transportation (PennDOT) replaced its former manual method with a semiautomated method. The project team at the Pennsylvania Transportation Institute developed a quality assurance plan for PennDOT for pavement data collection and rating. Initial acceptance limits were developed by the project team with the assistance of PennDOT. The manual distress data are compared with the PADIAS 4.2 distress data. This paper also summarizes the PennDOT quality assurance plan. The sources of variability affecting surface distress are also discussed. In this paper, the LTPP distress data are used to verify the PennDOT acceptance limits. The findings indicate that the proposed limits may require modification. Two types of modifications are attempted with the LTPP data, providing input to PennDOT’s future decisions.
State transportation agencies follow various treatment or decision matrices in their pavement management systems. Some agencies consider individual distress and severity levels and others consider composite indices, such as pavement condition index and pavement distress index, for their treatments. The Pennsylvania Department of Transportation (PennDOT) considers individual distress and severity level treatments for its treatment methodology.
The methods of data collection for pavement surface distress can be categorized as manual, film-based, semiautomated (remote survey), and automated. Transverse profile data are collected to determine the rut depth. Longitudinal profile data are collected to determine pavement roughness.
This paper emerged from the “Videologging—QA Plan, Development, Implementation, and Analysis” project (Work Order 117) performed for PennDOT. The project was conducted at the Pennsylvania Transportation Institute (PTI).(2) In this project, a quality assurance (QA) plan was developed for PennDOT to monitor the collection of quality pavement condition data. In 1997, PennDOT replaced the manual method with a semiautomated method of pavement condition data collection. At that time, the distress definitions and decisionmaking methodologies were significantly altered, but PennDOT did not perform sensitivity analyses. Hence, as part of research under Work Order 117, detailed analyses were conducted to determine the impacts of individual distresses for the existing pavement conditions in Pennsylvania.
From the comprehensive literature review and the results of the sensitivity analysis, the team proposed the initial acceptance limits for pavement condition data. The acceptance limits are based on the PennDOT method of data collection. PennDOT contracts to vendors the digital imaging and interpretation of pavement distress. Control and acceptance will be performed with PennDOT’s own equipment and personnel, resulting in different equipment manufacturers, software, and raters. While the Long-Term Pavement Performance (LTPP) program methodologies differ, this paper verifies the acceptance limits by comparing the manual distress data with the Pavement Distress Analysis System (PADIAS 4.2) data, thus simulating the control of one data stream with the use of another, nonidentical distress data methodology.
The project team at PTI proposed initial acceptance limits for PennDOT pavement data collection. The limits were set based on the experts’ opinion and comprehensive literature review. The results from this paper will help PennDOT refine or broaden the limits, in combination with the first-year application of the methodology. Success by PennDOT may enable other agencies to establish formal acceptance methodologies for contracted pavement distress data collection.
This section documents a literature review of recent studies about the types of data, pavement data collection, and distress data variability.
Pavement condition data include surface distress and longitudinal profile data. Surface distresses in asphalt concrete include fatigue cracking, transverse cracking, longitudinal cracking, edge deterioration, raveling and weathering, bituminous patching, and rut depth. Surface distresses in jointed concrete pavements include transverse joint spalling, longitudinal joint spalling, longitudinal cracking, transverse cracking, bituminous patching, and concrete patching. Longitudinal profile data are collected for both asphalt concrete (AC) and jointed concrete pavements (JCP) to compute a parameter known as the International Roughness Index (IRI). While the QA plan developed for PennDOT also includes IRI, the analysis using LTPP data in this paper addresses surface distress only.
The methods of data collection for pavement surface distress can be categorized as manual, film-based, semiautomated (remote survey), and automated. For manual data collection, the pavement raters travel to each site and rate pavement distresses. The film-based method uses 35-millimeter (mm) black-and-white photography to obtain images of pavement test sections.(3) Both the manual and film-based methods are used in distress data collection for the Federal Highway Administration (FHWA) LTPP program. In a semiautomated method, the pavement images are collected digitally using a camera mounted on a van by a process sometimes called videologging and are visually rated. In a fully automated method, the images are collected and then rated automatically using crack detection software. Most State transportation agencies are shifting their methods of data collection from manual to semiautomated or automated for their network-level pavement management systems. Primary reasons for the change include safety and improved possibilities for consistency and quality control.
The variability of pavement condition data is an important factor to be considered in a pavement management system. Pavement condition data collected can include variability from a number of sources.(2) These sources include the following:
A study of LTTP distress data variability discussed the variability that affects the pavement condition data.(3) In that study, statistical analyses were performed to quantify the precision and bias between the raters by comparing with a reference value. The manual distress survey was compared with the PADIAS film-based survey. LTPP sections were rated by experts, individual raters, and teams. Statistical analyses were performed to determine the variability of the raters.
The following observations were made from that study:
In 1997, PennDOT replaced the manual method with a semiautomated method of pavement condition data collection in its network-level pavement management systems. PennDOT contracts out pavement data collection to vendors for its network-level pavement management systems. PennDOT currently contracts out pavement data collection to a private vendor. PennDOT and the vendor use different equipment and software for pavement condition data collection and rating.
The impacts of distress variability on pavement modeling and decisionmaking depend on the type of treatment methodology used by the agency. Therefore, the sensitivity analyses results were considered in developing the PennDOT QA plan.
Sensitivity analyses are generally defined as statistical studies to determine the sensitivity of a dependent variable to variations in independent variables over reasonable ranges. There are several reasons for doing sensitivity analysis of the treatment matrices. First, it shows the impact of a distress on determination of the final treatments for a pavement. It also helps to find out where to concentrate resources in the collection of quality pavement condition data. The IRI frequency ranges that represent most of the network conditions were used in the sensitivity analysis. The sensitivity analysis was used for the following:
Sensitivity analyses were performed on PennDOT’s treatment matrices, using roadway management system (RMS) 2001 data for both AC and JCP pavements. These analyses were performed in spreadsheets, using the treatment matrices.
Sensitivity Analysis for Asphalt Concrete Pavements
IRI frequency distributions were plotted for AC and JPC pavements. The IRI range for sensitivity analysis was selected by considering both the frequency in the network condition and the effects of IRI on the treatments. From the treatment matrices, for interstate pavements, for the value IRI>21, there is a trigger or an effect in the treatments; hence the IRI 121–160 that also has significant frequency was selected for the sensitivity analyses. To study the effect of IRI, sensitivity analyses were performed for IRI 81–120 and IRI 121–160 for interstates. For National Highway System (NHS) noninterstate, and non-NHS pavements, sensitivity analyses were done for the range IRI 121–160.
There were seven independent variables including IRI; the dependent variable for this analysis was the treatment result.
Sensitivity analysis was performed by keeping the following:
The sensitivity analyses were performed for all roadway categories and conditions (minimum to maximum, average to maximum, and average to maximum).
The results of the sensitivity analysis for asphalt concrete pavements are the following:
To illustrate how the sensitivities may differ from one highway type to another, the sensitivity analysis were performed for interstate, NHS noninterstate, and non-NHS pavements. The following are the results are:
Sensitivity Analysis for Jointed Concrete Pavements
Sensitivity analysis was performed for all types of highways under different annual average daily traffic (AADT) conditions using the PennDOT treatment matrices (5) for jointed concrete pavements. Sensitivity can be observed if there is any change in the treatments by varying the particular distress value to maximum or minimum from the average. For jointed concrete pavements, IRI 81–120 has the greatest percent frequency.(7) Only the data from this IRI 81–120 range was used for sensitivity analysis. There were eight independent variables or distresses.
The results of the sensitivity analysis for jointed concrete pavements are the following:
To illustrate how the sensitivities may differ from one highway type to another, the sensitivity analyses for interstate, NHS noninterstate, and non-NHS pavements were compared. As before, the transverse joint spalling and longitudinal joint spalling distresses play a major role in determining the final treatments. The following are the results:
The project team reviewed the literature, treatment results, sensitivity analyses results, and variability studies and developed the QA plan for PennDOT pavement data collection and rating. This plan was then modified for implementation by PennDOT. The following sections summarize the QA plan developed by the project team.
Control sections are used to determine the repeatability and reproducibility between the agency and vendor. The control sections should be selected so that the sections represent the network pavement condition distribution. The project team made the following recommendations to PennDOT:
For IRI, the repeatability for a single equipment/operator combination on immediately repeated runs on the same day should be less than plus or minus 5 percent, 95 percent of the time. Ten runs for each control site should be performed. The average for each equipment/operator combination should be within 3 percent of the reference value.
The repeatability should be less than plus or minus 5 percent on the extent of each rutting severity. Bias can be quantified using manual profiling measurements as the reference value. It is recommended that the bias on actual rut depth be less than plus or minus 15 percent.
The repeatability of each vendor and PennDOT rater should be within plus or minus 10 percent for each distress and severity combination. The average rating by each vendor and quality assurance rater should be within plus or minus 15 percent of the pooled average rating.
The project team recommended the use of blind verification sites in the PennDOT QA plan. About 100 segments should be selected based on geographic and anticipated pavement condition. Multiple runs and ratings should be performed by PennDOT before the vendor’s production schedule. The location of the segments should not be disclosed to the vendor. The vendor should provide the distress ratings and IRI of each blind verification site immediately upon the agency’s request. PennDOT should determine if the vendor’s reported values are within the 95 percent prediction interval from the repeated runs. The vendor should be informed immediately if the results are not within 95 percent confidence. Investigation and possible recalibration will then be necessary. The use of the blind verification sites provides timely and confident checks with tighter control limits, and also allows immediate corrections rather than ultimate rejection of entire deliverables.
Five percent of segments by highway types (interstate, NHS, and non-NHS) and by anticipated conditions should be selected based on stratified sampling by geographical distribution and anticipated condition. The anticipated conditions can be determined from the previous RMS (6) condition data.
A greater concentration of acceptance samples should be chosen near critical condition values. For example, for interstate, for both AC and JCP pavements, an IRI of 120 is the breakpoint between routine maintenance and major treatments. Therefore, the segments should be selected near these critical conditions. Figure 1 shows the recommended use of the statistical sampling plan for acceptance testing.
Table 1 shows the proposed initial values for acceptance criteria and recommended actions if these criteria are not met. These initial criteria and limits were taken from the literature review and from the suggestions of experienced members of the project team.
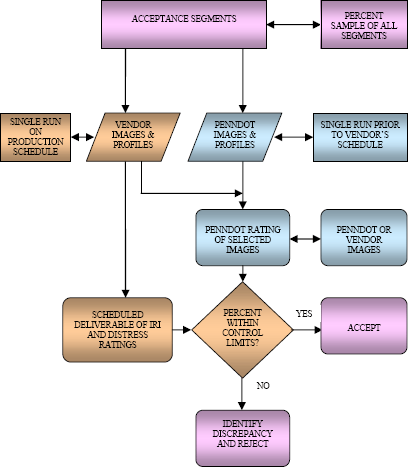
Figure 1. Recommended use of statistical sampling for acceptance testing of each deliverable.(2)
Table 1 shows the proposed initial values for acceptance criteria and recommended actions if these criteria are not met. These initial criteria and limits were taken from the literature review and from the suggestions of experienced members of the project team.
From the sensitivity analyses results, the project team developed three types of distress criteria for AC and JCP pavements. The individual distress and severity combinations are considered for both AC and JCP pavements. Total fatigue cracking is the sum of all severity level values (low, medium, and high severity). Other sensitive distresses (miscellaneous cracking, transverse cracking, and edge deterioration) are combined to obtain total nonfatigue cracking. For JCP pavements, total transverse cracking and total joint spalling (transverse and longitudinal joint spalling) are used as distress criteria for acceptance.
Rating results and IRI values for control sections should be checked for the initial criteria proposed in table 1. PennDOT will review the results for control sections and decide the final acceptance criteria for the production sites. Increasing or decreasing the proposed limits or percent within limits (PWL) should be considered by reviewing the control section results. If the control sections results are well within the proposed limits, then PennDOT may consider tightening the initial values to get the desired final acceptance criteria. However, PennDOT should not assume that the vendors may produce the same results for production sites. Therefore, before tightening the control limits, PennDOT may consider 1,000 segments of production site results to check whether the vendors are still producing results well within limits. If the variability for some distress is higher than expected, careful investigations should be performed to check if there are any outliers. If so, retraining of raters should be conducted to eliminate the outliers.
| Reported Value | Initial Criteria | Percent Within Limits (PWL) | Recommended Action if Criteria Not Met |
|---|---|---|---|
| IRI | +/- 25% | 95% | Reject deliverable. |
| Individual Distress Severity Combination | +/- 30% | 90% | Feedback on potential bias or drift in ratings. Retrain on definitions. |
| Total Fatigue Cracking | +/-20% | 90% | Reject deliverable. |
| Total Nonfatigue Cracking | +/-20% | 90% | Reject deliverable. |
| Total Joint Spalling | +/-20% | 90% | Reject deliverable. |
| Transverse Cracking, JCP | +/-20% | 90% | Reject deliverable. |
| Location Reference—Segment/Offset | Correct Segment | All | Return deliverable for correction. |
| Location Reference—Section Begin | +/- 10 feet | 95% | Return deliverable for correction and system check. |
| Panoramic Images | Legible signs | 80% | Report problem. Reject subsequent deliverables. |
The LTPP manual distress data were extracted from the DataPave Web site.(4) Table 2 shows the table names descriptions. Only the distress data that represent PennDOT distress type and severity were considered in the analysis. The survey dates for manual and PADIAS 4.2 were compared and only the data that were within 6 months’ difference between the two dates were considered.
| Table Name | IMS Module | Description |
|---|---|---|
| Mon_Dis_AC_Rev | Monitoring | AC Manual Distress Data Revised |
| Mon_Dis_JPCC_Rev | Monitoring | JPCC Manual Distress Data |
| Mon_Dis_PADIAS42_AC | Monitoring | AC PADIAS 4.2 Distress Data |
| Mon_Dis_PADIAS42_JPCC | Monitoring | JPCC PADIAS 4.2 Distress Data |
Manual distress data and PADIAS 4.2 data for all regions for GPS sections were extracted from the DataPave Web site. The LTPP distress data were categorized into different types, as shown in table 3. The total fatigue cracking is in length for PennDOT and it is in area for LTPP. PennDOT considers longitudinal cracking between wheelpaths as the only longitudinal cracking; LTPP considers longitudinal cracking wheelpath, nonwheelpath, sealed, and unsealed as longitudinal cracking. The LTPP data for analysis were selected to approximate the PennDOT distress types.
The minimum and maximum manual distress values (for example, for total fatigue cracking, minus 20 percent, and plus 20 percent of the manual distress values) were calculated and compared with the PADIAS 4.2 distress values. For example, in figures 2 and 3, “1” represents “within limits” and “-1” represents “not within limits.” In agreement with findings that the variability increases as the quantity of the distress increases, only lower values meet the criteria proposed in table 1.(3)
| Pavement Type | PennDOT Distress Type | Corresponding LTPP Distress | Comments |
|---|---|---|---|
| AC | Total fatigue cracking, in length: (low+medium+high) severity | Total fatigue cracking, in area (L+M+H) | PennDOT considers longitudinal wheelpath cracking as low-severity fatigue cracking. |
| Total nonfatigue cracking: miscellaneous cracking (longitudinal cracking between wheelpath), transverse cracking, edge deterioration | Longitudinal cracking (sealed, WP, NWP, reflection cracking), transverse cracking (sealed, reflection cracking) | ||
| JPC | Total joint spalling: (transverse joint spalling and longitudinal joint spalling) | In PennDOT rating manual, sealed cracks are considered as low transverse cracking. | |
| Total transverse cracking | Total transverse cracking (transverse cracking + transverse cracking sealed) | ||
| Total longitudinal cracking | Total longitudinal cracking (sealed) |
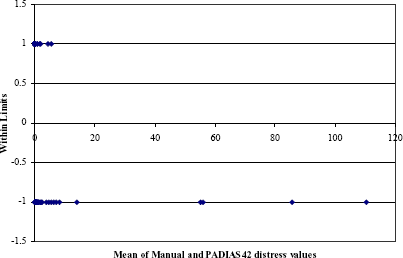
Figure 2. Within limits, total joint spalling, all regions, 1–yes, -1–no.
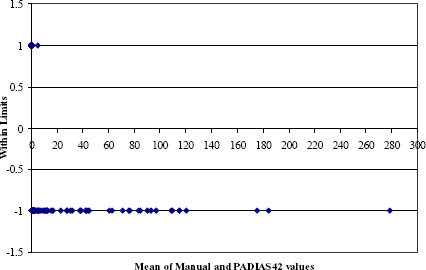
Figure 3. Within initial limits, total fatigue cracking, all regions, 1–yes, -1–no.
Figures 4 to 7 show the PWL for all regions for both AC and JPC pavements for the initial criteria proposed in table 1. The PennDOT acceptance limits were developed based on the semiautomated method (videologging). The PADIAS 4.2 distress survey method showed significant variation in low-severity cracking when compared to manual surveys. There may not be as much variation between the two semiautomated systems used by PennDOT and its vendor, as both systems are of similar resolution and are more likely to distinguish similar quantities of low-severity cracking. Therefore, only medium and high severities were considered for this comparison.
Figure 4 shows the PWL with all severities for all regions and figure 5 shows the PWL with only medium and high severities. From these figures, it is clear that after excluding low severity, the PWL has increased significantly. Because the PWL was less, the low-severity fatigue cracking was not included in the total fatigue cracking and checked for PWL. There was a significant increase in PWL after removing the low severities for all distresses.
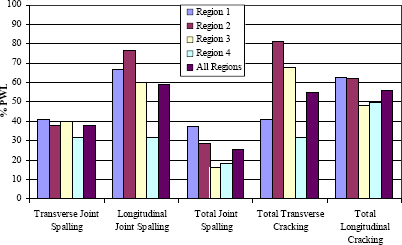
Figure 4. Percent within limits, all regions, GPS sections, JPC pavements (all severities).
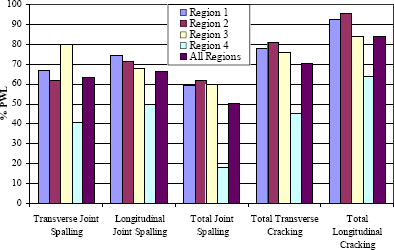
Figure 5. Percent within limits, all regions, GPS sections, JPC pavements (medium and high severities).
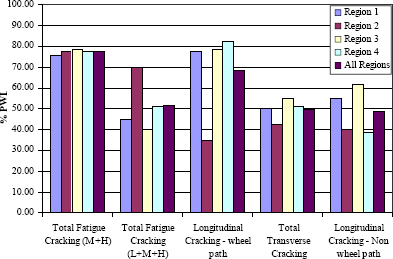
Figure 6. Percent within limits, all regions, GPS sections, individual distresses, AC pavements.
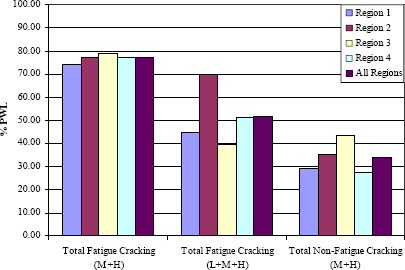
Figure 7. Percent within limits, all regions, GPS sections, total distress values, AC pavements.
From the results above, it is clear that the most of the data are not within limits. This may occur for PennDOT pavement data collection; on the other hand, PennDOT data variability may be less than for PADIAS 4.2 survey data. As the control sites and initial blind verification and acceptance segments are tested, PennDOT may consider increasing the initial criteria or decreasing the PWL or both to achieve the reasonable acceptance data.
Therefore, the initial criteria were increased to plus or minus 40 percent as a trial. There was no significant increase in PWL values. This implies that when a difference occurs, it is typically a very large difference. Another approach would be to decrease the minimum PWL required for each criterion. PWL was still less than 80 percent for all distress types, except longitudinal cracking in jointed portland cement concrete (JPCC). This can be illustrated by figure 8 and table 4. Figure 8 shows the PWL for AC pavements for all regions and table 4 shows the PWL and initial criteria for JPCC pavements for all regions.
Therefore, an agency must consider carefully the impact on its decision methodology of having over 20 percent of the data variable by a high amount. The initial criteria proposed for PennDOT may be modified by either changing the limits or the PWL values. However, the impacts of the modifications on pavement management outcomes must be carefully considered.
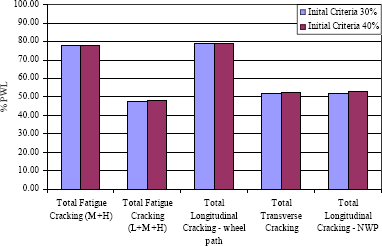
Figure 8. PWL for limits 20 percent and 40 percent, AC, all regions.
| Distress Type | Initial Trial | Revised Trial | ||
|---|---|---|---|---|
| Criteria (limits) | PWL | Criteria (limits) | PWL | |
| Transverse Joint Spalling | 30% | 63% | 40% | 63% |
| Longitudinal Joint Spalling | 30% | 66% | 40% | 67% |
| Total Joint Spalling | 20% | 51% | 40% | 53% |
| Total Transverse Cracking | 30% | 71% | 40% | 72% |
| Total Longitudinal Cracking | 30% | 84% | 40% | 85% |
Federal Highway Administration, Long-Term Pavement Performance Program, at https://www.fhwa.dot.gov/pavement/ltpp/.
Stoffels, S., Ganesan, V., Morian, D., Antle, C., and Sinha, S.K. (2003). Videologging QA—Development, Implementation and Analysis. Pennsylvania Transportation Institute Internal Report. Pennsylvania Transportation Institute, University Park, PA.
Rada, G.R., Wu, C.L., Bhandari, R.K., Shekharan, A.R., Elkins, G.E., and Miller, J.S. (1999). Study of LTPP Distress Data Variability. FHWA-RD-99-074. Federal Highway Administration, Washington, DC.
Federal Highway Administration, DataPave Online, Long-Term Pavement Performance Program, at http://www.datapave.com.
Pennsylvania Department of Transportation. Pennsylvania Department of Transportation Treatment Matrices Manual. Roadway Management Division, Bureau of Maintenance and Operations, Pennsylvania Department of Transportation, Harrisburg, PA.
Pennsylvania Department of Transportation. Automated Pavement Condition Surveying Field Manual. Publication 336-2002. Roadway Management Division, Bureau of Maintenance and Operations, Pennsylvania Department of Transportation, Harrisburg, PA.
Ganesan, V., (2003). Impacts of Pavement Condition Data Variability on State Agency Pavement Management Decisions, Masters Thesis, Pennsylvania State University, PA.
Anderson, D.A., Luhr, D.R., and Antle, C.E. (1990). Framework for Development of Performance-Related Specifications for Hot-Mix Asphaltic Concrete. National Cooperative Highway Research Program Report 332. Transportation Research Board, Washington, DC.
Daleiden, J.F., and Simpson, A.L. (1998). “‘Off-the-Wall’ Pavement Distress Variability Study.” Transportation Research Record 1643. Transportation Research Board, Washington, DC, 62–70.
Evans, D.L., and Eltahan, A. (2000). LTPP Profile Variability. FHWA-RD-00-113. Federal Highway Administration, Washington, DC.
Federal Highway Administration. (1996). Long-Term Pavement Performance Program Reference Guide: Version 1.0. Pavement Performance Division, Federal Highway Administration, Washington, DC.
Hadley, W.O. (1994). SHRP-LTTP Data Analysis Studies: Five Year Report. Strategic Highway Research Program, Federal Highway Administration, Washington, DC.
Huang, H.Y. (1993). Pavement Analysis and Design. Upper Saddle River, NJ: Prentice Hall, Inc.
Marshall, H.E. (1999). "Sensitivity Analysis." In R.C. Dorf (Ed.) The Technology Management Handbook (8-59 and 8 63). Boca Raton, FL: CRC Press.
Morian, D., Stoffels, S., and Frith, D. (2002). “Quality Management of Pavement Performance Data.” Proceedings of the Pavement Evaluation 2002 Conference, Roanoke, VA.
Rada, G.R., Wu, C.L., Elkins, G.E., Bhandari, R.K., and Bellinger, W.Y. (1998). “Update of Long-Term Pavement Performance Manual Distress Data Variability: Bias and Precision.” Transportation Research Record 164. Transportation Research Board, Washington, DC, 71–79.
Stoffels, S., Morian, D., Larsen, D., and Frith, D. (2001). “Quality Analysis Methods for Pavement Distress Data,” Transportation Research Board Annual Meeting presentation. Transportation Research Board, Washington, DC.