U.S. Department of Transportation
Federal Highway Administration
1200 New Jersey Avenue, SE
Washington, DC 20590
202-366-4000
Federal Highway Administration Research and Technology
Coordinating, Developing, and Delivering Highway Transportation Innovations
 |
| This report is an archived publication and may contain dated technical, contact, and link information |
|
Publication Number: FHWA-HRT-06-109 Date: September 2006 |
James T. Smith, B.A.Sc.
University of Waterloo
Waterloo, Ontario, Canada,
Faculty Advisor
Susan L. Tighe, Ph.D., P.E.
University of Waterloo
Waterloo, Ontario, Canada
This paper studies asphalt pavement overlay performance in the Canadian environment. It investigates the impact of asphalt overlay thickness, climatic zone, and subgrade type on the progression of roughness as described by the International Roughness Index (IRI). Data from the Canadian Long-Term Pavement Performance (LTPP) program test sites were analyzed. Through the investigation, pavement factors that significantly impact overlay performance in the Canadian environment can be identified.
Data collected over the first 13 years of study were used to show national and provincial roughness trends from 53 test sites. The IRI data were statistically summarized (mean, standard deviation) for each category by the age of the overlay section. Using the summarized data, regression analysis was used to determine an equation that best describes the progression of roughness. Two-factor analysis of variance was used to determine any significant differences within specific categories. The results of the regression analysis were compared to the Canadian Strategic Highway Research Program (C–SHRP) LTPP data to confirm the validity of the roughness progression equations.
Results show that overlay thickness and climatic zones significantly impact roughness, while subgrade type has little influence on the IRI values. The roughness progression equations achieved squared correlation coefficients (R2) between 0.93 and 0.39, demonstrating the accuracy of the model equations.
In 1987, as part of a comprehensive 20-year study of inservice pavements, the Long-Term Pavement Performance (LTPP) program was initiated. The purpose of this program was to develop an understanding of why some pavements perform better than others and how to maintain a cost-effective highway system.(1) The LTPP program monitors 107 test sections in Canada. At each site, data on distress, roughness, structural capacity, traffic, and other pavement performance measures were collected.
The individual test sites are identified by a climatic zone, overlay thickness, and subgrade. Figure 1 and Table 1 shows the distribution and identification numbers of the 53 test sites in the LTPP study that have overlays and are included in the data analysis for this paper.
The International Roughness Index (IRI) is a measurement scale to evaluate pavement roughness. The index is based on the result from a response-type road roughness measuring system (RTRRMS) to the longitudinal profile of the road surface. The profile captures the movement between the axle and vehicle body in response to the motion of the vehicle traveling down the pavement surface at 80 kilometers per hour (km/h).(2)
IRI is measured in units of meters per kilometer (m/km). An absolutely perfect pavement profile, one with no vertical displacements, has an IRI value equal to 0 m/km. As the index value increases, the smoothness of the road decreases. There is no maximum limit to the scale; however, IRI values greater than 8 m/km are classified as damaged pavements or rough, unpaved roads. At an IRI value greater than 2.15 m/km, pavements are in poor condition and become uncomfortable at speeds greater than 80 km/h.
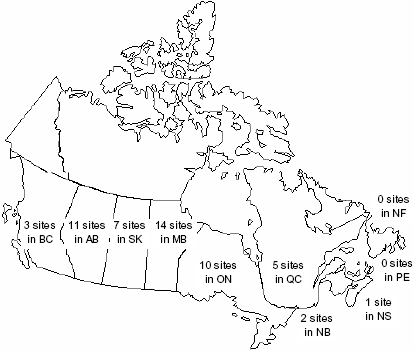
Figure 1. Distribution of LTPP test sites.
| BC | AB | SK | MB | ON | QC | NB | PE | NS | NF |
|---|---|---|---|---|---|---|---|---|---|
| 82-1005 | 81-502 | 90-6405 | 83-502 | 87-1620 | 89-1021 | 84-1684 | 86-6802 | ||
| 82-6006 | 81-503 | 90-6410 | 83-503 | 87-1622 | 89-1125 | 84-6804 | |||
| 82-6007 | 81-504 | 90-6412 | 83-504 | 87-1680 | 89-1127 | ||||
| 81-505 | 90-6420 | 83-505 | 87-1806 | 89-9018 | |||||
| 81-506 | 90-6801 | 83-506 | 87-2811 | 89-A310 | |||||
| 81-507 | 90-A310 | 83-507 | 87-2812 | ||||||
| 81-508 | 90-B310 | 83-508 | 87-A310 | ||||||
| 81-509 | 83-509 | 87-A311 | |||||||
| 81-1804 | 83-3802 | 87-B310 | |||||||
| 81-1895 | 83-6450 | 87-B311 | |||||||
| 81-8529 | 83-6451 | ||||||||
| 83-6452 | |||||||||
| 83-6454 | |||||||||
| 83-A310 |
This paper analyzes the relationship between pavement performance measured by IRI and the age of the asphalt pavement overlay. All data used in the analysis was extracted from the LTPP Information Management System’s DataPave Online Release 15.
Based on this extraction, the following analysis was carried out:
Overall, the paper is directed at determining the pavement factors with the most significant impact on overlay performance in the Canadian environment.
Pavement roughness is the primary measure most transportation agencies use to establish the need for rehabilitation. Pavement roughness affects driving comfort, vehicle operating costs, and safety.(3) ASTM International (originally known as the American Society for Testing and Materials) defines pavement roughness as “the deviation of the surface from a true planar surface with characteristic dimensions that affect vehicle dynamic, ride quality, dynamic loads, and drainage.”
Two-way analysis of variance (ANOVA) was used to compare population means based on a simple random sample (SRS). Each population is assumed to be normal, possibly with different means and the same standard deviation. ANOVA separates the total variation of the data into variation between group means and variation within groups. The null hypothesis (Ho) states that the population means are equal. The alternative hypothesis (Ha) is true if there is any difference between the population means. If the variation between groups is large compared to the variation within the groups, there is evidence against the null hypothesis.(4)
Analysis was conducted using a four-step process:
Figure 2 is a boxplot that shows the national roughness trend from 1989 to 2002 for all Canadian test site overlays in the LTPP program. For each year, six measures are used to describe roughness. Minimum and maximum IRI values are used to illustrate the best and worst performing test sections. The mean and median are also given to describe the IRI distribution. The first and third quartiles, which capture 50 percent of the test population, are provided to show the divergence of IRI values from the median value.
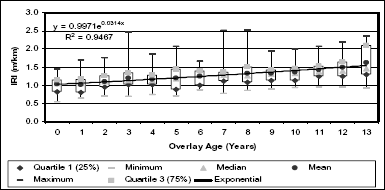
Figure 2. National IRI trends.
Figure 2 shows an increase in the overlay roughness during the study period. Over the period, the average IRI measured increased from 1.031 m/km to 1.630 m/km, representing a pavement that is still smooth and functioning properly. The difference between the first and third quartiles remained fairly constant, approximately 0.4 m/km. National roughness progression is best explained using an exponential regression, as shown by equation 1, and accurately predicts the LTPP IRI data as evidence of the squared correlation coefficient (R2) equal to 0.9467. Using an IRI trigger level of 2.15 m/km for maintenance, rehabilitation, and reconstruction (MR&R), the average lifespan for overlays in Canada is 25 years. Note that all factors have been aggregated in this analysis. However, the results show that overlays can provide good performance.
![]() (1)
(1)
Figure 3 shows the boxplot roughness trends for the province of Ontario. There are 6 sites and 10 test sections included in this analysis.
The provincial roughness trend shows a constant increase in the average IRI value similar to the national roughness trend. The average IRI changed from 1.076 m/km to 1.852 m/km in 8 years. The difference between the first and third quartiles did not remain constant over the study period, varying between 0.055 m/km to 0.676. Ontario roughness progression is best explained using an exponential regression equation shown by equation 2. The high R2 value of 0.9195 shows that equation 2 accurately predicts the LTPP IRI data. An overlay in the province of Ontario has a useful life of approximately 12 years. This significantly lower service life compared to the national value could be attributed to Ontario’s high traffic loads and extreme climate. Both factors could result in decreased service life because of traffic- and environment-related distresses.
![]() (2)
(2)
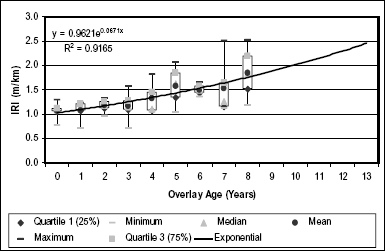
Figure 3. Ontario IRI trends.
Overlay thickness is a primary consideration for pavement designers. Figure 4 illustrates the effects of overlay thickness on the progression of roughness. The overlays were divided into three categories, thin (30 to 60 mm), medium (60 to 100 mm), and thick (100 to 185 mm). Overall, this resulted in six thin overlays, two medium overlays, and three thick overlays.
During the first 8 years, the thin overlay had the greatest increase in roughness, while the changes for moderate and thick overlays remained almost identical. After the eighth year, the deterioration rate for the moderate overlay thickness was accelerated while the thick overlay increased gradually. Table 2 presents the results of the regression analysis and approximate lifespan of the overlay for all three overlay categories.
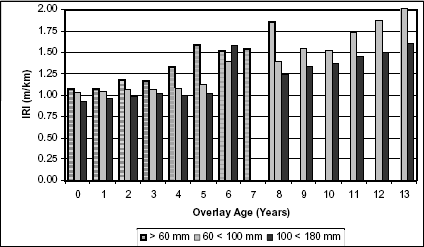
Figure 4. Effect of overlay thickness on roughness progression in wet-freeze climatic zones with fine-grained subgrades.
As the thickness of the overlay increases, the structural capacity of the pavement increases. This allows the pavement to resist deterioration and produce lower roughness values. The results must be interpreted with caution, however, because thickness cannot increase indefinitely. Correct compaction cannot be achieved if the overlay thickness becomes excessive, resulting in accelerated roughness progression due to early failure of the pavement structure.
| Pavement Class | Regression Equation | R2 | NOBS. | Life (Years) |
|---|---|---|---|---|
| Wet-freeze / Fine grained / Thin | y = 0.0059x2 + 0.033x + 1.0147 | 0.9124 | 41 | 12 |
| Wet-freeze / Fine grained / Medium | y = 0.0059x2 + 0.033x + 1.0147 | 0.9719 | 25 | 16 |
| Wet-freeze / Fine grained / Thick | y = 0.8732e0.0429x | 0.7949 | 37 | 21 |
A two-factor ANOVA analysis conducted at an a level of 0.05 or 95 percent showed a significant change in the IRI values over time for all overlay thicknesses. The results from the ANOVA analysis are presented in table 3.
| Overlay Thickness | df | FCalculated | FCritical | Significant |
|---|---|---|---|---|
| Thin and Medium | 1,6 | 7.74 | 5.99 | Yes |
| Thin and Thick | 1,5 | 13.66 | 6.61 | Yes |
| Medium and Thick | 1,12 | 12.62 | 4.75 | Yes |
The three climatic zones presented on the LTPP sites are wet-freeze (WF), wet-no freeze (WNF), and dry-freeze (DF). This analysis is intended to isolate the impact of climatic zone on performance. Overall, this resulted in 10 wet-freeze climatic zones, 2 wet-no freeze climatic zones, and 2 dry-freeze climatic zones. Figure 5 presents the relationship between climatic zone and roughness progression.
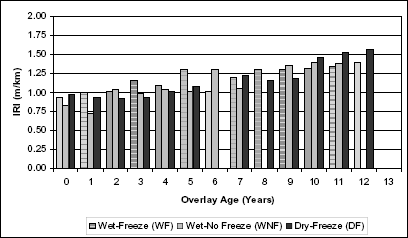
Figure 5. Effect of climatic zone on roughness progression in thin overlays with coarse-grained subgrades.
The roughness values varied widely from one year to another. This is possibly explained by the time of year the roughness data were collected. However, regardless of the time of year, dry-freeze zones exhibited the poorest performance in this study. Table 4 presents the results of the regression analysis and approximate lifespan of the overlay for the three climatic zone categories.
Roughness progression is accelerated by freeze-thaw effects and trapped water. This effect is shown by the wet-no freeze zone being the best performing zone. The presence of water did not affect roughness progression because it does not freeze in this zone and cause additional stress to and deterioration of the pavement structure.
| Pavement Class | Regression Equation | R2 | NOBS. | Life (Years) |
|---|---|---|---|---|
| Wet-freeze / Coarse grained / Thin | y = 0.0355x + 0.9319 | 0.7789 | 72 | 34 |
| Wet-no freeze / Coarse grained / Thin | y = -0.0007x2 + 0.0651x + 0.7301 | 0.8218 | 17 | 35 |
| Dry-freeze / Coarse grained / Thin | y = 0.0050x2 - 0.0156x + 0.9474 | 0.9475 | 22 | 18 |
A two-factor ANOVA was performed to determine if the differences between the climatic zones for thin overlays on coarse-grained subgrade were statistically significant. Two-factor ANOVA analysis conducted at an a level of 0.05 showed a significant change in the IRI values over time between the wet-freeze and wet-no freeze, dry-freeze and wet-freeze climatic zones. The difference between the wet-no freeze and dry-freeze climatic zones is not statistically significant. The results from the ANOVA analysis are presented in table 5.
| Climatic Zone | df | FCalculated | FCritical | Significant |
|---|---|---|---|---|
| Wet-freeze and Wet-no freeze | 1,5 | 8.13 | 6.61 | Yes |
| Wet-freeze and Dry-freeze | 1,5 | 7.19 | 6.61 | Yes |
| Wet-no freeze and Dry-freeze | 1,9 | 0.81 | 5.12 | No |
The next analysis in this research focused on examining subgrade type on pavement performance. Two categories of subgrade were used, coarse and fine. Coarse-grained subgrades are composed of sands and gravels, whereas fine-grained subgrades are composed of silts and clays.(5) Overall, this resulted in two fine-grained subgrades and four coarse-grained subgrades. Figure 6 compares the effect that the roadway subgrade has on the progression of roughness.
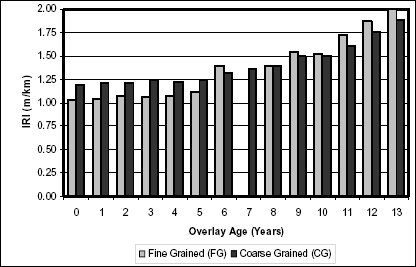
Figure 6. Effect of subgrade type on roughness progression in medium overlays with wet-freeze climatic zones.
The progression of roughness for both coarse and fine subgrades is similar. During the first 8 years, the overlay with fine-grained subgrades preformed better than coarse-grained subgrades. This trend was reversed during the second half of the life cycle. Table 6 presents the results of the regression analysis and approximate lifespan of the overlay for the two subgrade categories.
| Pavement Class | Regression Equation | R2 | NOBS. | Life (Years) |
|---|---|---|---|---|
| Wet-freeze / Fine grained / Medium | y = 0.0054x2 - 0.0061x + 1.0273 | 0.9719 | 25 | 15 |
| Wet-freeze / Coarse grained / Medium | y = 0.0050x2 - 0.0254x + 1.2357 | 0.9862 | 41 | 17 |
Although the effect of subgrade type produced similar results for pavements in a wet-freeze climatic zone and with medium overlay thickness, special attention must be made to match the subgrade to the environmental conditions. Pavements in areas susceptible to frost should avoid fine-grained subgrades because of the problems associated with continuous freeze-thaw effects.
Two-factor ANOVA analysis conducted at an a level of 0.05 showed no significant change in the IRI values over time when comparing coarse- and fine-grained subgrades. The results from the ANOVA analysis are presented in table 7.
| Subgrade Type | df | FCalculated | FCritical | Significant |
|---|---|---|---|---|
| Fine grained and Coarse grained | 1,12 | 0.87 | 4.75 | No |
The Canadian Strategic Highway Research Program (C–SHRP) LTPP program began in 1989, 2 years after the start of the LTPP program. The goal of the C–SHRP LTPP experiment was to build on the LTPP program, focusing on inservice pavement performance of rehabilitated pavements over 15 years at the national and provincial levels.(6)
The roughness deterioration equations from the LTPP study were validated by comparing them to the roughness data taken from the C–SRHP LTPP study and the R2 calculated.(7)
Figure 7 presents the comparison between the two LTPP studies for thin overlays in a wet-freeze fine-grained subgrade. The second-degree polynomial regression equation accurately predicts the C–SHRP roughness deterioration with a R2 of 0.9346.
![]() (3)
(3)
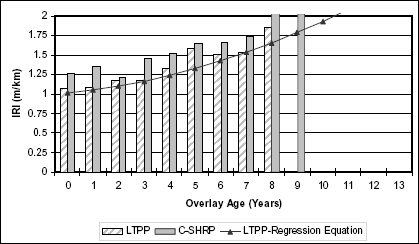
Figure 7. Roughness progression of thin overlays in wet-freeze climatic zones with fine-grained subgrades.
Figure 8 illustrates the comparison between the two LTPP studies for moderate overlays in a wet-freeze fine-grained subgrade. The second-degree polynomial regression equation accurately predicts the C–SHRP roughness deterioration with a R2 of 0.7676.
![]() (4)
(4)
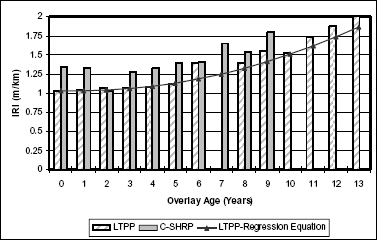
Figure 8. Roughness progression of medium overlays in wet-freeze climatic zones with fine-grained subgrades.
Figure 9 shows the comparison between the two LTPP studies for moderate overlays in a wet-freeze fine-grained subgrade. The second-degree polynomial regression equation moderately predicts the C–SHRP roughness deterioration with a R2 of 0.3879.
![]() (5)
(5)
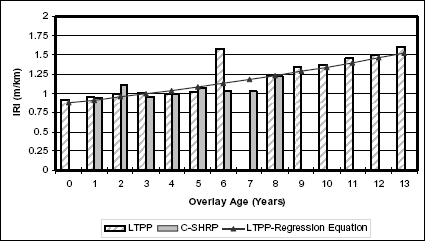
Figure 9. roughness progression of thick overlays in wet-freeze climatic zones with fine-grained subgrades.
The LTPP experiment data represents only the first 13 years of testing. The major conclusions and findings to date can be summarized as follows:
This study gives an initial look at the performance of overlay roughness for Canadian LTPP test sites. Further study would be beneficial in the following areas:
Federal Highway Administration. (2003). DataPave Online, Long-Term Pavement Performance Program, at http://www.datapave.com.
Sayers, M.W., Gillespie, T.D., and Patterson, W.D. (1986). Guidelines for the Conduct and Calibration of Road Roughness Measurement. World Bank Technical Paper 46. The World Bank, Washington, DC.
Transportation Association of Canada. (1997). Pavement Design and Management Guide. Ottawa, Canada.
Moore, D., and McCabe, G. (1996). Introduction to the Practice of Statistics (2nd ed.). New York: W.H. Freeman & Co.
Craig, R.F. (1997). Craig’s Soil Mechanics (6th ed.). New York: E & FN Spon.
Tighe, S., Haas, R., and Li, N. (2001). Overlay Performance in the Canadian Strategic Highway Program’s LTPP Study. Transportation Research Board, Washington, DC.
Haas, R., Li, N., and Tighe, S. (1999). Roughness Trends at C–SHRP LTPP Sites. Canadian Strategic Highway Research Program, Ottawa, Canada.

