U.S. Department of Transportation
Federal Highway Administration
1200 New Jersey Avenue, SE
Washington, DC 20590
202-366-4000
Federal Highway Administration Research and Technology
Coordinating, Developing, and Delivering Highway Transportation Innovations
 |
| This report is an archived publication and may contain dated technical, contact, and link information |
|
Publication Number: FHWA-RD-07-052 Date: September 2007 |
1.1 General
This LTPP program protocol describes procedures for determination of Creep Compliance, Resilient Modulus (Mr), and Strength of hot-mix asphalt concrete (HMAC) using indirect tensile test techniques. This protocol is partially based on test standards AASHTO TP9-94 (Edition 1B), ASTM D4123, and the procedures outlined in Section 4.4 (Roque et al.) of this protocol.
This protocol describes three distinct procedures for the determination of (1) creep compliance, (2) resilient modulus, and (3) tensile strength. This procedure requires three test specimens obtained from the same general area of the pavement test section. Each specimen is subject to creep compliance at -10, 5, and 25°C (14, 41, and 77°F), resilient modulus determinations at 5, 25, and 40°C (41, 77, and 104°F) and a strength test at 25°C (77°F). Therefore, three replicate test results are obtained for each specimen set.
The methods described are only applicable to core samples from hot mix asphalt (HMA) pavement layers. For LTPP, samples tested under this procedure are nominally 100-mm (4-in) core samples. It should be noted that this test procedure could be adapted for use with 150-mm (6-in) diameter specimens or laboratory compacted specimens. However for LTPP purposes, testing is restricted to the above criteria.
1.2 Summary of Test Method
1.2.1 Creep Compliance - The tensile creep compliance is determined by applying a static compressive load of fixed magnitude along the diametral axis of a cylindrical specimen. The resulting horizontal and vertical deformations measured near the center of the specimen are used to calculate tensile creep compliance as a function of time. Loads are selected to keep the material's response in the linear viscoelastic (LVE) range. This is accomplished by keeping horizontal deformations below 0.089 mm (0.0035 in).[1] Horizontal and vertical deformations are measured in the central region of the specimen, away from the localized stress concentrations caused by the loading conditions. The creep compliance test is performed on each specimen at temperatures of -10, 5, and 25°C (14, 41, and 77°F).
1.2.2 Resilient Modulus - A cyclic stress of fixed amplitude, with a duration of 0.1 seconds followed by a rest period of 0.9 seconds, is applied to the test specimen. During testing the specimen is subjected to a dynamic cyclic stress and a constant stress (seating load). Loads are selected to keep horizontal deformations between 0.038 and 0.089 mm (0.0015 and 0.0035 in)[2]. The deformation responses of the specimen are measured near the center of the specimen and used to calculate both an instantaneous and total resilient modulus (MRi and MRt respectively). Instantaneous resilient modulus is calculated using the recoverable horizontal deformation that occurs during the unloading portion of one load-unload cycle. Total resilient modulus is calculated using the total recoverable deformation, which includes both the instantaneous recoverable and the time-dependent continuing recoverable deformation during the unload or rest-period portion of one cycle. The resilient modulus test is performed on each specimen at temperatures of 5, 25, and 40°C (41, 77 and 104°F).
1.2.3 Tensile Strength - The tensile strength is determined by loading the specimen along its diametral axis at a fixed deformation rate until failure occurs. Failure is defined as the point after which the load no longer increases. The maximum load sustained by the specimen is used to calculate the indirect tensile strength. For LTPP testing, the point at which the first crack develops in the failure plane is also identified and recorded. This portion of the test procedure is performed at 25°C (77°F).
1.2.4 Testing Sequence - Each test specimen is tested in the following sequence:
1. Creep Compliance -10°C (14°F)
2. Resilient Modulus 5°C (41°F)
3. Creep Compliance 5°C (41°F)
4. Resilient Modulus 25°C (77°F)
5. Creep Compliance 25°C (77°F)
6. Resilient Modulus 40°C (104°F)
7. Tensile Strength 25°C (77°F)
1.3 Significance and Use
The values of creep compliance can be used as indicators of the relative quality of asphalt materials, as well as, to generate stiffness estimates for pavement design and evaluation models. The test can also be used to investigate the effects of temperature, load magnitude, and creep loading time on asphalt material properties.
When used in conjunction with other physical properties, the creep compliance can contribute to the overall mixture characterization and could well be a key factor for determining mixture suitability for use as a highway paving material under a variety of loading and environmental conditions.
The value of resilient modulus determined from this protocol procedure is a measure of the elastic modulus of HMA materials recognizing certain non-linear characteristics. Resilient modulus values can be used with structural response analysis models to calculate the pavement structural response to wheel loads, and with pavement design procedures to design pavement structures.
The resilient modulus test provides a means of characterizing pavement construction materials including surface, base, and subbase HMA materials under a variety of temperatures and stress states that simulate the conditions in a pavement subjected to moving wheel loads.
The indirect tensile strength test at 25oC (77°F) is used to determine the tensile strength, failure strain and the fracture energy of the specimens used for creep compliance and resilient modulus testing.
1.4 Sample Storage
Specimens of HMA materials for use in this testing shall be kept in an environmentally protected (enclosed area not subjected to the natural elements) storage area at temperatures between 5 and 24°C (40 and 75°F). Each specimen shall have a label or tag that clearly identifies the material, project number/test section from which it was recovered, and the sample number.
1.5 Units
In this protocol, the International System of Units (SI - The Modernized Metric System) is regarded as the standard. Units are expressed first in their "hard" metric form followed, in parenthesis, by their U.S. Customary unit equivalent.
2.1 Testing Prerequisites
This testing procedure shall be conducted after; (1) approval by the FHWA COTR to begin testing, (2) approval of Form L04 by the FHWA LTPP RCOC, (3) visual examination and thickness determination of AC cores and thickness determination of layers within AC cores using Protocol P01, (4) final layer assignment based on the P01 test results (corrected Form L04, if needed), and (5) bulk specific gravity testing of the specimens to be used for this testing have been completed according to Protocol P02. To attain approval under item (1), the laboratory must: (a) submit and obtain approval of the QC/QA plan for LTPP Protocol P07 testing, (b) demonstrate that their testing equipment meets or exceeds the specifications contained in this protocol, and (c) successfully complete all applicable requirements of the FHWA LTPP P07 Start-up and QC Procedure.
2.2 Sample Size
This testing shall be conducted on 102-mm (4-in) diameter asphalt concrete specimens that are between 25 (minimum) and 51 mm (maximum) (1.0 and 2.0 in) in thickness. The desired thickness for testing is 51 mm (2 in).
2.3 Test Core Locations and Assignment of Laboratory Test Numbers
This test shall be performed on specimens obtained from C-type, 102-mm (4-in) diameter core holes as dictated by the sampling plans for the particular LTPP section. The testing will be performed on asphalt layers with a thickness greater than 25 mm (1.0 in). Generally, samples are retrieved from the approach (stations 0+000m [0+00ft] -) and/or leave (stations 0+152m [5+00ft] +) ends of a test section but it is possible that for forensic or other studies specimens may be retrieved from within the pavement section. Test results shall be reported separately for samples obtained at the approach, within and leave end of the test section as follows:
If any of the test specimens obtained from the specified core locations are damaged or untestable, other cores within the same grouping and same layer that have not been identified for other testing can be substituted for this testing. Test specimens from one area (approach, within or leave) of an LTPP section may not be substituted for test specimens from another area. An appropriate comment code shall be used in reporting the test results and any specimen substitution.
The following definitions are used throughout this protocol:
(a) Layer: that part of the pavement produced with similar material and placed with similar equipment and techniques. The layer thickness can be equal to or less than the core thickness or length.
(b) Core: an intact cylindrical specimen of pavement materials which is removed from the pavement by drilling and sampling at the designated core location. A core may consist of, or include, one or more different layers.
(c) Test Specimen: that part of the layer which is used for, or in, the specified test. The thickness of the test specimen can be equal to or less than the layer thickness.
(d) Creep: the time-dependent part of strain resulting from stress. A typical load versus deformation graph for creep testing is shown in Figure 1.
Figure 1. Typical creep test
(e) Creep Compliance: the time-dependent strain divided by the applied stress.
(f) Poisson's Ratio, µ: the absolute value of the ratio of transverse strain to the corresponding axial strain resulting from uniformly distributed axial stress below the proportional limit of the material.
(g) Haversine Shaped Load Form: the required load pulse form for the resilient modulus portion of the P07 test. The load pulse is of the form [(1 - cos?)/2], and the cyclic load (Pcyclic) is varied from a seating load (Pcontact) to the maximum load (Pmax), as shown in Figure 2.
(h) Maximum Applied Load (Pmax): the maximum total load applied to the sample, including the contact and cyclic loads.
Pmax = Pcontact + Pcyclic
(i) Contact Load (Pcontact): the vertical load placed on the specimen in order to maintain contact between the loading strip and the specimen.
(j) Cyclic Load (Resilient Load, Pcyclic): load applied to a test specimen which is used to calculate the resilient modulus.
Pcyclic = Pmax - Pcontact
Figure 2. Definition of load pulse terms
(k) Instantaneous Resilient Modulus: determined from the deformation-time plots (both horizontal and vertical) using the instantaneous resilient deformation, obtained in the manner indicated in Figure 3 and described herein. For each cycle, two regression lines are used to determine the instantaneous and total deformations. The range for regression line 1 starts at the 5th point after the maximum deformation value and ends at the 17th point after the maximum deformation (13 points total). The range for regression line 2 includes the last 299 points of the cycle and the first point from the following cycle. For each cycle, the instantaneous deformation is calculated by subtracting the deformation value at the intersection of regression lines 1 and 2 from the maximum deformation. A typical deformation versus time graph for resilient modulus testing is shown in Figure 4.
(l) Total Resilient Modulus: determined from the deformation-time plots using the total resilient deformation, obtained in the manner indicated in Figure 3 and described herein. For each cycle, the total deformation is calculated by the deformation value of regression line 2 at the first point of the next cycle from the maximum deformation. This value includes both the instantaneous recoverable deformation and the time -dependent continuing recoverable deformation during the rest-period portion of one cycle.
Figure 3. Instantaneous and total resilient deformations
Figure 4. Typical resilient modulus test
(m) Tensile Strength: the strength shown by a specimen subjected to tension, as distinct from torsion, compression, or shear. A typical load versus deformation plot for indirect tensile strength testing is shown in Figure 5.
Figure 5. Typical indirect tensile test
4.1 LTPP Protocols
P01 Visual Examination and Thickness of Asphaltic Concrete Cores.
P02 Bulk Specific Gravity of Asphaltic Concrete.
4.2 AASHTO Standards
TP9-94 (Edition 1B) Standard Test Method for Determining the Creep Compliance and Strength of Hot Mix Asphalt (HMA) using the Indirect Tensile Test Device, September 1994.
4.3 ASTM Standards
D4123 Indirect Tension Test for Resilient Modulus of Bituminous Mixtures
4.4 Other
Evaluation of SHRP Indirect Tension Tester to Mitigate Cracking in Asphalt Concrete Pavements and Overlays, Roque, Reynaldo, et al. August 1997.
5.1 Loading Device
The testing machine shall be a top-loading, closed-loop, servo-hydraulic testing machine. The loading device shall be capable of providing a fixed or constant load with a resolution of at least 4.45N (1 lbf) and constant rate of ram displacement between 12 and 75 mm/minute (0.5-3 in/minute). The test machine should also be capable of applying a haversine shaped load pulse over the range of load durations, load levels, and rest periods described in this protocol (nominally 0.1 second in duration followed by a rest period of 0.9 seconds). The load frame should be capable of handling a minimum of 22,240 N (5,000 lbf).
5.2 Diametral Loading Heads and Specimen Restraint System
Diametral loading heads, equipped with concave steel loading strips having a radius of curvature equal to the nominal radius of the test specimen (nominally 102 mm [4 in]) are required to apply load to the specimen. The loading strip shall be 13 mm (0.5 in) wide. For LTPP testing purposes, the diametral loading heads and specimen restraint system is as specified in Appendix A (Test Equipment Specifications) of this protocol. Typical diametral loading heads are shown in Figure 6.
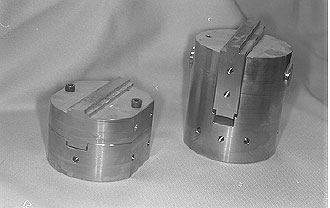
Figure 6. Typical loading heads
NOTE: The loading heads have been designed to be interchangeable so that either 102-mm (4-in) or 152-mm (6-in) diameter samples can be tested. The appropriate loading strip can be used by simply rotating the upper and lower loading platens 180 degrees. The upper loading platen was designed to rotate freely under load to accommodate specimens that are not perfectly cylindrical (e.g., field cores). The vertical plates on the lower loading head serve as a specimen restraint system. When the specimen is broken during the strength test, these plates keep the two halves from falling and reduce the potential for damage of the deformation measurement system. The specimen restraint system is adjustable to accommodate 102-mm (4-in) and 152-mm (6-in) diameter specimens. An aluminum block designed to align the upper and lower loading platens is shown in Appendix A of this protocol. This alignment unit is necessary because, unlike a typical resilient modulus loading frame that has the upper and lower loading platens permanently affixed, the upper and lower loading platens in this system are independent of each other. Therefore, this block was designed to align the upper and lower loading strips during initial installation and periodically to check and adjust the alignment.
5.3 Gauge Points
Eight gauge points are required per specimen. The gauge points must be magnetic (e.g., low carbon steel). Detailed specifications for the gauge points are contained in Appendix A. Typical gauge points are shown in Figure 7.
5.4 Contact Point Template
A template for marking the contact point where the loading heads would be perfectly aligned with the gauge points. Detailed specifications for this device are contained in Appendix A of this protocol with a typical contact point template shown in Figure 8.
5.5 Gauge Point Mounting System
A gauge point mounting system is required. This device is used to mount the gauge points precisely on cylindrical test specimens. Detailed specifications for this device are contained in Appendix A of this protocol. A typical gauge point mounting device is shown in Figure 9.
5.6 Temperature Control System
The temperature-control system should be capable of maintaining temperature control within ± 0.2°C (± 0.4°F) (measured near the center of the chamber), at settings ranging from -10 to 40°C (14 to 104°F). The system shall include a temperature-controlled cabinet large enough to house the diametral loading heads and specimen constraint system as well as three test specimens.
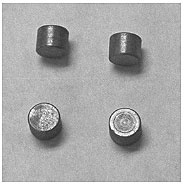
Figure 7. Typical gauge points
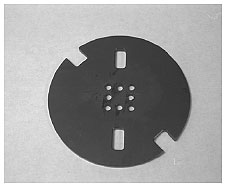
Figure 8. Typical contact point template
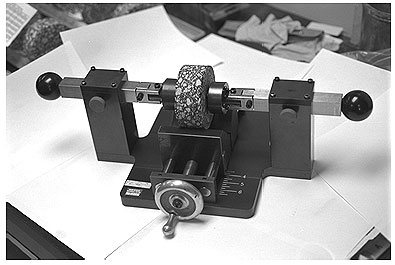
Figure 9. Typical gauge point mounting device
The chambers shall be capable of a minimum temperature change rate of ±15°C/hour (± 27°F/hour). A thermally sealed access port for thermocouple or electrical feed through is also required. In addition, it is preferred that the test chamber or an adjacent preconditioning chamber be large enough to house up to 25 test specimens during production testing operations.
5.7 Measurement and Recording System
The measuring and recording system shall include sensors for measuring and simultaneously recording horizontal and vertical deformations on both faces of the specimen and the load applied to the specimen. The system shall be capable of recording horizontal deformations with a resolution of 0.00025 mm (0.000010 in). The system shall also be capable of recording vertical deformations with a resolution of 0.0005 mm (0.000020 in). Load cells shall be accurately calibrated with a resolution of 5 N (1 lbf) or better. In all cases, the noise in the recording system should be less than the accuracy of the deformation measurement devices being used.
5.7.1 Recorder - The measuring or recording devices must provide real time deformation and load information and should be capable of monitoring readings at a minimum of 500 points/second. These parameters shall be recorded on an analog to digital or digital data acquisition system. The data acquisition system must be able to record time, temperature, load, and four deformation measurement devices.
5.7.2 Deformation Measurement - The values of vertical and horizontal deformation shall be measured with 25 mm (1 in) gauge point mounted extensometers with a full scale travel of 0.5 mm (0.02 in.). The extensometers must be capable of performing within the temperature range prescribed in this test procedure.
Extensometer Response Checks. The extensometers shall be calibrated every two weeks, or after every 50 resilient modulus tests, as per manufacturer specifications.
5.7.3 Load Measurement - The repetitive loads shall be measured with an electronic load cell with a capacity 22,000 N (5,000 lbf) and a sensitivity of ±5 N (± 1 lbf). The capacity of the load cell shall be matched as closely as possible to the expected testing load ranges to allow adequate feedback response, especially for haversine loading conditions.
During periods of resilient modulus testing, the load cell shall be monitored and checked once a month with a calibrated proving ring or independent load cell to assure that it is operating properly.
5.8 Specimen Sawing Apparatus
A specimen sawing device will be used to cut parallel, smooth and plane top and bottom faces for the asphalt cores. A water-cooled masonry saw has been found to perform this function adequately.
5.9 Humidity Cabinet
A chamber that can control to ± 5% relative humidity is necessary to condition specimens. This cabinet or chamber must be large enough to accommodate the number of specimens expected to be tested over 3 days.
5.10 Data Reduction and Analysis System
An automated data reduction and analysis system is necessary to process the data generated by this test procedure. Manual data reduction and analysis is possible but impractical. For LTPP testing, a series of software programs have been developed to process and analyze the data. Appendix B of this procedure outlines the algorithms used in data analysis.
6.1 General Specifications
Cores for test specimen preparation, which may contain one or more testable layers, must have smooth and uniform vertical (curved) surfaces. Cores that are obviously deformed or have any visible cracks must be rejected. Irregular top and bottom surfaces shall be trued up as necessary. Individual layer specimens shall be obtained by cutting with a water-cooled masonry saw.
Each specimen shall represent a single AC layer at one end of the test section. If the field core includes two or more different AC layers, the layers shall be separated at the layer interface by sawing. Any testable layers as identified in the P01 test (Form T01B) shall be separated. Layers that contain more than one lift of the same material placed under the same contract specification may be tested as a single specimen. The traffic direction symbol shall be marked on each layer after cutting to maintain the correct orientation. Layers too thin to test (less than 25 mm [1.0 in]), as well as any thin surface treatments, shall be removed and discarded.
All samples from a single area of the test section (before, within or end) that are candidates for this test shall be assembled, and the bulk specific gravity test results reviewed. Of this group of test candidates, the three specimens with the closest bulk specific gravities should be selected.
6.2 Specimen Thickness
The test specimens designated for MR testing shall be sawn from the appropriately numbered cores as described above in thickness no greater than 51 mm (2.0 in) in preparation for resilient modulus testing.
The desired thickness for testing is approximately 51 mm (2.0 in). If the thickness of a particular AC layer scheduled for testing is 76 mm (3.0 in) or more, then the 51-mm (2-in) specimen to be used for testing shall be obtained from the middle of the AC layer by sawing the specimen.
The thickness of each test specimen shall be measured to the nearest 0.25 mm (0.01 in) prior to testing. The thickness shall be determined by averaging four measurements located at quarter points around the sample perimeter, and 13 to 25 mm (0.5 to 1 in) in from the specimen edge.
6.3 Specimen Diameter
The diameter of each test specimen shall be determined prior to testing to the nearest 0.25 mm (0.01 in) by averaging diametral measurements. Measure the diameter of the specimen at mid-height along (1) the axis parallel to the direction of traffic and (2) the axis perpendicular (90 degrees) to the axis measured in (1) above. The measurements shall be averaged to determine the diameter of the test specimen. Core diameters shall be no less than 97.8 mm (3.85 in) or more than 105.4 mm (4.15 in).
6.4 Diametral Axis
Marking of the diametral axis to be tested shall be performed using the loading head contact template described in Appendix A. The axis shall be parallel to the traffic direction symbol (arrow) or "T" marked during the field coring operations. This diametral axis location can be rotated slightly, if necessary, to avoid contact of the loading strips with abnormally large aggregate particles or surface voids. Rotation of the test axis is also required if the surfaces to be loaded taper by more than 0.127 mm (0.005 in) from parallel.
6.5 Sample Preparation
Saw at least 6 mm (0.25 in) from both sides of each test specimen to provide smooth, parallel surfaces for mounting the measurement gauges. Measurements taken on cut faces yield more consistent results and gauge points can be attached more firmly. If the sample is too thin (less than 25 mm (1.0 in)) to accommodate the sawing operation, then the sawing operation is not performed.
Determine the bulk specific gravity of the specimen in accordance with LTPP Protocol P02 except that if the water absorbed by the specimen exceeds 2 percent, substitute a thin, adherent, water resistant plastic wrap membrane for the paraffin coating.
Specimens shall be stored in a cabinet at a constant relative humidity of 50 percent for 3 days prior to testing to ensure uniform moisture conditions.
Epoxy four gauge points to each flat face of the specimen (4 per face) using the gauge point mounting system. On each flat face of the specimen, two gauge points shall be placed along the vertical and two along the horizontal axes with a center to center spacing of 25.0 ± 0.2 mm (1.0 ± .1 in). The location of the gauge points on each face shall be identical. The gauge points shall be affixed to the specimen with suitable epoxy (e.g., "Zap-a-gap" has been used successfully). Figure 10 illustrates a specimen with gauge points mounted.
Mount the extensometers onto the test specimen, as shown in Figure 11.
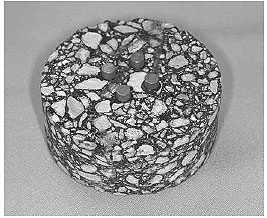
Figure 10. Asphalt specimen with gauge points mounted
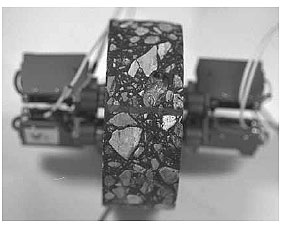
Figure 11. Asphalt specimen with extensometers mounted
7.1 General
The asphalt cores shall be placed in a controlled temperature cabinet/chamber and brought to the specified test temperature. Unless the core specimen temperature is monitored in some manner and the actual temperature is known, the core samples shall remain in the cabinet/chamber for a minimum of 24 hours prior to testing at 5°C (41°F) and 25°C (77°F). Specimens shall be held at 40°C (104°F) for a minimum of three hours, but not exceeding six hours, prior to testing. All specimens should be stored in an environment where the temperature is maintained between 5 and 21°C (40 and 70°F) until they are to be conditioned for testing.
Each specimen is tested in the following sequence:
Mount and center the deformation devices on the sample and zero or rebalance the electronic measurement system.
7.2 Alignment and Specimen Seating
At each temperature, insert the test specimen into the loading device and position it so that the load strip alignment mark on the test specimen lines up with the loading strips. The alignment of the front face of the specimen can be checked by insuring that the specimen load strip alignment markings are centered on the top and bottom loading strips. If necessary, the rear face of the specimen can be similarly aligned by using a mirror. A specimen mounted in the loading device is shown in Figure 12.
The contact surface between the specimen and each loading strip is critical for proper test results. Any projections or depressions in the specimen-to-strip contact surface which leave the loading strips in a non-contact condition over a length of more than 19 mm (0.75 in) shall be reason for rotating the test axis or rejecting the specimen. In instances where significant non-contact is suspected, machinists dye shall be used to check the specimen-to-strip contact area. If no suitable replacement specimen is available that meets this criteria, the test shall be conducted on the designated specimen. Code 39 shall be used to document this situation. Prior to performing the test procedure at a given temperature, the extensometers shall be stable. For resilient modulus and indirect tensile strength testing, stability is defined as the horizontal extensometers not drifting by more then 50 micro-strain over 100 seconds. Prior to performing creep compliance testing, stability is defined as the horizontal extensometers not drifting by more then 10 micro-strain over 100 seconds. If these tolerances are not met, it is an indication that the specimen has not stabilized at the test temperature.
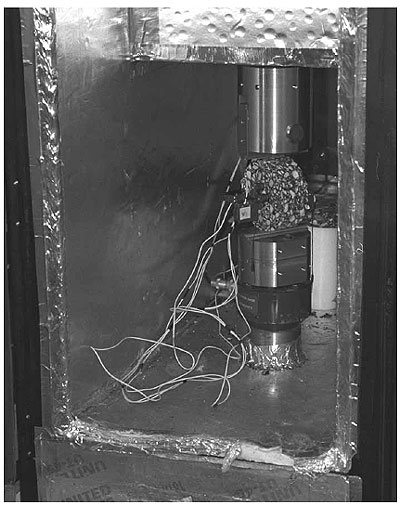
Figure 12. Specimen mounted in loading device
7.3 Creep Compliance Determination
After extensometer stability is achieved, apply a static load of fixed magnitude (± 2 percent), without impact to the specimen, that produces a horizontal deformation of 0.038 to 0.089 mm (0.0015 to 0.035 in) after 100 ± 2 sec. If either deformation limit is exceeded, stop the test and allow a minimum recovery time of 3 minutes before reloading at a different level. These limits prevent both non-linear response, characterized by exceeding the upper limit, and significant problems associated with noise and drift inherent in sensors when violating the lower strain limit. Collect data at 10 Hz. Return to the initial load level.
7.4 Resilient Modulus Determination
After stability is achieved, zero or rebalance the deformation measurement devices and apply a repeated haversine waveform load to the specimen with a period of 0.1 second followed by a rest period of 0.9 seconds. Use a load that produces a peak horizontal deformation between 0.038 and 0.089 mm (0.0015 and 0.0035 in). If the deformations fall outside these limits, stop the test and allow a minimum recovery time of 3 minutes before reloading at a different level. As explained previously, these limits prevent both non-linear response, characterized by exceeding the upper limit and significant problems associated with noise and drift inherent in sensors when violating the lower limit. Collect data at a uniform rate of 500 points per load cycle.
Once the appropriate load is achieved, testing may commence. The specimen shall be cycled (loaded and unloaded) until deformation and load data are obtained for a minimum of three load cycles. The response haversine waveform shall be matched as closely as possible to the command wave form by adjusting the feedback controls of the system.
7.5 Tensile Strength Determination
This test is only performed at 25°C (77°F) after all other testing is complete, as it will destroy the sample. After stability is achieved, zero the deformation measurement devices. Apply a load to the specimen at a constant rate of 50 mm (2 in) of ram displacement per minute. Record the vertical and horizontal displacement of the sample and the load until the load begins to decrease. Stop the test as soon as this occurs in order to prevent damage to the deformation measurement devices from a sudden failure of the specimen. Collect data at a rate of 2 Hz.
For the purposes of LTPP testing, data analysis and calculations are performed using software developed by Dr. Reynaldo Roque. The software used to perform these calculations is titled as follows: MRFHWA.EXE - used to calculate resilient modulus test results. ITLTFHWA.EXE - used to calculate creep compliance and indirect tensile test results. Documentation accompanying the software describes its use. In addition, Appendix B outlines the analysis methodology used by the software.
The report shall consist of a hard copy of Form T07, and electronic copies of all data files referenced on Form T07 submitted on an accompanying diskette.
9.1 Form T07 - Sample Summary Information
Form T07 contains general information about each test specimen. Fill out Form T07 as described below. Items 1 through 6 shall be the same for each specimen. Items 7 through 44 shall be filled out for each of the three specimens undergoing testing.
9.1.1 Item 1 - State Code
9.1.2 Item 2 - SHRP ID
9.1.3 Item 3 - Layer Number
9.1.4 Item 4 - Field Set
9.1.5 Item 5 - Test No (Generally all three specimens will have the same Test No. However space has been left to record the Test No for each specimen independently in case three adequate specimens with the same Test No were not provided to the lab.)
9.1.6 Item 6 - Sample Area (SPS sections only) (As with Test No, the Sample Area should be the same for all three specimens)
9.1.7 Item 7 - Location Number
9.1.8 Item 8 - LTPP Sample Number
9.1.9 Item 9 - Average Specimen Thickness, mm.
9.1.10 Item 10 - Average Specimen Diameter, mm.
9.1.11 Item 11 - Bulk Specific Gravity (from Test AC02).
9.1.12 Item 12 - Comment 1. This comment shall be in accordance with the codes listed in Section 4.3 of this Guide.
9.1.13 Item 13 - Comment 2. This comment shall be in accordance with the codes listed in Section 4.3 of this Guide.
9.1.14 Item 14 - Comment 3. This comment shall be in accordance with the codes listed in Section 4.3 of this Guide.
9.1.15 Item 15 - Other Comments. This field shall be used to document situations for which there is no corresponding code in Section 4.3 of this Guide.
9.1.16 Item 16 - Data Filename, Test 1. This shall be the name of the raw data file generated during resilient modulus testing at the first test temperature.
9.1.17 Item 17 - Test 1 Temp. (°C). This shall be the temperature at which the first resilient modulus test was run.
9.1.18 Item 18 - Data Filename, Test 2. This shall be the name of the raw data file generated during resilient modulus testing at the second test temperature.
9.1.19 Item 19 - Test 2 Temp. (°C). This shall be the temperature at which the second resilient modulus test was run.
9.1.20 Item 20 - Data Filename, Test 3. This shall be the name of the raw data file generated during resilient modulus testing at the second test temperature.
9.1.21 Item 21 - Test 3 Temp. (°C). This shall be the temperature at which the first resilient modulus test was run.
9.1.22 Item 22 - Analysis Filename. This shall be the name of the resilient modulus output file generated by the "MRFHWA" software.
9.1.23 Item 23 - Data Filename, Test 1. This shall be the name of the raw data file generated during creep compliance testing at the first test temperature.
9.1.24 Item 24 - Test 1 Temp. (°C). This shall be the temperature at which the first creep compliance test was run
9.1.25 Item 25 - Data Filename, Test 2. This shall be the name of the raw data file generated during creep compliance testing at the second test temperature.
9.1.26 Item 26 - Test 2 Temp. (°C). This shall be the temperature at which the second creep compliance test was run.
9.1.27 Item 27 - Data Filename, Test 3. This shall be the name of the raw data file generated during creep compliance testing at the third test temperature.
9.1.28 Item 28 - Test 3 Temp. (°C). This shall be the temperature at which the third creep compliance test was run.
9.1.29 Item 29 - Analysis Filename. This shall be the name of the creep compliance output file generated by the "ITLTFHWA" software.
9.1.30 Item 30 - Data Filename. This shall be the name of the raw data file generated during the indirect tensile strength test.
9.1.31 Item 31 - Test Temp (°C). This shall be the temperature at which the indirect tensile strength test was run.
9.1.32 Item 32 - ".OUT" Filename. This shall be the name of the output file containing indirect tensile strength and poisons ratio generated by the "ITLTFHWA" software. By default this file has a ".out" extension.
9.1.33 Item 33 - ".STR" Filename. This shall be the name of the output file containing the stress versus strain information calculated by the "ITLTFHWA" software. By default this file has a ".str" extension. (Currently this data is not used by LTPP.)
9.1.34 Item 34 - ".FAM" Filename. This shall be the name of the output file containing the initial tangent modulus, failure strain and fracture energy calculated by the "ITLTFHWA" software. By default this file has a ".fam" extension. (Currently this data is not used by LTPP.)
9.2 Electronic Data files
The electronic data files shall be located on a clearly labeled diskette accompanying form T07, and the filenames shall be as recorded on form T07. One complete test sequence will generate 26 data files. The breakdown is as follows:
9 Resilient modulus raw data files
one for each specimen at each temperature)
9 Creep compliance raw data files
(one for each specimen at each temperature)
3 Indirect tensile strength test raw data files
(one for each specimen)
1 Resilient modulus analysis file
1 Creep compliance analysis file
3 Indirect tensile strength test analysis files
9.2.1 File Naming convention
9.2.1.1 Raw Data Files
As a result of testing performed using this procedure, 21 raw data files are generated. Raw data files are files that contain time, load, deformation, and temperature information for each test procedure. The data files are named in the following manner:
12345678.dat
Slots 1, 2, 3, and 4 are used to assign a number to each sample. This number shall be assigned sequentially by the laboratory, and shall be unique to the specimen under test. Slots 5 and 6 of the file are used to designate the test performed; "rm" for resilient modulus, "cp" for creep compliance, or "ts" for indirect tensile strength. Slots 7 and 8 are used to designate the test temperature; "-0" for -10°C (14°F), "05" for 5°C (41°F), "25" for 25°C (77°F), and "40" for 40°C (104°F). All files have a ".dat" extension to designate it is a raw data file. Table 1 contains an example of the number and naming of data files resulting from one test sequence.
| Test | Temperature | Specimen 1 | Specimen 2 | Specimen 3 |
|---|---|---|---|---|
| Resilient Modulus | 5°C (41°F) | 6042rm05.dat | 6043rm05.dat | 6044rm05.dat |
| 25°C (77°F) | 6042rm25.dat | 6043rm25.dat | 6044rm25.dat | |
| 40°C (104°F) | 6042rm40.dat | 6043rm40.dat | 6044rm40.dat | |
| Creep Compliance | -10°C (14°F) | 6042cp-0.dat | 6043cp-0.dat | 6044cp-0.dat |
| 5°C (41°F) | 6042cp05.dat | 6043cp05.dat | 6044cp05.dat | |
| 25°C (77°F) | 6042cp25.dat | 6043cp25.dat | 6044cp25.dat | |
| Indirect Tensile Strength | 25°C (77°F) | 6042ts25.dat | 6043ts25.dat | 6044ts25.dat |
9.2.1.2 Analysis Files
The analysis files are created by running the "MRFHWA" software on the resilient modulus data files, and the "ITLTFHWA" software on the creep compliance and indirect tensile strength data files. The analysis files generated by these programs by default have the same first eight characters as the specimen 1 data file, but a different extension. Table 2 contains example analysis filenames for the set of raw data files contained in Table 1.
| Contents | Filename |
|---|---|
| Resilient Modulus | 6042rm05.mro |
| Creep Compliance | 6042cp-0.out |
| Indirect Tensile Strength | 6042ts25.out |
| Stress vs. Strain | 6042ts25.str |
| Initial tangent modulus, fracture energy and failure strain | 6042ts25.fam |
9.2.2 File Structure
As these files are to be analyzed and uploaded to the PPDB using automated software, strict adherence to the standard file structures presented here is critical.
9.2.2.1 Raw Data File Structure
Each raw data file shall contain seven tab-delimited columns containing the following information:
Column 1 - horizontal deformation, sample face 1, in.
Column 2 - vertical deformation, sample face 1, in.
Column 3 - horizontal deformation, sample face 2, in.
Column 4 - horizontal deformation, sample face 2, in.
Column 5 - applied load, lb.
Column 6 - time, seconds
Column 7 - environmental chamber temperature, °F
Each raw data file corresponds to an asphalt specimen that has undergone the Resilient Modulus, Creep Compliance, or Indirect Tensile testing; all of the data files follow roughly the same format. Each data file contains a number of rows that contain data for each sampling point taken during the testing process. The specific format for each data file type is as follows:
9.2.2.1.1 Resilient Modulus Data File
For resilient modulus testing, five test cycles are collected at a sampling rate of 500 points per second, resulting in a data file with approximately 2500 rows. The first thirteen rows contain header information that is not essential for the calculations. The fourteenth and fifteenth rows are the data names and units; the data are arranged in columns below the data names and units. The data is organized in columns 1 through 7; there should be exactly 2562 rows of data. The first column (rows 16-2577) contains deformation data collected from the first horizontal extensometer. The second column (rows 16-2577) contains deformation data collected from the first vertical extensometer. The third column (rows 16-2577) contains deformation data collected from the second horizontal extensometer. The fourth column (rows 16-2577) contains deformation data from the second vertical extensometer. The fifth column (rows 16-2577) contains load data obtained throughout the test. The sixth column (rows 16-2577) contains the time at which the corresponding data values are recorded; the total nominal time duration of each test should be 5 seconds. The environmental chamber temperature is shown in the seventh column (rows 16-2577).
9.2.2.1.2 Creep Compliance Raw Data File
Creep compliance testing requires a sampling rate of 10 points per second for 100 seconds, and these data files nominally contain a little over a thousand rows of data (1000 rows of testing data and a few pre-test and post-test data points). Each data file corresponds to an asphalt specimen that has undergone the creep compliance testing. The first 5 rows of each data file contain header information that is not essential for the calculations. Row 6 includes the data labels for each data type and row 7 includes the units for each data type. The data is organized in columns 1 through 7; there should be exactly 1039 rows of data. The first column (rows 8-1046) contains deformation data collected from the first horizontal extensometer. The second column (rows 8-1046) contains deformation data collected from the first vertical extensometer. The third column (rows 8-1046) contains deformation data collected from the second horizontal extensometer. The fourth column (8-1046) contains deformation data from the second vertical extensometer. The fifth column (rows 8-1046) contains load data obtained throughout the test. The sixth column (rows 8-1046) contains the time at which the corresponding data values are recorded; the total nominal duration of each test should be 100 seconds. The environmental chamber temperature is shown in the seventh column (rows 8-1046).
9.2.2.1.3 Indirect Tensile Strength Raw Data File
Indirect tensile strength testing requires data collection at no less than twenty points per second for the duration of the test. The number of rows in these files fluctuates based upon the response (strain to failure) of the test specimen. Each data file corresponds to an asphalt specimen that has undergone the indirect tensile testing. The first 6 rows of each data file contain header information that is not essential for the calculations. Row 7 includes the data labels for each data type and row 8 includes the units for each data type. The data is organized in columns 1 through 7. The first column contains the deformation data collected from the first horizontal extensometer. The second column contains the deformation data collected from the first vertical extensometers. The third column contains the deformation data collected from the second horizontal extensometer. The fourth column contains the deformation data from the second vertical extensometer. The fifth column contains the load data obtained throughout the test. The sixth column contains the time at which the corresponding data values are recorded. The environmental chamber temperature is shown in the seventh column.
9.2.2.2 Analysis File Structure
The analysis files shall be generated by the "MRFHWA" and "ITLTFHWA" programs, and shall be submitted by the lab with no modifications.
A1.1 Bottom Load Heads
Figure A.1.1. Bottom load heads.
A1.2 Bottom Load Head Subassembly
Figure A.1.3. Top load head.
A1.4 Top Load Head Swivel Block
Figure A.1.4. Top load head swivel block.
Figure A.2. Load rods.
Figure A.3. Gauge point mounting template
| << Previous | Contents | Next >> |

