U.S. Department of Transportation
Federal Highway Administration
1200 New Jersey Avenue, SE
Washington, DC 20590
202-366-4000
Federal Highway Administration Research and Technology
Coordinating, Developing, and Delivering Highway Transportation Innovations
 |
| This report is an archived publication and may contain dated technical, contact, and link information |
|
Publication Number: FHWA-HRT-08-035 Date: March 2008 |
To ensure the highest quality data were provided to FHWA for inclusion into the LTPP database, various QC measures were incorporated into the MicroMoist program. Manual review procedures were also developed and implemented as part of the data processing activities. This chapter provides details on all of the QC and quality assurance tools used in this process.
Due to the large quantity of data analyzed, MicroMoist was developed to process all TDR traces and compute parameters automatically, but additional consideration was given to unique data requiring user input to ensure the highest quality end product. For example, TDR traces not exhibiting a negative slope could not be analyzed using the proposed method. Also, some computed parameters, especially dry density, could be unreasonable. Therefore, a flagging function was developed to assign comment codes to the TDR traces exhibiting suspect characteristics and/or resulting in questionable computed parameters. The error codes are assigned in the ERROR_COMMENT field of the SMP_TDR_MOISTURE output table.
An example of an uninterpretable TDR trace that did not exhibit a negative slope between the inflection points is shown in figure 22. These traces may be caused by abnormal TDR device operation or the environmental effects near TDR probes, such as temperature or very high salinity of the soil.
Figure 23 provides an example of a TDR trace in which the first inflection point was not captured. The TLE can still be used to estimate dielectric constant from these traces. While the method can interpret dielectric constant using only a small portion of the TDR trace, the prediction error is greatly reduced as the portion of the TDR trace utilized in the computation increases.
A check for these types of traces was included in the program. If the program could not capture a negative slope between the inflection points, the traces were flagged as uninterpretable TDR traces in the program. The number of the questionable TDR trace is displayed as "Dubious Trace" in the program display. Also, a comment code of "TDR_ERR" is assigned to the ERROR_COMMENT field in the SMP_TDR_MOISTURE table.
The program was also designed with a visual feature to allow user review of all TDR traces. Every trace in the input tables can be visually reviewed by a user. This feature allows users to identify unique traces not detected by the automated checks, while also providing a visual verification of those traces that were flagged. As part of the viewing function, the user has the capability of modifying the ranges used in the TLE for cases where they were improperly identified by the program.
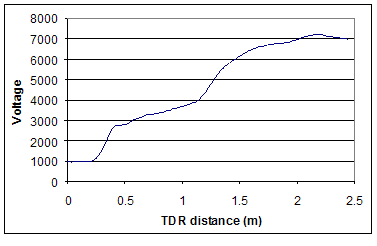
Non-negative slope
Figure 22. Graph. Uninterpretable TDR trace.
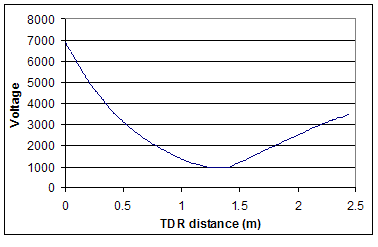
Figure 23. Graph. Incomplete TDR trace.
The measured ground truth values of dry density reported in the LTPP database were in the range of 1.3 to 2.5 g/cm3. Most of the dry densities calculated from the program were also within this range as well. However, the dry density values of some TDR traces were calculated to be less than 1.3 g/cm3, most likely due to unreasonably high moisture content or frozen soil material. In these instances, the program assigns a comment of "DD_ERR" in the SMP_TDR_MOISTURE table.
One of the key advantages of this computation process over previous methods is the calibration of the micromechanics model to site specific conditions and equipment. In order to calibrate the micromechanics model, ground truth measured moisture content and dry density were required. Without this information, the model could not be calibrated and accurate computations could not be generated. It was discovered that ground truth data were unavailable at five SMP sites installed on the Specific Pavement Study (SPS)-5 and SPS-9 in New Jersey. For these cases, a comment code of "CALI_ERR" is assigned to ERR_COMMENT field. The error codes used to identify TDR trace inconsistencies are listed in table 20.
| Error Code | Description |
|---|---|
| TDR_ERR | TDR trace does not have a negative slope. |
| DD_ERR | Calculated dry density is less than 1.3 g/cm3. |
| CALI_ERR | Calibration data from installation activities are unavailable. |
Moisture content is expected to decrease as the dielectric constant is reduced. However, in a few TDR sensors, a shift in the VMC occurs even though the dielectric constant decreases, as illustrated in figure 24. The data trends in this figure are from LTPP section 091803. TDR sensor number 7 exhibits a shift in the relationship for dielectric constant values between 3 and 5. Also, the dry density values of the left side of the shift were a little higher than those of the right side. The shift is associated with the circumstances related to the calibration for the soil moisture content. This shift occurred on other sections as well.
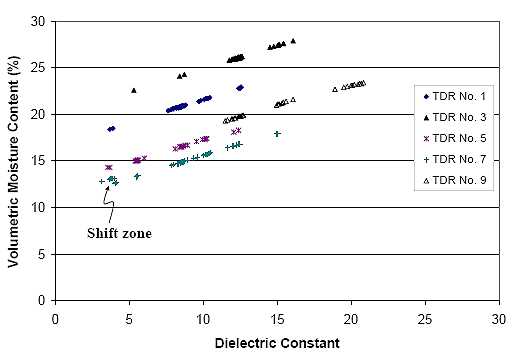
Figure 24. Graph. Shift zone in LTPP section 091803, TDR sensor No. 7.
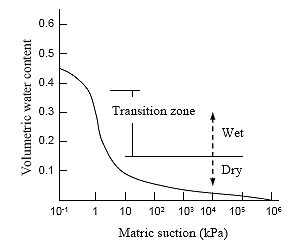
Figure 25. Graph. Soil-water characteristic curve for sandy soil.
As the water content of the soil is reduced, the matric suction is increased as a result of the change of pore-water pressure in the soil-moisture system. The relationship between the matric suction and the water content of a soil is called the soil-water characteristic curve (SWCC) as shown in figure 25.
As seen in figure 25, the SWCC has a transition zone at which the volumetric water content rapidly drops compared to the matric suction variation. This is particularly prevalent in sandy soils.
The TDR sensors located in soils associated with a shift zone most likely have been calibrated with moisture data on the wet side of the SWCC. Figure 26 illustrates two density-moisture conditions in the same soil. The wet condition shown in figure 26 (b) has higher VMC and lower dry density values than the dry condition, but the weight of solids is the same.
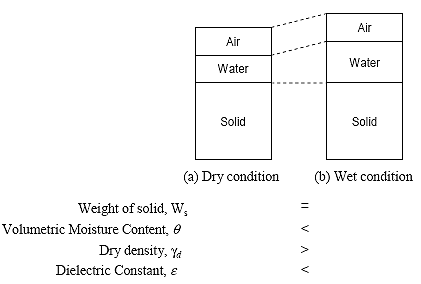
Figure 26. Diagram. Diagrams of soil having different volume.
Figure 27 also shows the relationship between the SWCC and the VMC trend.
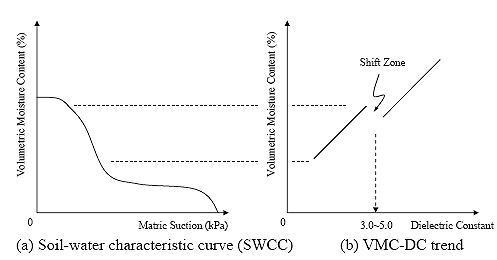
Figure 27. Graph. Comparison of SWCC and VMC-DC trend.
As seen in figure 27, when the calibration of a TDR sensor was carried out on the wet side, the higher dry density soil exhibits a lower dielectric constant but similar VMC because the volume of water was smaller (on a percentage basis) in the higher density material.
As a consequence, any TDR trace containing a shift in the moisture content-dielectric constant trend indicates that an additional calibration needs to be carried out in order to determine the correct interpretation of the TDR trace over the full range of moisture contents. Because the LTPP database did not have additional ground truth data to perform further calibrations, the values in the transition zone were adjusted (and flagged) accordingly.
Moisture content and dry density estimates generated from the program were plotted to review seasonal trends and variation with depth using pivot tables in Microsoft Excel. An example of moisture content seasonal trends can be found in figure 28.
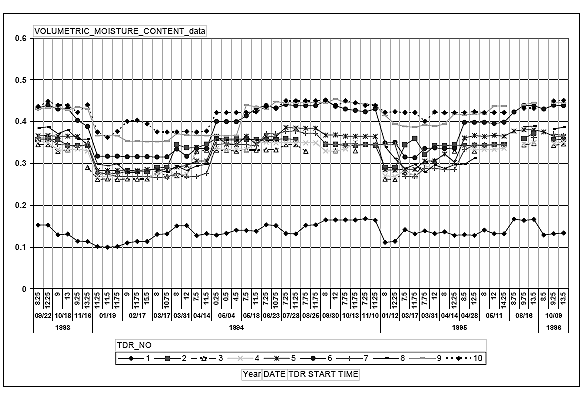
Figure 28. Graph. Sample plot of moisture content seasonal trend.
The pivot table configuration allowed large quantities of data to be reviewed relatively quickly, while the graphical nature made questionable or anomalous data readily identifiable. Problematic or frequently occurring trends in the data could also be easily recognized through the process.
During the program development phase of the project, the pivot tables served as a critical part of the beta testing. The review provided valuable insight, identified issues with the software, and was an integral part of the debugging process. Multiple programming and testing iterations were conducted in completing the MicroMoist program.
The pivot tables were also used after MicroMoist was finalized to perform a 100 percent review on all computed moisture content and dry density estimates. Outliers and anomalous data identified were manually flagged in the final data submittal to FHWA.
The QC measures incorporated into the program and the post-processing reviews were designed as a supplement to the LTPP database QC checks. Coupling the LTPP checks with the reviews conducted by the analysis team, the data provided to FHWA for inclusion into the LTPP database underwent a very rigorous QC process.
Unlike an empirical approach, which provides an error of estimate based on the fit of the regression equation, the micromechanics approach provides no such comparison. The micromechanics model is solved through an iterative process, which closes on a solution with an error of less than one percent. This, however, does not give a realistic error estimate on the resultant moisture content and dry density because there are multiple steps involved in the computation process (i.e., TLE and micromechanics model).
The best estimate of error for this type of approach is achieved by comparing the computed moisture content solutions to those obtained from both the laboratory and field moisture tests. This was described in chapter 3 as part of the validation discussion. Data from Klemunes' work with TDR data in soils from SMP sites were considered from laboratory tests. The field moisture tests used in this validation were obtained during a forensic analysis of LTPP-SMP test section 091803. The differences between the micromechanics solution and the laboratory tests are shown in figure 10, while those from the field tests are shown in figure 12.
For most of the test results, the differences were less than five percent, with one set of test results indicating a difference of 10 percent. Based on this information, a conservative estimate of the possible error in the computations of the micromechanics approach is approximately 10 percent.
| < Previous | Contents | Next >> |