U.S. Department of Transportation
Federal Highway Administration
1200 New Jersey Avenue, SE
Washington, DC 20590
202-366-4000
Federal Highway Administration Research and Technology
Coordinating, Developing, and Delivering Highway Transportation Innovations
| REPORT |
| This report is an archived publication and may contain dated technical, contact, and link information |
|
| Publication Number: FHWA-HRT-10-069 Date: September 2011 |
Publication Number: FHWA-HRT-10-069 Date: September 2011 |
The Campus Loop Bridge was constructed in Albany, NY, in 1962 and carries traffic from Hawkins Street in the east-west direction over NY-85. This slab-on-stringer bridge has two 18.04-ft (5.5-m)-wide travel lanes and is approximately 390.32 ft (119 m) long. Two abutments and four piers support five spans.
The piers are numbered from east to west, with pier 2 located in the median of NY-85. Each pier consists of two column bents, one on each side of the centerline of the deck (see figure 36). Each bent has three 42.1-inch (1,069.3-mm)-diameter columns, which are approximately 14.1 ft (4.3 m) high and vary in height from one end of the pier to the other. The columns are numbered 1 through 6 starting from the north and are supported by a raft foundation. The reinforcement in the columns is comprised of 13–17 vertical bars with a diameter of 1.1 inches (27.9 mm) and spiral ties with a diameter of 0.5 inches (12.7 mm).
In August 1991, a corrosion condition evaluation of the six columns of pier 2 was performed.(1) Fifteen percent of the column surface area was delaminated. The average chloride ion content was determined to be 1,967 ppm in the top 2 inches (50.8 mm) of concrete, and 74 percent of the corrosion potentials that were measured were found to be active. Linear polarization corrosion rate measurements suggested that damage in sound areas could be expected to occur within 2 to 10 years.
In May 1992, all delaminated concrete from subject columns was removed to the rebar level and repaired by patching with a cementitious material. In June 1992, electrochemical chloride extraction treatment developed under the SHRP program was applied to the six columns on pier 2. The pier cap beams were not treated.
Each column was wrapped by a 10.99-ft (3.35-m)-long anode/blanket composite, which was covered by a plastic film, and a 0.3 M sodium borate buffered electrolyte was used. The anode/blanket composite contained three layers of blanket material and the anode. The first layer was designed to retain the electrolyte and provide contact. A titanium mesh anode was sandwiched between the remaining two layers of blankets. The electrolyte was pumped to the top of the anode/blanket composite and allowed to flow down the column by gravity and collect in a sump. The containment of the electrolyte within the anode/blanket assembly was paramount to the success of the treatment. On columns 1 and 4, the containment could not be accomplished. Because these columns could not be treated, they were designated as untreated controls. For the application of ECE, two electrical zones were established, each containing two columns.(1) Zone 1 included columns 2 and 3, and zone 2 contained columns 5 and 6.
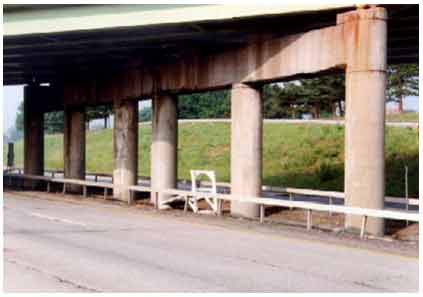
Figure 36. Photo. Pier 2 of the Campus Loop Bridge in Albany, NY.
Current densities in the two electrical zones ranged from 0.10 to 0.30 A/ft2 (1.1 to 3.2 A/m2), and they accumulated total charges of 80 and 93 A-h/ft2 (860 and 1,000 A-h/m2). Chloride ion removal for the two zones was estimated to be 0.32 to 0.53 oz/ft2 (97 and 161 g/m2), and current efficiencies were calculated to be 7 and 13 percent, respectively.
In addition to the containment problems, dissolution of the titanium anode at random locations suggesting high-localized current densities, cracking of the patches, and lowering of electrolyte pH to 3 were also observed.
The following three field evaluations were performed:
During the first visit, patched areas on all columns were identified, and cracks were observed in all patched areas (see figure 37). A majority of cracks in patched areas were considered to be shrinkage cracks and did not exhibit signs of ongoing corrosion. During the second trip, a significant increase in cracking was observed, and many of the cracks inside and outside patched areas exhibited rust staining (see figure 38 through figure 40). Further increases in cracking and rust staining were observed during the third visit. Total cumulative crack length for cracks outside patched areas is presented in table 5.
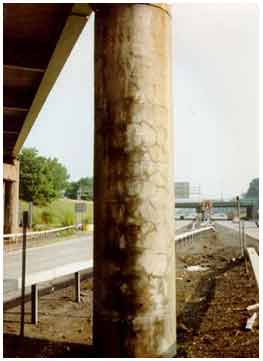
Figure 37. Photo. Cracking on the patched areas on one of the columns of the
Campus Loop Bridge in Albany, NY, during the first evaluation in 1995.
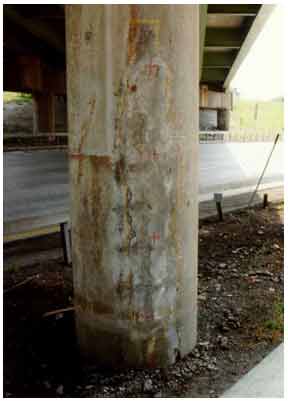
Figure 38. Photo. First view of cracks and rust staining in patched and nonpatched
areas of the columns of the Campus Loop Bridge in Albany, NY, during the second visit in 1996.
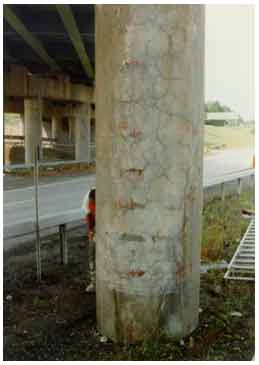
Figure 39. Photo. Second view of cracks and rust staining in patched and nonpatched
areas of the columns of the Campus Loop Bridge in Albany, NY, during the second visit in 1996.
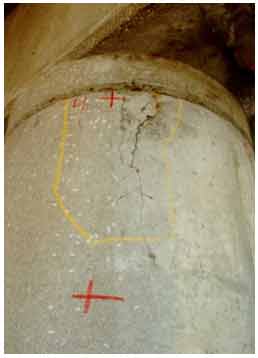
Figure 40. Photo. Cracks and rust staining in a nonpatched area of a column
of the Campus Loop Bridge in Albany, NY, during the second visit in 1996.
1 inch = 25.4 mm |
Prior to the application of ECE, cracks were observed on all columns, with column 5 exhibiting the least amount of cracking and column 6 exhibiting the most. There is no indication in the SHRP reports that these cracks were repaired prior to or after the application of ECE. The data presented in the table do not suggest any difference between treated and untreated columns.
Joints in the bridge deck were leaking, and water was flowing down the pier caps and the columns (see figure 41). The water flowing through the leaking joints in winter was probably contaminated with deicing salts. It can be concluded that chloride ions from the contaminated water were introduced into the column concrete. Shrinkage cracks were observed in the patched areas immediately after the completion of the ECE treatment. It was suspected that chloride contaminated electrolyte may have entered the patched areas through these cracks and deposited chloride ions.
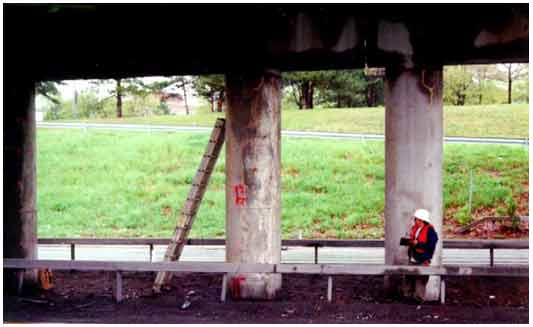
Figure 41. Photo. Water flowing down the pier caps and columns through leaking joints.
A delamination survey was performed on each column during each evaluation. By 1995, all patches on all columns were completely delaminated (see figure 42 through figure 44). In 1996, delaminations extended from the patches into the original concrete. Delaminations not associated with any patches were also detected. Cumulative percent delaminations as a function of time are presented in table 6.
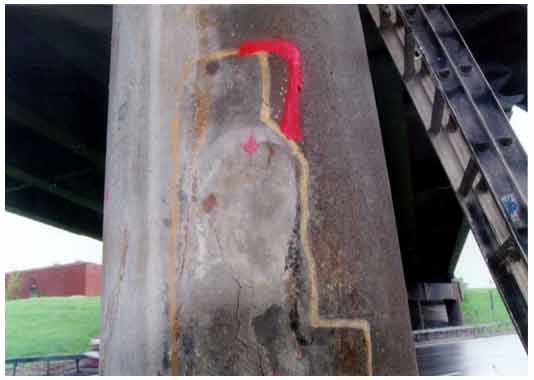
Figure 42. Photo. First view of a completely delaminated patch (marked in yellow)
on a column of the Campus Loop Bridge in Albany, NY.
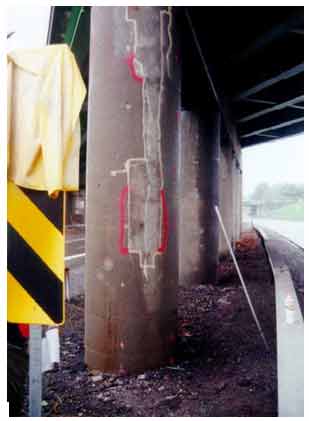
Figure 43. Photo. Second view of a completely delaminated patch (marked in yellow)
on a column of the Campus Loop Bridge in Albany, NY.
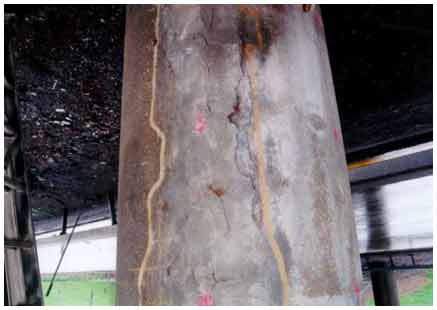
Figure 44. Photo. Third view of a completely delaminated patch (marked in yellow)
on a column of the Campus Loop Bridge in Albany, NY.
1 m2 = 10.8 ft2 |
From 1995 to 1996, delaminations significantly increased in four of the six columns. A majority of the increase in the delaminations was attributed to an extension of delaminations from patches to the surrounding concrete and delaminations along cracks. Considering that the patches had suffered shrinkage cracking at or before ECE application and chloride contaminated electrolyte may have been absorbed into the patches, it can be hypothesized that excessive chlorides introduced into the patches in this manner were the primary reason for their failure. Also, chloride ions from the contaminated runoff water were entering cracks and resulted in corrosion-induced delaminations. It should be noted that no form of barrier to chloride ions was installed on the columns after the application of ECE.
Clear concrete cover over reinforcing steel was documented when the steel was exposed for electrical continuity testing. Average clear cover over reinforcing steel was 2.4 inches (61 mm). Average cover for each column ranged from 2.2 to 2.8 inches (55.9 to 71.1 mm).
During the first evaluation in 1995, one 3-inch (76.2-mm)-diameter core was collected from a height of 2.98 to 4.30 ft (0.91 to 1.31 m) on the south side of each column. In the later two evaluations, two 3-inch (76.2-mm)-diameter cores were collected, one from the north side and one from the south side of the columns. These cores were also collected from heights of 2.98 to 4.00 ft (0.91 to 1.22 m).
Powdered concrete samples were collected from each core at varying depths. The powered concrete samples were analyzed in accordance with procedures prescribed in AASHTO T-260 standard practice.(2)
Figure 45 through figure 50 present the average variation of chloride ion content as a function of depth for each column. The data suggest that chloride ion content generally increased with time for all columns. This was expected as columns were exposed to chloride contaminated water runoff and splash. The chloride ions continued to migrate into the column concrete.
The average chloride ion content at the average steel depth was below the corrosion threshold for columns 2 and 4–6 and was above the threshold for the remaining columns. This explains the reduction in rate of increase of delaminations with time. Corrosion-induced damage primarily occurred in patched areas with cracks and occurred adjacent to cracks in other areas where chloride ions had direct access to the steel.
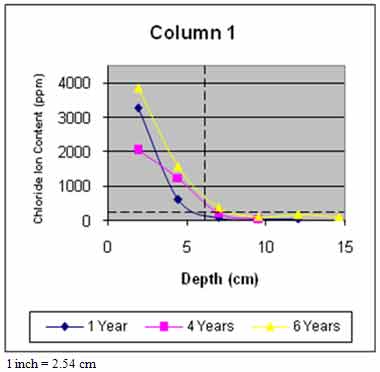
Figure 45. Graph. Average chloride profile for column 1.
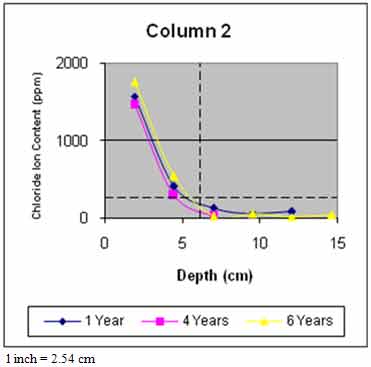
Figure 46. Graph. Average chloride profile for column 2.
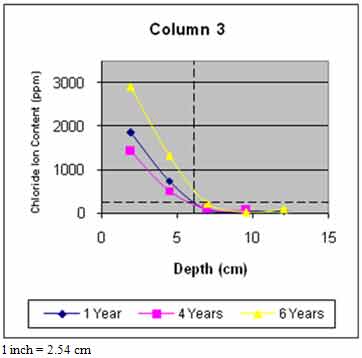
Figure 47. Graph. Average chloride profile for column 3.
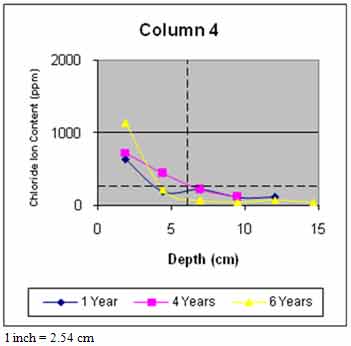
Figure 48. Graph. Average chloride profile for column 4.
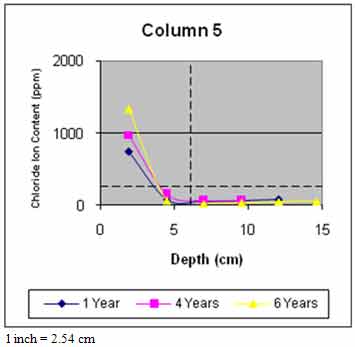
Figure 49. Graph. Average chloride profile for column 5.
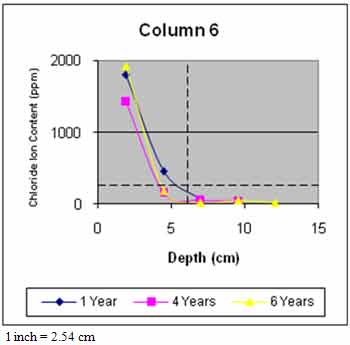
Figure 50. Graph. Average chloride profile for column 6.
A half-cell potential survey was performed on a 2.00-ft (0.61-m) grid on each column with a copper-copper sulfate half-cell during each evaluation. In five of the six columns, the percentage of active potentials increased with time, and it remained constant in column 3 (see figure 51). The average potential of column 1 remained more negative than −350 mV during the three evaluations (−365, −371, and −416 mV). Additionally, the average potential of column 6 became more negative than −350 mV since the second evaluation (−325, −496, and −424 mV). The increase in percentage of potentials in the active range correlated with the increase in chloride ion content and damage.
Corrosion rate measurements were made using the 3LP-NBS corrosion rate device at four locations on each column during each trip. Although corrosion rates fluctuated with time, they were generally high (i.e., in a range that suggests damage would occur in the next 2 to 10 years) (see table 7).
1 mA/m2 = 0.093 mA/ft2 |
Although the application of ECE may remove a significant amount of chloride ions, the long-term effectiveness of ECE is dependent on the remigration of existing chlorides, ingress of new chlorides, the amount of hydroxyl ions generated at the steel-concrete interface, and the dissipation of the hydroxyl ions with time. At this test site, the requirement of extracting chloride ions from the concrete was met to a certain degree; however, other requirements for the long-term effectiveness of ECE were not met.
SHRP researchers suspected that chloride ions might have been inadvertently introduced into the columns through cracks in the patched areas during the application of ECE. In addition, the columns were continually exposed to chloride contaminated runoff. The patterns of damage observed on the columns suggest that the cracks in the patched areas and in other areas were the primary channels of chloride ingress, resulting in corrosion-induced damage.
The variation of chloride distribution in the column concrete over time, half-cell potential data, and corrosion rate measurements all suggest an increasing propensity for corrosion. Based on the data, it can be concluded that the application of ECE at this site was ineffective. The failure of ECE at this site can be attributed to the following:
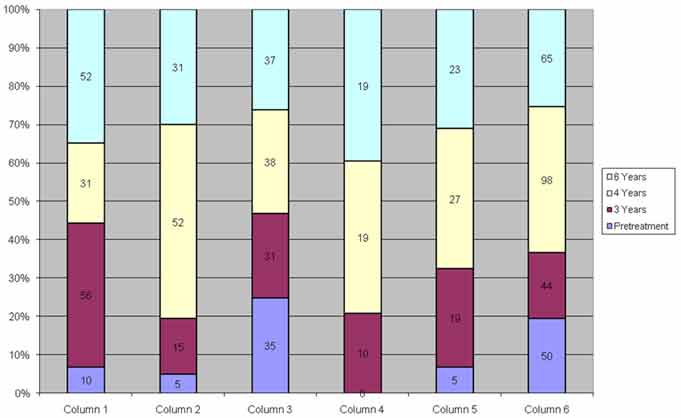
Figure 51. Graph. Distribution of active potentials versus time.
A four span slab-on-stringer bridge was constructed in 1969 to carry two northbound and two southbound lanes of Route 631 over I-64. Two abutments and three piers support the 334.56-ft (102-m)-long and 82-ft (25-m)-wide bridge (see figure 52). Each pier is comprised of two column bents, one on each side of the bridge centerline (see figure 53). The number of columns in a bent varies from three to four, although the total number of columns in each pier is seven. The piers are numbered from south to north. The western bents of piers 1 and 2 and the eastern bent of pier 3 are four-column bents, whereas the eastern bents of piers 1 and 2 and the western bent of pier 3 are three-column bents. The columns are numbered from west to east.
The length of the caps on the bents varies from 45.92 to 52.48 ft (14 to 16 m). The caps have a rectangular cross section of 4.3 ft (1.3 m) by 4.9 ft (1.5 m). The circular columns have a diameter of 3.6 ft (1.1 m) with a height of 18.4 to 21.3 ft (5.6 to 6.5 m).
This structure was selected for application of ECE in the Pilot Trial Program funded by FHWA and performed by the Virginia Transportation Research Council. Prior to the application of ECE, two sets of repairs were performed. In 1992, repairs were performed on the bottom of the pier caps and on the top of the columns. Just prior to the application of ECE in 1995, an additional 17.28 ft2 (1.6 m2) of delaminated concrete on the bottom of the pier caps and on the top of the columns was repaired.
A commercially available ECE treatment was applied on columns and cap beams of the western bents. The columns and cap beams of the eastern bents were designated as controls. A total surface area of 5,270.4 ft2 (488 m2) was treated on 3 cap beams and 11 columns.(3) The surface area for the control cap beams and columns totaled 4,654.8 ft2 (431 m2). A silane sealer was applied on all treated surfaces.
For the application of ECE, two different types of anode materials were used. On the flat faces of the pier caps, steel mesh was used as an anode. On the curved sections of the pier caps and columns, a commercially available titanium mesh anode was used. The titanium anode was used on curved surfaces because the steel mesh was too stiff. Cellulose fibers soaked in calcium hydroxide solution were sprayed to form a 2-inch (50.8-mm)-thick layer that encased the concrete surface and the anodes. The entire assembly was wrapped in plastic sheets and secured to minimize and control electrolyte evaporation from the cellulose fibers and protect the system from the environment.
After the installation of the plastic sheets, a short was discovered in pier 3. A section of the titanium anode applied on the subject pier had to be disconnected from the system, and that section did not receive ECE treatment.
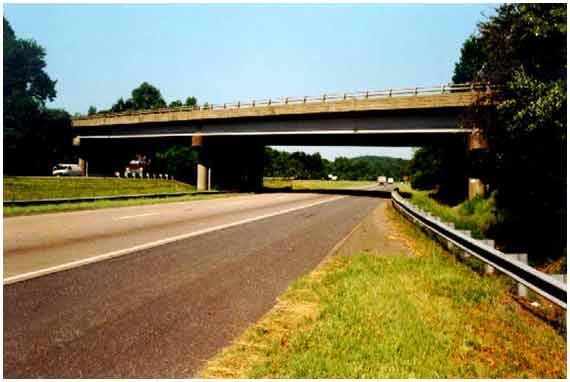
Figure 52. Photo. Route 631 over I-64 bridge in Charlottesville, VA.
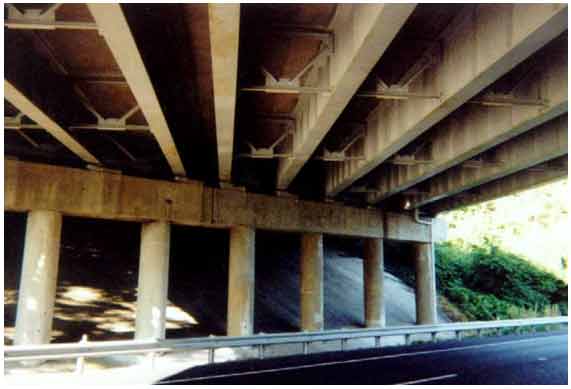
Figure 53. Photo. Soffit, bents, and columns of Route 631 over I-64 bridge in Charlottesville, VA.
The treatment for the piers varied from 72 to 77 days, the initial current densities varied from 0.03 to 0.041 A/ft2 (0.3 to 0.45 A/m2), and the final current densities varied from 0.011 to 0.014 A/ft2 (0.12 to 0.15 A/m2). The total charge passed varied from 23.1 to 35.5 A-h/ft2 (249 to 382 A-h/m2), and the current efficiencies were estimated to range from 8.6 to 27 percent (see table 8).
1 m2 = 10.8 ft2 |
The following three field evaluations were performed:
During each trip, visual inspection of the pier caps and the columns was performed. During the first two trips, no observable damage was noted. During the third trip, columns in pier 1 exhibited some deterioration. Noncorrosion-induced spalling was found on columns 1 and 6, rust staining was found on the bottom of columns 2 and 6, and cracking was found in a patch on column 6. A few rust stains were observed on the top of many columns. It was concluded that these stains resulted from water run-off carrying rust from other corroding metals on the bridge superstructure.
No delaminations were detected during the first two trips. During the third trip, two delaminations were detected on column 3, and one small delamination was found on column 2 of pier 1. Both delaminations on column 3 were located in repaired (i.e., patched) areas.
All cores collected for chloride ion content analysis during the first evaluation and some cores collected during the second evaluation contained reinforcing steel. Concrete cover over the embedded reinforcing steel was measured. Concrete cover varied from 1.3 to 3 inches (33.0 to 76.2 mm) for the columns and averaged 2.2 inches (55.9 mm), whereas concrete cover for the pier caps ranged from 3.5 to 4.3 inches (88.9 to 109.2 mm) and averaged 3.9 inches (99.1 mm).
During each evaluation, 12 2-inch (50.8-mm) cores were collected from the columns for chloride content analysis. To ensure that the chloride content was comparable from one evaluation to another, cores in subsequent trips were collected from areas adjacent to sampling sites in the previous evaluation. With the exception of one core, all other cores were collected from the lower half of the columns. Due to difficulties in collecting cores from the cap beams, only three cores were collected during the first evaluation.
From each core, powdered concrete samples were collected from regular intervals of 0.5 to 1 inch (12.7 to 25.4 mm) from the top surface of the core. The powdered samples were analyzed for total chloride ion content. The chloride ion contents of the samples collected from the cores were low. Only one core from a cap bean had chloride ions in excess of 500 ppm in the top 1.2 inches (30.5 mm) of concrete. Of the remaining 35 cores, only a couple of cores had chloride ion content in excess of 400 ppm in the top 1.2 inches (30.5 mm) of concrete. These cores were collected from treated and untreated columns. The highest average chloride ion content in the top 0.8 inches (20.3 mm) of concrete prior to the treatment was 848 ppm. The chloride ion content at the steel depth in all columns was below the threshold required to initiate corrosion.
Half-cell potentials were measured on a 0.98-ft (0.3-m) grid on the surface of the columns. All measurements were made after removing the silane sealer from the test location. Half-cell potentials measured in the first evaluation were not valid and are not reported. In general, most of the potentials measured were in the passive range. By the third evaluation, there was a slight shift in the potentials of the control columns toward the uncertain range.
Four corrosion rate measurements were made (one on each face) on columns 1–6 of each pier during the second and the third evaluations with the exception of three columns during the third evaluation. Two measurements were made on columns 1–3 of pier 1 during the third evaluation. Corrosion rates ranged from passive to low. Corrosion rate measurements suggest that no corrosion activity occurred.
The primary source of chloride ions in this structure was contaminated water run-off from the deck primarily from the leaking joints. Thus, the distribution of chloride ions was expected to be quite nonuniform. The ECE application report by Virginia Transportation Research Council documents the effectiveness of the treatment in removing chloride ions from the top 1.6 inches (40.6 mm) of concrete. The present corrosion status of the treated areas and the controls is benign, and damage only in localized areas is expected in the controls. Also, the application of ECE is recent on the structure, and it is too early to judge its long-term effectiveness at this site.

