U.S. Department of Transportation
Federal Highway Administration
1200 New Jersey Avenue, SE
Washington, DC 20590
202-366-4000
Federal Highway Administration Research and Technology
Coordinating, Developing, and Delivering Highway Transportation Innovations
| REPORT |
| This report is an archived publication and may contain dated technical, contact, and link information |
| Publication Number: FHWA-HRT-12-030 Date: August 2012 |
Publication Number: FHWA-HRT-12-030 Date: August 2012 |
PDF Version (4.44 MB)
PDF files can be viewed with the Acrobat® Reader®
This section provides an example for the use of the JPCP deltaT model developed under this study. The section used to describe the process is the LTPP SPS-2 section 04_0213 located in Maricopa County, AZ, and constructed in July 1993.
The following latitude, design, and material inputs required for the deltaT prediction model can be obtained from the MEPDG inputs:
The temperature range input to this model is the difference between the mean monthly maximum and minimum temperatures for the month of July from historical climate data records (as climate data included in the MEPDG). If the user does not have this information readily available, the data to compute the temperature range can be determined from the output file of the MEPDG analysis of this section. The output file (e.g., titled “04_0213.xls”) contains a worksheet titled “Climate” with key climate data for the specific location (or the virtual climate station created). This worksheet includes the monthly climate summary with minimum and maximum temperature by month for all years of data used under the headings “Min. Temp. (ºF)” and “Max. Temp. (ºF),” respectively. (Note that this summary also consists of “Average Temp. (ºF),” “Max. Range (ºF),” “Precip. (in.),” “Average Wind (mph),” “Average Sun (%),” “Number Wet Days,” and “Max. Frost (in.).” However, these data are not of relevance to the deltaT model).
For the month of July, the average minimum and maximum temperatures are 73 and 111.7 °F, respectively. The difference between these temperatures is 38.7 °F.
Using these inputs, the deltaT gradient can be calculated as -1.7457138 °F/inch. For the slab thickness of 8.3 inches, this is equivalent to a deltaT of -14.5 °F. This value is significantly higher than the default of -10 °F/inch. This input can be revised in an MEPDG file and reanalyzed to evaluate the predicted transverse cracking performance.
The procedure followed to obtain the dependent variable—the CRCP deltaT producing the closest prediction to field distress—shared several commonalities that followed to generate the deltaT for JPCP. Punchout prediction was the basis for selecting the optimum deltaT with minimized errors. The CRCP design files used for the calibration of the MEPDG models were run at deltaT values of -2.5, -5.0, -7.5, -10, -12.5, and -15 °F. The punchout predictions at all these values of deltaT were compared against field measured punchouts. The value corresponding to the least sum of squared errors for the prediction at all ages combined was selected as the optimum deltaT for that section. This selection of an optimum value for all the sections used in the calibration generated the dependent variable dataset.
As with the JPCP deltaT gradient model, the dependent variable CRCP deltaT data correlated well with the material, design, and climate parameters when transformed from deltaT temperature differential to deltaT temperature gradient. Step-wise regression and Cp analyses were performed to select the variables that best correlated to the dependent variable and to select the best combination of variables to develop the model. It was observed that coarse aggregate type was significant. After an iterative process to optimize the model, the equation developed to estimate the deltaT gradient variable is as follows:

Where:
deltaT/inch = Predicted gradient in CRCP slab, °F/inch.
MaxTemp = Maximum temperature for the month of construction, °F.
MaxTempRange = Maximum temperature range for the month of construction, °F.
PCCTHK= JPCP slab thickness, inch.
Chert =1 if PCC mix coarse aggregate is chert, or 0 if otherwise.
Granite = 1 if PCC mix coarse aggregate is granite, or 0 if otherwise.
Limestone = 1 if PCC mix coarse aggregate is limestone, or 0 if otherwise.
Quartzite = 1 if PCC mix coarse aggregate is quartzite, or 0 if otherwise.
The model considers climate (MaxTemp and MaxTempRange), design parameters (PCCTHK), and material (Aggregate type) parameters. The model statistics are presented in table 55. The model was developed with 35 data points and has an R2 value of 82.5 percent and an RMSE value of 0.27932 psi. Table 56 provides details of the range of data used to develop the model. Figure 226 shows the predicted versus measured for the proposed CRCP deltaT gradient model, while figure 227 shows the residual errors. Note that the measured data refers to the deltaT gradient determined by matching MEPDG prediction to field performance.
|
Variable |
DF |
Estimate |
Standard Error |
t-value |
Pr > t |
VIF |
|
Intercept |
1 |
12.93007 |
1.98459 |
6.52 |
< 0.0001 |
0 |
|
MaxTemp |
1 |
-0.15101 |
0.01793 |
-8.42 |
< 0.0001 |
3.46347 |
|
MaxTempRange |
1 |
-0.10241 |
0.01869 |
-5.48 |
< 0.0001 |
2.00933 |
|
Chert |
1 |
3.279 |
0.30508 |
10.75 |
< 0.0001 |
2.24965 |
|
Granite |
1 |
1.55013 |
0.22656 |
6.84 |
< 0.0001 |
4.96262 |
|
Limestone |
1 |
1.40009 |
0.18956 |
7.39 |
< 0.0001 |
4.00053 |
|
Quartzite |
1 |
2.01838 |
0.39449 |
5.12 |
< 0.0001 |
1.93773 |
|
PCCTHK |
1 |
0.11299 |
0.0705 |
1.6 |
0.1207 |
1.68624 |
The model statistics for table 55 are as follows:
|
Parameter |
Minimum |
Maximum |
Average |
|
Maximum temperature |
78.4 |
99.2 |
90.3 |
|
Temperature range |
24.8 |
40.4 |
30.4 |
|
Chert |
0 |
1 |
0.06 |
|
Granite |
0 |
1 |
0.31 |
|
Limestone |
0 |
1 |
0.46 |
|
Quartzite |
0 |
1 |
0.03 |
|
PCC thickness |
5.6 |
9.5 |
8.4 |
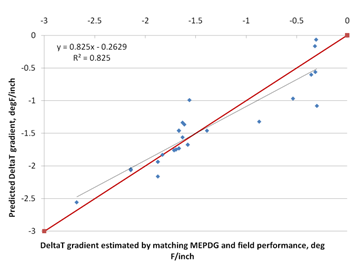
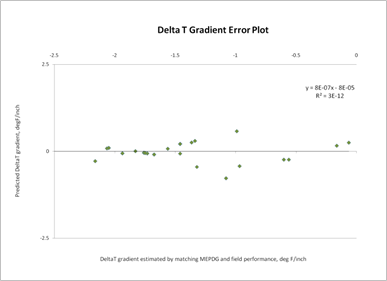
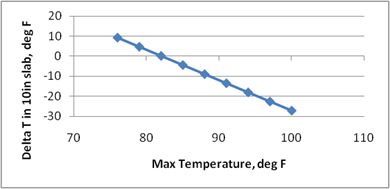
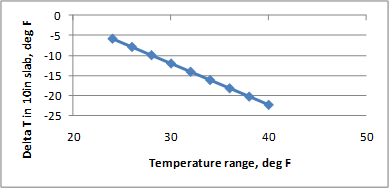
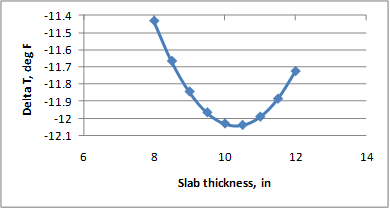
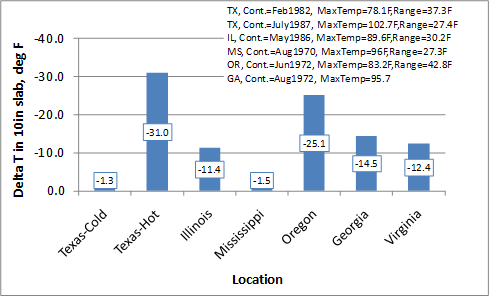
Figure 228 through figure 231 show the sensitivity of the deltaT differential calculation to the parameters maximum temperature of the project location, maximum temperature range, CRCP slab thickness, and geographic location, respectively. The trends observed in the model—CRCP deltaT increasing with increasing maximum temperature and increasing temperature range—are reasonable. While the effect of slab thickness shows a linear relationship with the deltaT gradient, the magnitude of the coefficient for this variable results causes the deltaT differential (CRCP deltaT gradient × thickness) to assume a nonlinear relationship with the deltaT differential, peaking at about 10 inches. Figure 231 shows the deltaT predictions for projects selected from LTPP sites in Texas, Illinois, Virginia, Mississippi, Oregon, and Georgia.
The sensitivity analyses show reasonable trends but do not demonstrate that the model is robust. From an engineering standpoint, it is not clear if the range of predicted values and their magnitudes are practical and realistic. The wide range of deltaT will have a significant effect on design thickness. The data used to develop the model show very strong correlations, and it is likely that the predictions are valid, at least within a certain range of inputs. The current analyses and the data available are not adequate to determine these ranges. It is therefore recommended that this model be used with extreme caution.