U.S. Department of Transportation
Federal Highway Administration
1200 New Jersey Avenue, SE
Washington, DC 20590
202-366-4000
Federal Highway Administration Research and Technology
Coordinating, Developing, and Delivering Highway Transportation Innovations
| REPORT |
| This report is an archived publication and may contain dated technical, contact, and link information |
|
| Publication Number: FHWA-HRT-12-068 Date: December 2012 |
Publication Number: FHWA-HRT-12-068 Date: December 2012 |
Profile data were collected over the entire Arizona SPS-2 site during 15 visits, as shown in table 2. Raw profile data were available for all 15 visits. In each visit, a minimum of seven repeat profile measurements were made. The measurements for all visits included sections 0213–0224 and sections 0260–0268.
Profile data were also collected over section 0215 on 16 additional dates as part of the Seasonal Monitoring Program (SMP). On most of the measurement dates for this section, profiles were collected in the morning and the afternoon. In others, the profiles were collected in the early and late morning. In this report, each group of runs is treated as a distinct visit. Table 3 lists the dates and times of each visit. These visits covered 4 seasons in 1998 and 12 consecutive seasons starting in the winter of 2001.
Profiles of individual test sections were extracted directly from the raw measurements and aligned using an automated trace comparison algorithm. This was done for two reasons. First, profiles were collected at a sample interval of 0.98 inches in visits 03–08 and S01–S14 and at a sample interval of about 0.77 inches in visits 09–11 and S15–S28. These data appeared in the database after the application of an 11.8-inch moving average and decimation to a sample interval of 5.91 inches. The raw data contained the more detailed profiles. Second, this study depended on consistency of the profile starting and ending points with the construction layout and consistency of the section limits with time. Appendix A describes the extraction of individual test section profiles from the raw measurements and the process of ensuring the profiles had consistent alignment.
Each visit of each test section included five, seven, or nine repeat profile measurements. Data quality screening was performed to select five repeat profile measurements per section from each visit. Among the group of available runs, the five measurements that exhibited the best agreement with each other were selected. Agreement between two profiles was judged by cross correlating the profiles after applying the IRI filter rather than the overall IRI values. This method compares the profile traces rather than the overall index. Achieving high correlation requires that the details of the profile shape affecting roughness agree as well as the overall roughness level.(8)
The average correlation level produced by these calculations provided a numerical assessment of the repeatability within each set of repeat measurements. Overall, most sets of selected repeat measurements exhibited good repeatability. In some cases, localized surface distress reduced repeatability. The inconsistency in profiles in these areas occurred because of slight variations in the lateral tracking position of the profiles as the profiler passed over transversely inconsistent surface features. The most prominent example of this inconsistency occurred in the later visits of section 0213 on the left side of the lane.
Appendix B describes the process of selecting five repeat measurements for each visit of each section and provides a list of the selected profiles with a repeatability score. Appendix C provides the standard deviation of left and right IRI values for each set of repeat measurements.
Appendix C provides roughness progression plots for all 21 test sections. These plots show the left and right IRI values from each visit over the 16-year monitoring period. Appendix C also lists the IRI, Half-car Roughness Index (HRI), and Ride Number (RN) of each section for each visit. These roughness values are the average of the five repeat measurements selected by data quality screening. The measurements are not necessarily the same five repeat measurements selected for the LTPP public database. Appendix C also provides the standard deviation of IRI over the five repeat measurements. This helps identify erratic roughness values that are the result of transverse variations in the profile caused by surface distresses.
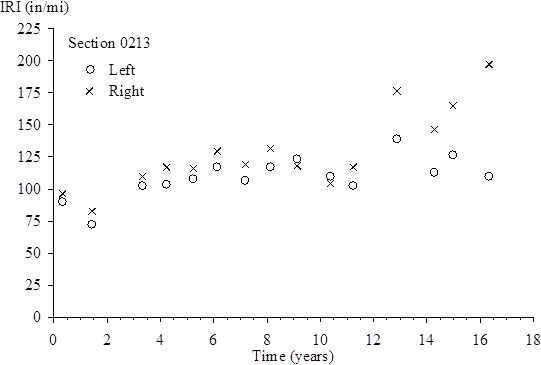
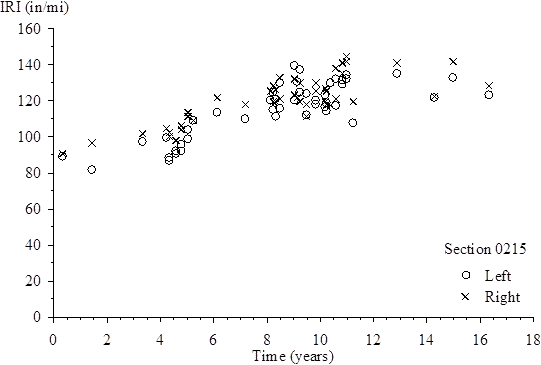
Figure 1 and figure 2 show left and right IRI values for sections 0213 and 0215 over their monitoring period. The graph for section 0213 includes 30 summary IRI values, 2 per visit over 15 visits. The graph for section 0215 includes extra IRI values from the seasonal visits listed in table 3 . The figures show the IRI values versus time in years. In this case, years is defined as the number of years between the measurement date and the date the site was opened to traffic (1-Oct-1993).
|
| © ADOT |
| Figure 1. Graph. IRI Progression for Section 0213. |
|
| © ADOT |
| Figure 2. Graph. IRI Progression for Section 0215. |
On section 0213, the IRI increases overall, but the roughness does not increase consistently as time progresses. For example, the IRI values in visit 01 (0.32 years) are greater than the values in visit 02 (1.42 years), and the IRI values in visit 12 (12.86 years) are much greater than in visit 11 (11.20 years) or visit 13 (14.25 years). In addition, the right IRI increases over the last three visits, whereas the left IRI does not. The analyses in this report show that the first two observations are due to diurnal changes in curl and warp and the third is not.
On section 0215, the IRI progression reverses direction many times. The eras from 4 to 6 years and 8 to 11 years include several pairs of IRI values from two different times on the same day and a series of seasonal measurements. Of the 16 diurnal pairs collected on section 0215 (listed in table 3), the later set of repeat measurements produced IRI values that were between 2.2 inches/mi above and 19.0 inches/mi below the earlier set of repeat measurements from the same day. In addition, the four seasonal visits that took place in year 9 produced a range of IRI values of 27.2 inches/mi on the left side and 20.5 inches/mi on the right side.
The analyses in the next sections aim to explain the inconsistent progression in IRI on all the test sections and show that some short-term changes in IRI are due to curl and warp and others are not.
This study applied typical diagnostic profile analyses such as inspection of filtered elevation profile plots, roughness profile plots, and power spectral density plots to explain the roughness, roughness distribution, and roughness progression of each section. Appendix D provides detailed findings from these analyses that support the discussion of each section in the summary.
These analyses showed that slab curl and warp contributed to, and in some cases dominated, the roughness of many of the test sections. In addition, changes in curl and warp offered a possible explanation for the disorderly progression in roughness with time that occurred on some of the test sections. For example, section 0215 exhibited a very unsteady progression in roughness with time, including large diurnal and seasonal changes in years 4–6 and 8–12.
The analyses in the following sections helped account for changes in slab curl and warp to determine what share of the roughness of each profile was due to slab effects.
Statistical analysis segregated the portion of roughness caused by curl and warp within a profile from the rest of the irregularities. The levels of curl and warp present within each profile were estimated using slab-by-slab analysis of local profile segments. The procedure quantified the level of curl and warp on each slab using a pseudo strain gradient (PSG). PSG is the gross strain gradient required to deform a slab into the shape that appears within the measured slab profile from a flat baseline.
The PSG value for each slab was derived using a curve fit between the measured profile and an expected curled slab shape using the Westergaard equation. The Westergaard equation requires estimates of pavement mechanical properties (summarized by the radius of relative stiffness). As such, the idealized slab shape was different for each test section. Estimates of these properties were developed using the LTPP database.
Appendix E describes the process of identifying the slab boundaries, and appendix F describes the methodology for estimating PSG given the measured profile and pavement mechanical properties for each slab. Figure 3 shows results for a left-side profile of section 0213 collected in visit 09 (20-Oct-2002). The figure shows the PSG value for each slab along the profile, where slabs 0 and 33 straddle the boundaries of the section and slabs -1 and 34 are outside the section boundaries. The figure shows PSG in units of microstrain per inch (με/inch). Negative values indicate upward curl, which means that the slab edges have a higher elevation than the center.
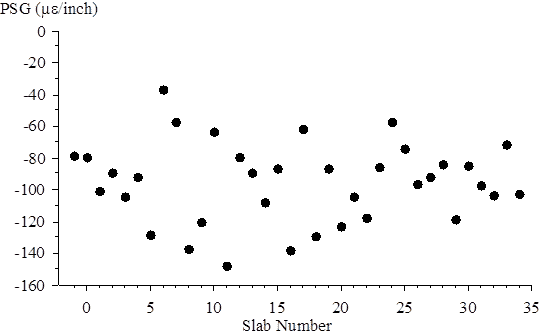
Figure 3. Graph. Left Profile PSG Values from Visit 09 of Section 0213.
Figure 3 provides an example of the variation in upward curl along the left profile of section 0213. For the purposes of examining trends over time, the average PSG value summarizes the overall curl and warp observed for the entire section. The average PSG value is -95.5 με/inch for the profile in figure 3. This is a weighted average, where the PSG of each slab contributes to the section average in proportion to the length that appears within the section. Thus, the PSG of slabs -1 and 34 do not affect the average, and the PSG of slabs 0 and 33 influence the average less than slabs 1–32.
Because this study includes five repeat measurements from each visit of each section, the average PSG values are further averaged over the five repeat measurements. For example, the five left-side profiles of section 0213 from visit 09 (30-Oct-2002) yielded sectionwide average PSG values of -95.5 to ‑93.0 με/inch, with an average value of -94.5 με/inch. Unless otherwise specified, the PSG values provided in this report are averaged over five repeat profile measurements.
Figure 4 shows the variation in average PSG for the left side of section 0213 throughout the experiment. The value of -94.5 με/inch, previously discussed for visit 09, appears on the plot 9.08 years into the experiment.
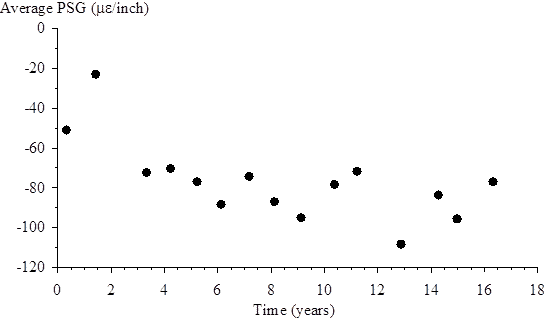
Figure 4. Graph. Average PSG versus Time for Left Side of Section 0213.
The data in figure 4 provide a way to examine the gross changes in curl and warp over time for the left profile of section 0213. The levels of downward curl shown in figure 4 and the left IRI shown in figure 1 follow similar trends, including the following:
Indeed, the variations in absolute average IRI over time imitate many of the details of the variations in PSG over time for the left side of section 0213.
Inspection of PSG values versus time showed a similar relationship between PSG and IRI over most of the test sections in the experiment. In some cases, variation in PSG was proportional to variation in IRI but only over the early part of the experiment and during eras of the pavement life where distress remained constant. The following section examines the relationship between PSG and IRI in detail.
Several trends in the variation of PSG over time on multiple sections help explain the disorderly progression in IRI shown in the figures in appendix C. First, on many of the test sections, like section 0213, the upward curl was much more severe in visit 01 (25-Jan-1994) than in visit 02 (5‑Mar‑1995) or the PSG reversed from negative (upward curl) in visit 01 to positive (downward curl) in visit 02. Visit 01 was conducted at about 6 a.m., and visit 02 was conducted at 11 a.m.
Second, PSG values were more negative in visits 12 (11-Aug-2006) and 14 (20-Sep-2008) than in visits 11 (12-Dec-2004), 13 (30-Dec-2007), and 15 (25-Jan-2010) on sections 0213, 0215–0219, 0220, 0222, and 0262–0268. This indicates a decrease in upward curling in visits 11, 13, and 15 compared to visits 12 and 14. Visits 12 and 14 occurred shortly after midnight, and visits 11, 13, and 15 occurred after sunrise. Section 0214 also exhibited a decrease in downward curl in visits 12 and 14.
Third, sections 0215, 0219, 0223, 0224, and 0264–0266 exhibited a net increase in the magnitude of upward curl over the life of the experiment. The trend was not orderly on any of the test sections, and it typically included the short-term variations discussed for visits 01 and 02 and visits 11–15. Figure 5 provides an example, showing the average PSG for the left- and right-side profiles of each visit for section 0223. Diurnal cycles in temperature and sunlight explain the short-term variations in PSG but not the trend toward increasing upward curl over the life of the experiment.
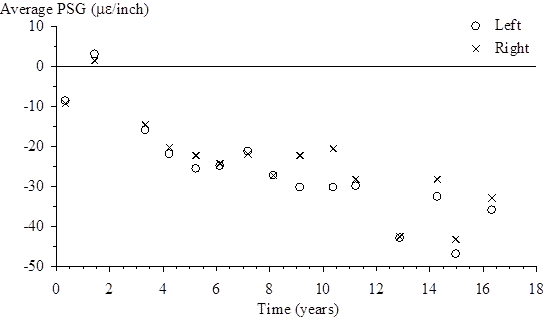
Figure 5. Graph. Average PSG versus Time for Section 0223.
In contrast to the rest of the test sections, section 0214 exhibited a trend from upward curl at the start of the experiment to increasingly downward curl at the end. As shown in figure 6, the PSG values increased most aggressively from negative to positive in years 4–10. Figure 7 shows that the slabs curled upward throughout the section in visit 01 (0.32 years). However, the trend toward downward curl is strongest near the start of the section in visit 10 (10.34 years) and becomes increasingly weak toward the end of the section. A decrease in severity of map cracking from the beginning to the end of the section may explain this trend.
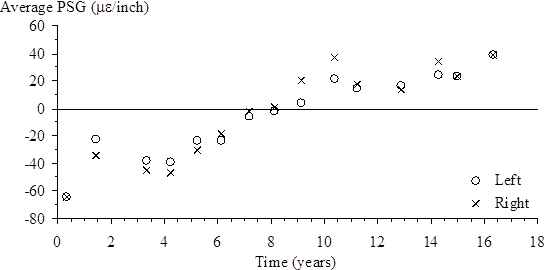
Figure 6. Graph. Average PSG versus Time for Section 0214.
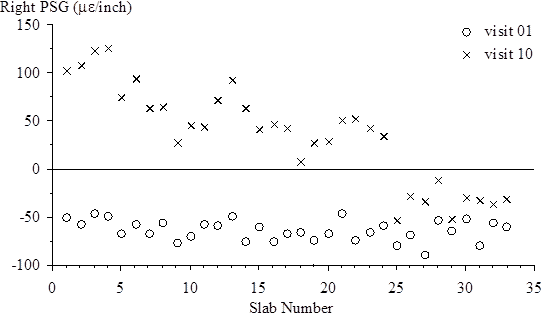
Figure 7. Graph. Right PSG Values from Visits 01 and 10 of Section 0214.
This section addresses the penalty to IRI caused by curling. On the low-strength sections, a very strong statistical relationship was found between variations in PSG and variations in IRI. Using this relationship, the roughness caused by slab curl was separated from the roughness caused by other sources. This provided a way to look for increases in IRI caused by surface deterioration without the erratic changes caused by variations in curl and warp over time. This also provided a way to directly estimate the improvement in IRI that is possible with a reduction in slab curl.
Originally, the study sought to relate PSG to IRI theoretically. For example, an artificial profile constructed using a pattern of 15-ft-long slabs with profiles equivalent to the Westergaard equations showed increases in IRI of 1.74 inches/mi per 1 με/inch increase in PSG when the radius of relative stiffness was 39.37 inches. However, statistical observations using measured profiles showed that the variation in IRI with PSG was roughly three-quarters as large. This is because more roughness appeared at transitions between slabs in the theoretical profile, where the slope break between slabs was sharper. In the measured profiles, the slope at slab ends was not as large, most likely due to the influence of dowel bars and slab weight, which were not included in the model that produced the theoretical slab profile.
Instead, the statistical relationship between IRI and PSG was derived using detailed profile measurements collected for the FHWA project “Inertial Profile Data for Pavement Performance Analysis.” (2) Measurements from the FHWA study include 124 profiles of sections 0213–0224 collected over a 1-year cycle. The measurements include four seasonal visits (17-Aug-2003, 13‑Dec‑2003, 9-Mar-2004, and 3-Jul-2004) and four rounds of measurement per visit (before sunrise, after sunrise, mid-afternoon, and after sunset). Seven or more repeat profiles were collected in each of the 16 rounds of measurement. One of the data collection rounds commenced less than 11 h after LTPP visit 11 (12-Dec-2003).
The FHWA profile measurements occurred throughout a diverse mix of ground temperature, air temperature, weather, and intensity of solar radiation. Thus, large changes were observed in curl and warp without large changes in other surface conditions that affect IRI, such as distress. Unfortunately, the profiles from the FHWA study did not cover sections 0260–0268.
Figure 8 shows the relationship between IRI and PSG on the right side of section 0215 using the FHWA data set. The figure shows a distinct IRI-PSG pair for each of 122 passes by the profiler. A least-squares linear fit indicates that the IRI changes 1.3754 inches/mi per 1 με/inch of change in PSG, with a standard estimate of error (SEE) of 2.23 inches/mi. The close relationship observed depends on using measurements collected over a relatively short portion of the pavement life so that changes do not occur because of other contributors to the IRI, such as surface distress. The high correlation is also due to the large range of observed PSG values.
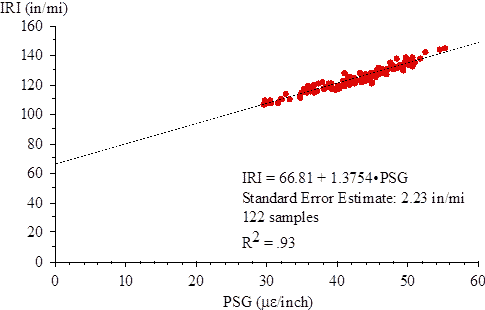
Figure 8. Graph. IRI versus PSG for Right Side of Section 0215 (FHWA Data).
Figure 8 provides noteworthy insight into the contribution of curl and warp to the roughness of section 0215. The PSG values for the right side covered a range of 30–55 με/inch in just 1 year, and the IRI exhibited a commensurate variation of 38 inches/mi. Further, the plot suggests that if the apparent curl were eliminated, the IRI of the right side would be about 67 inches/mi, which is less than half the peak value.
Linear regression of IRI against PSG demonstrated a similar level of correlation for the low-strength test sections in the standard experiment. Table 4 lists the slope, intercept, SEE, and correlation coefficient for the left- and right-side profiles of these sections.
In table 4, the test sections are listed in order of surface layer thickness. This illustrates the similarity in the IRI-PSG slope among structurally similar pavements. A similar dependence of the slope on radius of relative stiffness appeared in the theoretical calculations. At a higher radius of relative stiffness, IRI is higher for the same strain gradient in an artificial profile constructed using the Westergaard equation. The consistency between this trend and the influence of radius of relative stiffness on the IRI-PSG slope derived empirically is a sign that the Westergaard equation may have been an appropriate choice of an idealized profile on the low-strength test sections.
The dependence of IRI on PSG was also characterized using LTPP data from section 0215. This was possible because section 0215 is in SMP, and data collected from November 2001 through December 2004 included 3 regular profiling visits and 24 seasonal visits. Figure 9 shows the linear regression for IRI against PSG for the 135 associated profiler passes. The slope, intercept, and SEE are all exceptionally similar to the observations from the FHWA data. For the left side, the LTPP data produced a slope of 1.442 inches/mi per 1 με/inch.
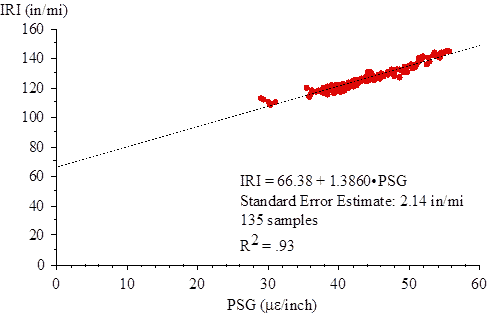
Figure 9. Graph. IRI versus PSG for Right Side of Section 0215 (LTPP SMP Data).
The agreement between figure 8 and figure 9 demonstrates that the IRI-PSG relationship derived from one data set may be applied to data from another, so long as appropriate measurement practices are followed. (An analytical procedure with this quality is called “transportable” in the classic road roughness literature.(9)) The consistency between data sets also indicates that the SMP produced sufficient data to investigate the IRI-PSG relationship and other rigid SMP test sections may also produce sufficient data for this analysis.
Unfortunately, the regression for the high-strength sections often produced low correlation. Table 5 lists the statistics produced by the FHWA data set for the high-strength sections. In some cases, the low overall range in PSG values over the 16 rounds of testing caused low correlation to IRI. Curl and warp also caused only a small share of the overall roughness on many of the high-strength sections, which often led to poor curve fits in the slab-by-slab analysis. High correlation (and low SEE) existed for the right-side profiles on sections 0218, 0220, and 0222. However, the variations in IRI over the monitoring period were low relative to the SEE for these sections as compared to the low-strength sections.
For the low-strength sections, the relationship between IRI and PSG was sufficient to support empirical estimates of the contributions curl and warp make to each IRI value. This was done by obtaining the absolute average PSG value for a given visit of a given section, applying the slope from table 4 to it, and subtracting the result from the raw IRI value. Graphically, this is equivalent to placing a point in the appropriate location on an IRI versus PSG plot such as figure 8 and using the IRI-PSG slope to project the point to the IRI axis.
The product of the PSG and the slope from table 4 is the portion of the IRI associated with curl, warp, and other profile features that consistently appear with the same shape as the Westergaard equation. The balance is the roughness linked to other sources, such as built-in defects and surface distress. Figure 10 through figure 21 provide the results of this method for the low-strength test sections.
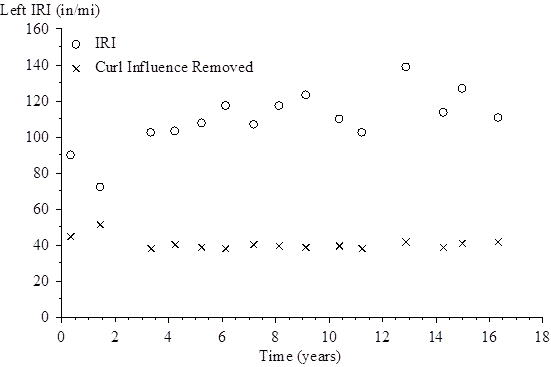
Figure 10. Graph. Left IRI Progression for Section 0213.
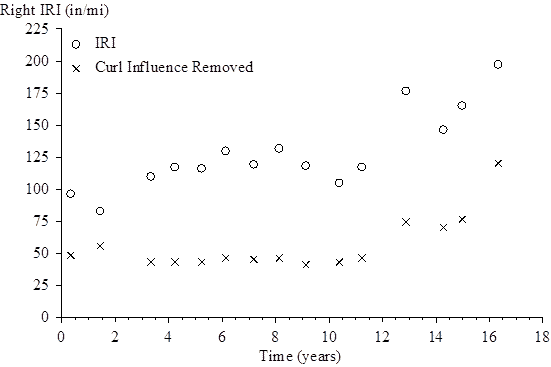
Figure 11. Graph. Right IRI Progression for Section 0213.
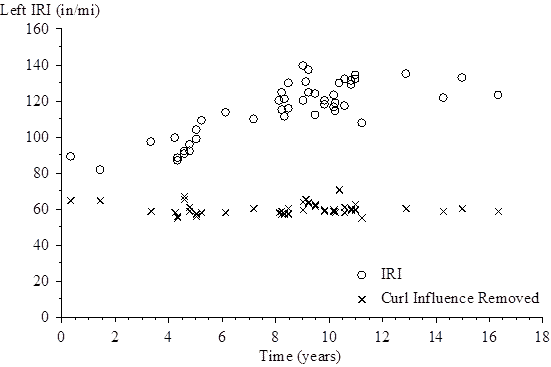
Figure 12. Graph. Left IRI Progression for Section 0215.
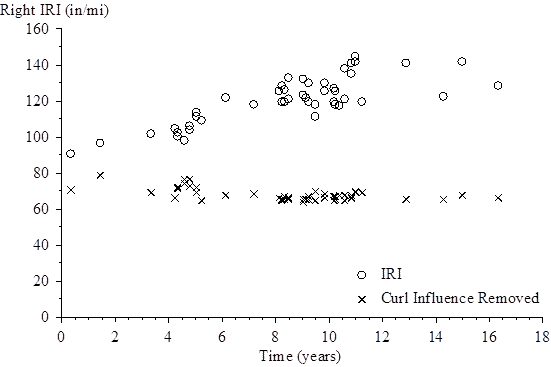
Figure 13. Graph. Right IRI Progression for Section 0215.
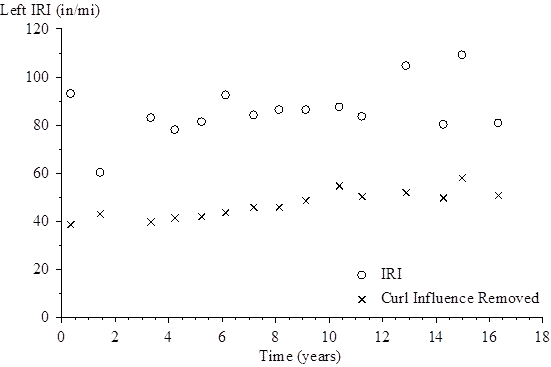
Figure 14. Graph. Left IRI Progression for Section 0217.
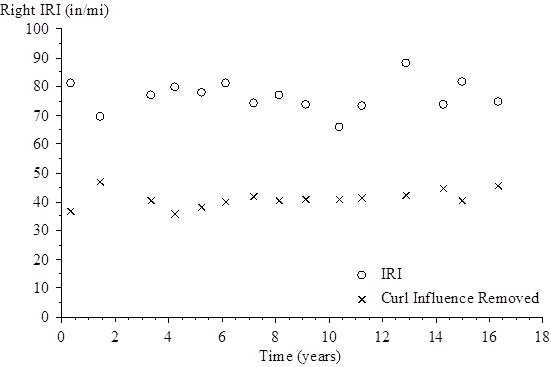
Figure 15. Graph. Right IRI Progression for Section 0217.
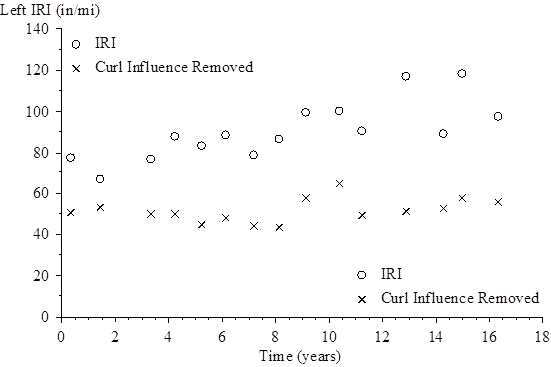
Figure 16. Graph. Left IRI Progression for Section 0219.
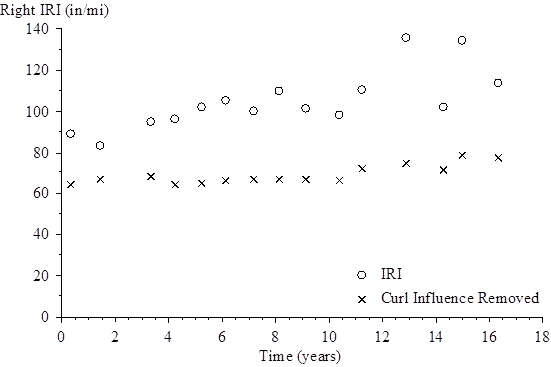
Figure 17. Graph. Right IRI Progression for Section 0219.
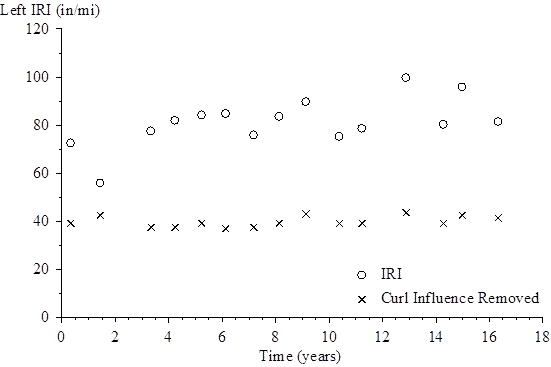
Figure 18. Graph. Left IRI Progression for Section 0221.
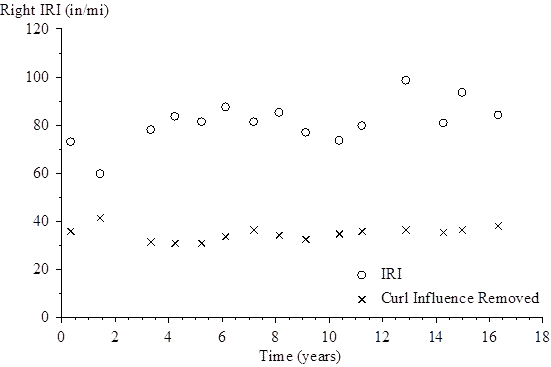
Figure 19. Graph. Right IRI Progression for Section 0221.
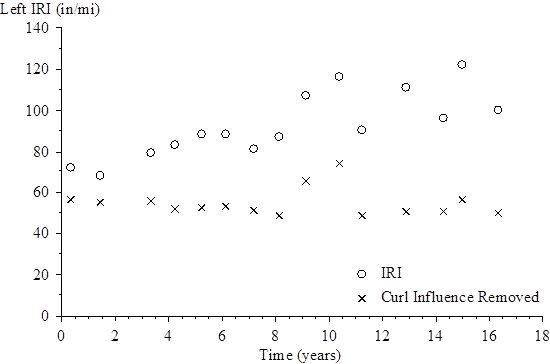
Figure 20. Graph. Left IRI Progression for Section 0223.
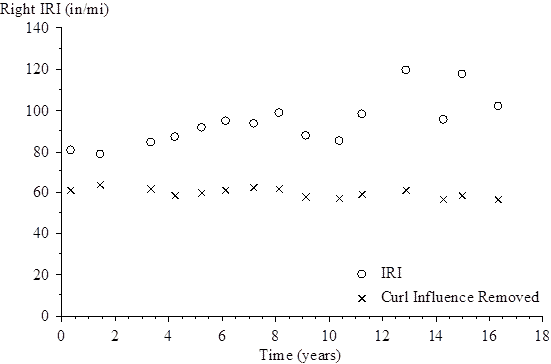
Figure 21. Graph. Right IRI Progression for Section 0223.
This analysis depends on some key assumptions. First, the idealized slab shape must be appropriate. If so, the individual curve fits for slab profiles will have high quality, like the example in appendix F. Second, empirical derivation of IRI-PSG slope requires measurements over a large range of PSG values. Third, these analyses used the average absolute PSG value as a basis for comparison to IRI. As such, the quality of the relationship breaks down for test sections where some slabs curl upward and others curl downward. This was often the case in visit 02 (1.42 years). Lastly, the method may overestimate the influence of curl and warp on IRI if other roughness is present that appears consistently as a pattern with the same characteristic length as the joint spacing. It is important to monitor the quality of the curve fits and qualitatively look for potential features of this type.
Figure 10 and figure 11 provide sample results for section 0213. The figures show the progression in left and right IRI and the portion of the IRI that remained after removing the influence of curl and warp. On section 0213, the overall IRI values increased over time, but they were erratic. This analysis shows that, without curl and warp, the roughness on the left side was steady throughout the experiment, and the roughness on the right side was steady over the first 11 years of the experiment.
Since longitudinal cracking caused the increase in IRI on the right side after 11 years, it also contributed to the roughness in the plot after removing the influence of curl and warp (see appendix D). The right side of section 0213 provides an example of using the IRI-PSG relationship to distinguish the roughness progression caused by curl and warp from the roughness progression caused by surface distress.
Figure 12 and figure 13 provide sample results for section 0215, including the seasonal visits. As on section 0213, the raw IRI values increased erratically on section 0215, with additional scatter caused by IRI values that differed between morning and afternoon passes. For example, seasonal visits S11 and S12 (8.31 years) produced an IRI on the left side of 121.8 inches/mi at 10 a.m. and 111.6 inches/mi at 3 p.m. With the influence of curl and warp removed, these values changed to 58.0 and 57.7 inches/mi, respectively.
With the influence of curl and warp removed, the IRI values for section 0215 progressed much less erratically. Further, the overall IRI level held steady over the experiment. This suggests that a long-term increase in upward curl and warp caused net increases in raw IRI of 35 inches/mi on the left side and 39 inches/mi on the right side.
Figure 14 through figure 21 show the results for sections 0217, 0219, 0221, and 0223. These sections also exhibited erratic changes in IRI caused by curl and warp. With the influence of curl and warp removed, the IRI values were much lower and either increased slowly or held steady throughout the experiment, with two exceptions. On the left side of sections 0219 and 0223, the IRI values were much higher in visits 09 (9.08 years) and 10 (10.34 years) than in the previous and following visits, even after removing the influence of curl and warp (see figure 16 and figure 20). This is because other factors caused the increased roughness.
On both sections, spectral analysis for the left side profiles revealed additional content in the 8–11-ft wavelength range in visits 09 (9.08 years) and 10 (10.34 years) that did not appear in other visits. This phenomenon appeared prominently on sections 0214, 0216, 0218, 0219, 0223, and 0224 and to a lesser extent on sections 0215, 0217, 0220, and 0222. In many cases, this effect increased the IRI of some but not all repeat measurements. Appendix D provides an example for section 0224, where the effect was strongest. On many of these sections, the IRI progression plots (appendix C) or the standard deviation of IRI for the left side (appendix B) showed some evidence of this effect, but the influence of curl and warp obscured it. The source of additional roughness in the 8–11-ft wavelength range is not clear, but the affected test sections all appear as a group along the site.
Traditional profile analysis also revealed that faulting contributed heavily to the roughness of some test sections. A simple algorithm provided faulting estimates at each joint. This included an algorithm for finding the joints, as described in appendix E, and a simple calculation of the difference in elevation downstream of the joint and elevation upstream of the joint.
To exclude the narrow dips at the joint from the calculation, the faulting algorithm excluded 6 inches of profile on either side of the joint and used the average elevation over 6 inches of profile on either side of the excluded area. In visits 01 (0.32 years) and 02 (1.42 years), only one profile point appeared within this range for the approach and leave slabs. In later visits, the calculation included at least six points on either side of the joint.
All test sections except 0262 and 0265 produced average faulting values of less than 0.05 inches throughout the experiment. As described in appendix D, sections 0262 and 0265 faulted, the severity of faulting grew throughout the experiment, and the increase in IRI with time was primarily due to faulting. Figure 22 and figure 23 show the faulting estimates for the left and right profiles on these sections.
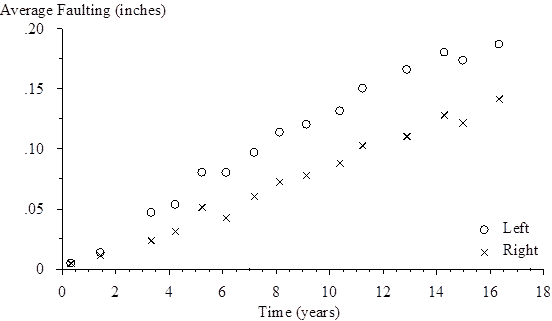
Figure 22. Graph. Faulting for Section 0262.
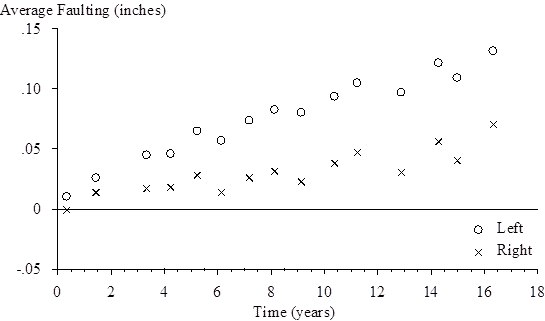
Figure 23. Graph. Faulting for Section 0265.